

Asset Allocation Weekly (May 4, 2018)
by Asset Allocation Committee
The continued rise in long-term interest rates, with the 10-year T-note breaking above a 3.00% yield, is becoming the focus of financial markets.
Here is our updated 10-year T-note model.
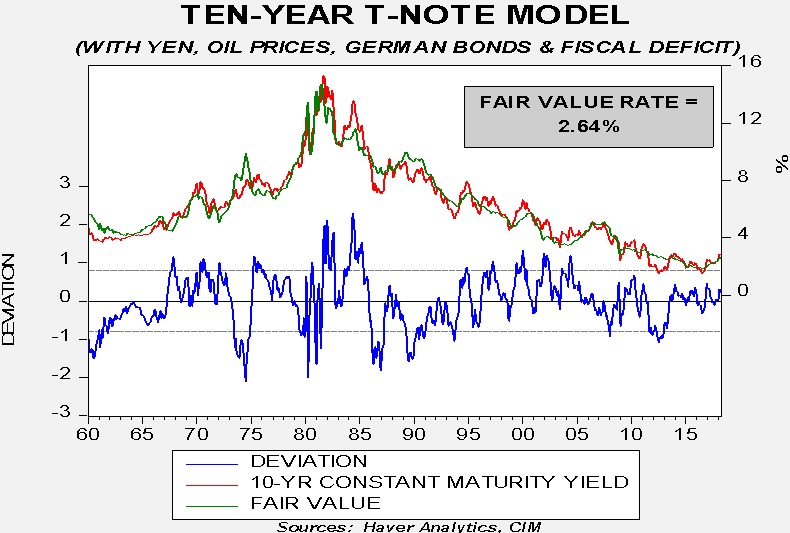
The model’s core variables are fed funds and the 15-year moving average of inflation, which we use as a proxy for inflation expectations. The other four variables are the yen, oil prices, German long-duration sovereign yields and the U.S. fiscal deficit as a percentage of GDP. The current yield on the 10-year T-note, which has recently moved above 3.00%, is running above fair value. The standard error for this model, shown on the lower part of the graph as the lines running parallel to the midpoint, is ±70 bps. Thus, a level that would signal excessively high yields is 3.35%.
Looking at the components of the model, fed funds are usually responsible for cyclical shifts in long-duration assets while changes in inflation expectations drive secular trends. The lift in yields would be significant if we were seeing a sustained rise in inflation. For example, assuming no change in any of the current variables, moving up inflation expectations by 100 bps would raise the fair value to 3.3%. Assuming fed funds at 3.00% with this level of inflation expectations would generate a fair value yield of 3.81%.
Instead, it appears that expectations of tighter monetary policy are the key factor in lifting 10-year Treasury yields. We estimate the terminal policy rate from the Eurodollar futures market, using the implied yield from the two-year deferred contract. Based off that measure, the FOMC will raise rates to around 3.00%.
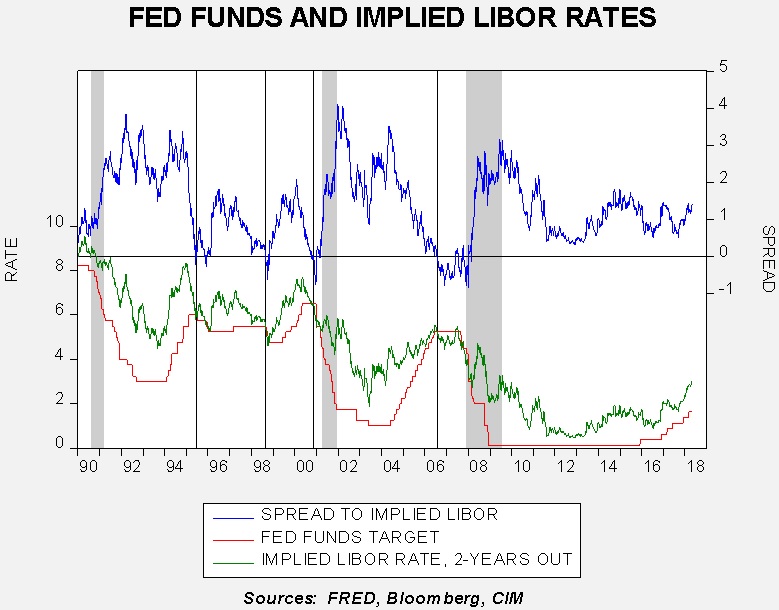
Assuming 3.00% fed funds over the next two years, our T-note model yields a fair value of 3.17%. Essentially, it appears the Treasury market has discounted a terminal fed funds rate of 2.75%; as the above chart shows, the FOMC tends to lift the fed funds rate until the implied Eurodollar rate falls below the current fed funds rate. The bottom line is that there is a high probability of increased long-duration rates but we are rapidly approaching a level that should discount policy tightening. If inflation expectations become unanchored, even higher rates are possible but we don’t think this scenario is likely.
As the first chart shows, it isn’t uncommon for the 10-year yield to overshoot fair value to reach one-standard error above the forecast; that would imply a 3.87% peak. Any yield around that level would lead us to become aggressively bullish on long-duration assets. We don’t expect that development to occur; it has been nearly 13 years since the T-note model signaled that degree of undervaluation. Assuming economic growth remains relatively modest and inflation mostly steady, the current level of undervaluation probably signals a period of consolidation.