

Asset Allocation Weekly (November 9, 2018)
by Asset Allocation Committee
In light of rising interest rates, this week we will take a look at credit spreads. But, before doing that, it makes sense to examine overall Treasury valuation.
This chart is our 10-year T-note model. It incorporates fed funds, the Japanese yen exchange rate, German sovereign 10-year yields, oil prices, the fiscal deficit as a percentage of GDP and an inflation proxy.[1]
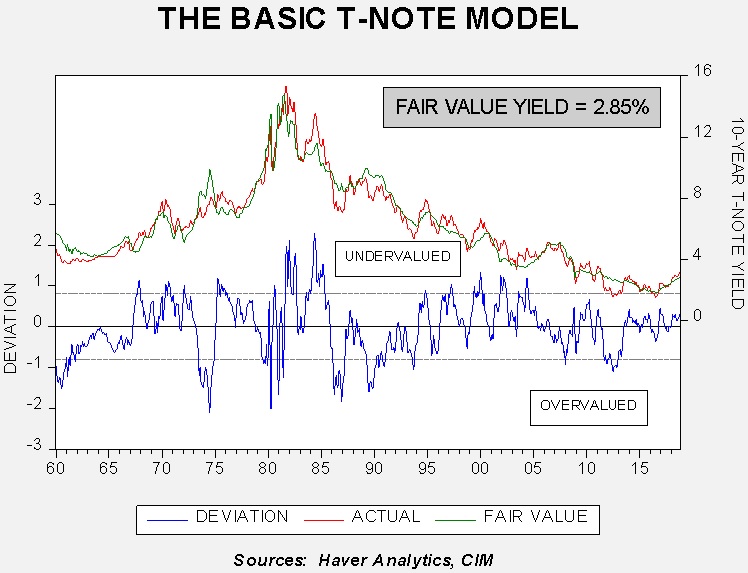
This model does suggest current 10-year yields are elevated, but not at extreme levels. However, if we assume a terminal fed funds rate of 3.25%, assuming no change in the rest of the variables in the model, fair value for the 10-year rises to 3.27%, which is near current levels. Thus, we can postulate that current yields have discounted about 100 bps of further tightening. Another interesting note is that the most significant variables in the model are fed funds and the inflation proxy. Just using these two variables in the model yields a fair value of 3.60%; if we assume another 100 bps of tightening, the terminal 10-year yield ends up at 4.10%. Compared to the broader model, it is clear that overseas factors, especially German yields, are keeping U.S. yields from rising faster. Overall, we don’t expect these foreign factors or oil prices to change in such a way as to support higher yields, so we don’t expect a rise in the 10-year yield to exceed 3.50% unless (a) inflation expectations become unanchored, or (b) the FOMC signals it will raise rates much more than expected.
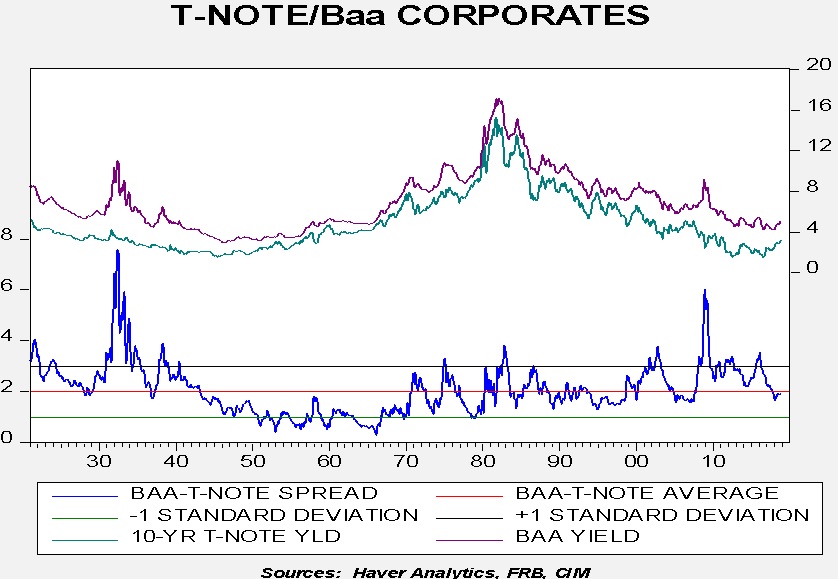
Thus far, the impact on credit spreads from rising Treasury yields has been minor. The chart below shows investment grade spreads. Current investment grade spreads are holding near their long-term average.
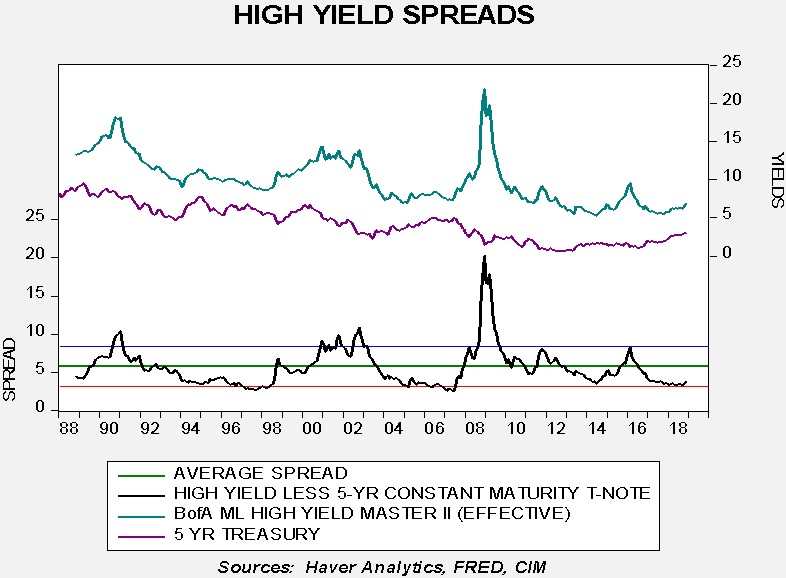
High-yield spreads have nudged higher but remain tight, with spreads holding near the bottom of their historical ranges.
The lack of spread widening is consistent with the continued low level of stress in the financial system.
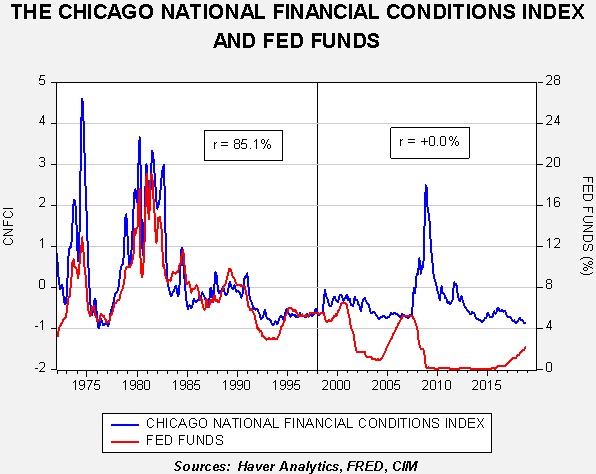
This chart shows fed funds with the Chicago FRB National Financial Conditions Index; the index rises when stress increases (or, put another way, when financial conditions deteriorate). From 1973 (when the index data begins) until 1997, the two series were tightly correlated; if the FOMC raised rates, stress rose. Stress was a “force multiplier” for monetary policy. We believe increasing transparency has removed this “tool” from the Fed; now, financial participants can so easily project the path of policy that they don’t necessarily fear the rising rates. And so, instead of seeing participants react to stress as policy tightens, we now have a situation where stress remains low only to soar. Credit spreads are a key component of the aforementioned conditions index. If spreads begin to widen, they could do so rapidly, leading to significant market disruptions. For now, all is calm, but we continue to closely watch market conditions because when they begin to deteriorate they tend to so rapidly. In asset allocation, we have tended to favor investment grade spread products but are less favorable toward high yield. If conditions start to deteriorate, we will shift allocations toward Treasuries.
[1] For an inflation proxy, we use the 15-year moving average of the yearly change in CPI. This is based off research by Milton Friedman, who postulated that investors build their inflation expectations over a long time frame.