Asset Allocation Weekly (November 2, 2018)
by Asset Allocation Committee
In light of the recent pullback in equities, there has been rising speculation that the FOMC might not increase rates as much as projected. Although possible, we are not seeing much evidence to support this position.
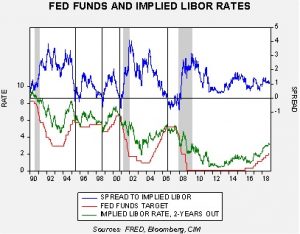
This chart shows the fed funds target along with the implied three-month LIBOR rate, two years deferred, from the Eurodollar futures market. The upper line shows the spread between the two rates. We have placed vertical lines where the spread inverts. The spread inversion has tended to signal the end of the tightening cycle.
Although the implied rate has eased from a peak of 3.30% in early October to 3.15% in the most recent reading, the overall target remains the same. The Fed, based on this analysis, will raise rates another 100 bps. The key question is if such a rate hike were implemented, would it lead to recession?
The answer to that question is whether a 3.25% policy rate would be considered “tight”? And, the answer to the second question is all about the degree of slack in the economy. If the FOMC is raising rates into an economy without much excess capacity, it is unlikely that it will take rates to a level of restrictive policy. On the other hand, if there is still slack in the economy then raising rates to the level implied by deferred Eurodollar futures could, indeed, be too tight.
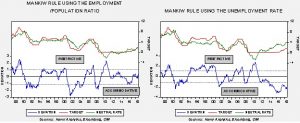
These charts show the results of the Mankiw rule, a simplified version of the Taylor rule. These charts show two different variations for measuring slack. Mankiw’s original model used core CPI and the unemployment rate. That model is shown on the right. We have created a different variation on the left, which uses the employment/population ratio. The unemployment model suggests that policymakers are woefully behind the curve; the neutral rate is 4.00% with restrictive policy not achieved until fed funds reach 5.50%. The employment/population model suggests the Fed has already achieved a neutral policy and should stop raising rates now. The neutral rate, according to this variation, is 1.75% with restrictive policy achieved at 2.75%.
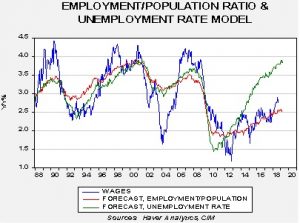
Which model is correct? We believe the employment/population model is likely the most accurate. The chart below shows a model that projects the yearly growth in wages for non-supervisory workers based either on the unemployment rate or the employment/population ratio. Both variations did about the same during the cycles since 1988, but, in the current cycle, the employment/population ratio has done a superior job of estimating wage growth. Based on the unemployment rate, wage growth should be approaching 4.0%, while the employment/ population ratio estimates a growth rate of 2.5%, a much closer estimate during this recovery and expansion. We are seeing some upward “creep” in wage growth but that may be tied to recent increases in the minimum wage. If so, the growth rate should slow because such changes tend to be infrequent.
So, what is the FOMC actually doing? It appears they are trying to pick a point between the extremes of the Mankiw variations. However, if the employment/population ratio is the right model, barring a strong improvement in this number, the FOMC is moving into dangerous territory. Given the caution shown by the Fed, we would expect to see greater concern about moving too quickly and increased talk of a “pause.”
It is important to remember that all FOMC meetings next year will have a press conference, making each meeting a chance to raise rates…or not! If the Fed begins to show signs that it is approaching neutral, we would expect equities and debt to rally. We would not expect to see such indications in December but could in early 2019. Therefore, we will continue to closely monitor the behavior of deferred Eurodollar futures. If the two-year implied rate begins to decline, we may be close to ending this tightening cycle.


