by Thomas Wash
The business cycle has a major impact on financial markets; recessions usually accompany bear markets in equities. We have created this report to keep our readers apprised of the potential for recession, which we plan to update on a monthly basis. Although it isn’t the final word on our views about recession, it is part of our process in signaling the potential for a downturn.
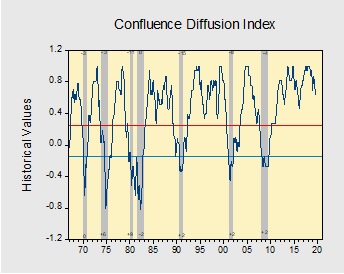
Data released for August suggests the economy is still in expansion, but a slowdown in manufacturing and signals of financial weakness continue to be a drag on the index. Currently, our diffusion index shows that nine out of 11 indicators are in expansion territory, with several indicators approaching warning territory. The index has fallen from +0.636 to +0.575.[1]
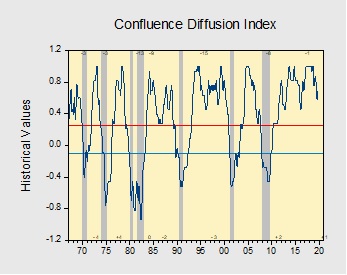
The chart above shows the Confluence Diffusion Index. It uses a three-month moving average of 11 leading indicators to track the state of the business cycle. The red line signals when the business cycle is headed toward a contraction, while the blue line signals when the business cycle is headed toward a recovery. On average, the diffusion index is currently providing about seven months of lead time for a contraction and three months of lead time for a recovery. Continue reading for a more in-depth understanding of how the indicators are performing.
[1] The diffusion index looks slightly different from last month due to adjustments we made to the formula and revisions in certain data sets.