Keller Quarterly (October 2019)

Letter to Investors

I recently had the opportunity to give a talk to a large group of investment advisors, many of whom were longtime friends.  Even though we knew each other well, given the times we’re in I felt compelled to begin with a two-part preamble concerning investing that I sometimes give when speaking to people whom I’ve not previously met.

First: we don’t invest in the world we wish we had, we only get to invest in the world we have.  These days people have such definite ideas about the way the world should be as to economics and politics that every thought they have about investing is colored by the same biases.  Such thinking is deadly to successful investing.  No one invests in the world that ought to be, but only in the world that is.  (See David Hume’s is-ought fallacy, a common logical flaw.) Rather, figure out what is going on now and invest according to the present.  Neither the utopian ideal nor its dystopian alternative are friends to successful investing today.

Second: successful investors are not forecasters, they are odds-makers.  In other words, they do not see the future, but rather they invest according to probabilities.  So many people who wouldn’t dare to believe in fortune-tellers easily believe those who claim to see the future of economics and markets.  Economic and stock market forecasters don’t claim clairvoyance or dress like Merlin (except when they are granted their Ph.D.s), but many seem happy to have the rest of us believe they have such abilities.  In fact, the demand for knowledge of the financial future is so great that there will always be a market for such seers.

Of course, no one can see the future.  (I shouldn’t have to write that.)  The best that anyone can do, whether in business or investing (or any other pursuit), is to estimate the probabilities of various outcomes and invest in favor of the highest probable outcomes.  That is easier in some professions than others, depending on the degree of regularity and the role of randomness (luck).  For example, it’s much easier to predict how many Americans will brush their teeth in 2020 than it is to predict whether America will have a recession in 2020.

Unfortunately for us in the investment business, market performance and economics are affected by a high degree of randomness.  Don’t let anyone tell you differently.  Our investment processes are geared to our estimations of the highest probability outcomes, not a prediction of the future.  That’s an important distinction.  Even though we at Confluence may occasionally use words such as “forecast” or “expected return” in our communications, rest assured that we have not gained any special resource for fortune-telling.  We are just using the conventions of language.

In his Divine Comedy, Dante discovers that fortune-tellers are in the fourth trench of the Eighth Circle of Hell.  (By Dante’s geography, that’s far down there.)  Their eternal punishment is to have their heads mounted backwards on their bodies, so that they can only see behind them and thus can only walk backwards.  In Dante’s Hell, sinners receive as punishment the logical outcomes of their actions.  Indeed, it’s my experience that those who get lucky with a stock market forecast that turns out to be correct begin thinking they really do have the “skill” to forecast market action.  They then become slaves of the past, forever living off past glories and looking for history to repeat itself.

It’s our desire to keep our eyes and feet pointed in the same direction.

We appreciate your confidence in us.


Gratefully,

Mark A. Keller, CFA
CEO and Chief Investment Officer

View the PDF

Asset Allocation Weekly (October 18, 2019)

by Asset Allocation Committee

In 2017, we introduced an indicator of the basic health of the economy and added it to the many charts we monitor to gauge market conditions.  The indicator is constructed using commodity prices, initial claims and consumer confidence.  The thesis behind this indicator is that these three components should offer a simple and clear picture of the economy; in other words, rising initial claims coupled with falling commodity prices and consumer confidence is a warning that a downturn may be imminent.  The opposite condition should support further economic recovery.  In this report, we will update the indicator with September data.

This chart shows the results of the indicator and the S&P 500 since 1995.  The updated chart shows that the upward momentum in the economy slowed last year but it does remain well above zero.  We have placed vertical lines at certain points when the indicator fell below zero.  It works fairly well as a signal that equities are turning lower, but there is a lag.  In other words, by the time this indicator suggests the economy is in trouble, the recession is very near and the equity markets have already begun their decline.

To make the indicator more sensitive, we took the 18-month change and put the signal threshold at minus 1.0.  This provides an earlier bearish signal and also eliminates the false positives that the zero threshold generates.  Nevertheless, the fact that this variation of the indicator is just below zero raises caution.

What does the indicator say now?  The economy has decelerated but is not yet at a point where investors should become overly defensive.  At the same time, the 18-month change in the indicator has fallen below zero; in 2016, this situation led to several months of sideways market activity.  If we continue to see the lower chart hover around zero, the greater the likelihood that equities will flatten.  Thus, reducing equity risk by rebalancing for a more defensive equity sector exposure would be prudent.

View the PDF

Asset Allocation Quarterly (Fourth Quarter 2019)

  • The U.S. Federal Reserve and other central banks are expected to continue their accommodative postures, especially considering issues stemming from trade impediments.
  • While we retain a relatively sanguine view of the U.S. economy over our three-year cyclical forecast period, we recognize there is increased potential for an economic downturn.
  • Each strategy reflects a more neutral posture, with risk exposure being trimmed and all residing in the U.S.
  • Within equities, our style guidance has shifted to 60% value/40% growth.
  • The prospect of trade-based earnings compression leads us to lean toward firms with larger market capitalizations, particularly those with more defensive characteristics.
  • Heightened geopolitical uncertainty and the potential for elevated volatility in global equity markets encourages an increased allocation to long-term U.S. Treasuries and gold.

View the complete PDF


ECONOMIC VIEWPOINTS

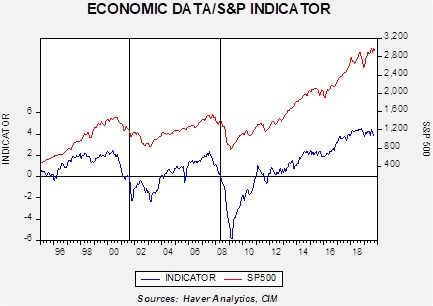
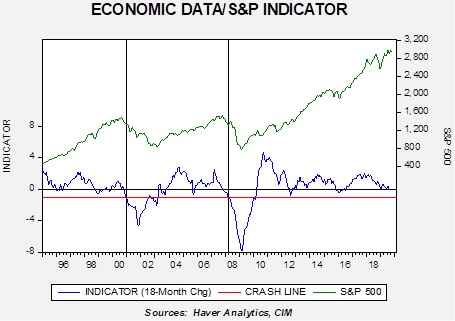
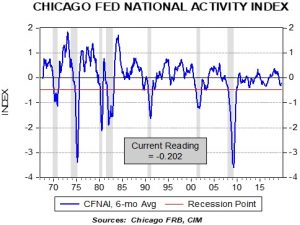
The overall economic picture, while still positive, has exhibited recent signs of lethargy. Sentiment remains elevated, though some important surveys are lower than earlier in the year. As an example, the Duke University CFO Global Business Outlook for Q3 2019 indicates less optimism and has trended down from this period last year.[1] Earnings may come under pressure, particularly from trade, as firms continue to absorb the cost of tariffs and reorder supply chains. In addition, as the accompanying chart illustrates, the Chicago Fed’s National Activity Index is measuring softness at a level last seen in 2015.

On the plus side, GDP prints have been positive as have corporate earnings surprises over the latest quarter. The Federal Reserve shaved a quarter-point from the fed funds rate in each of its past two meetings and announced the curtailment of the reduction of its balance sheet beginning on August 1. Owing to recent primary dealers funding pressures, the Fed also expanded its overnight reverse repurchase facility, effectively increasing its balance sheet. It also announced a $60 billion per month increase in the balance sheet through February 2020.

While we believe the Fed will continue to exhibit an accommodative stance, with the potential for further cuts to the fed funds rate and expansion of its balance sheet to preserve short-term funding needs, the Fed may have been too tardy in its pivot to easing. Consequently, there is the potential for a decrease in economic activity.

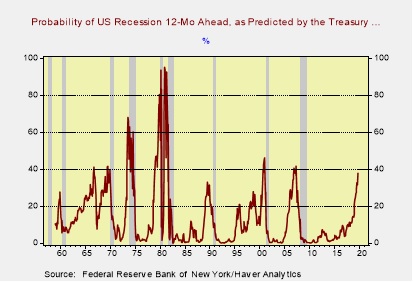
This chart estimates the probability of recession, a year into the future, based on the yield curve. The current level would be consistent with a recession later next year. In general, the financial indicators of the business cycle are signaling an increased likelihood of recession. On the other hand, purely economic indicators are still signaling a modest expansion. Overall, we would not shift portfolios to a fully defensive posture until both types of indicators indicate recession.

Global economic conditions are similarly mixed. In his last maneuver as chair of the European Central Bank, Mario Draghi furthered the ECB’s ultra-easy monetary policy. Similarly, the Bank of Japan noted it may take preemptive action against economic risks through greater easing. Germany’s GDP declined slightly last quarter and is expected to remain sluggish, especially as its export-oriented economy is influenced by trade tensions. Conversely, the global appetite for yield has helped to lower financing costs. Globally there is roughly $15 trillion of negative-yielding debt, representing almost a quarter of total debt outstanding. This helps support global economies, making it easier for marginal companies to remain solvent, yet with distortions that could hold longer term consequences.

Against this varied backdrop, we find it prudent to lessen our historically high allocations to risk-based assets, preferring to adopt a more neutral posture with associated offsets as detailed in the strategy section of this document (p.5). In deference to global economic uncertainty, all risk exposures remain in the U.S.


[1] https://www.cfosurvey.org/wp-content/uploads/2019/09/2019-Q3-US-Key-Numbers-1.pdf

STOCK MARKET OUTLOOK

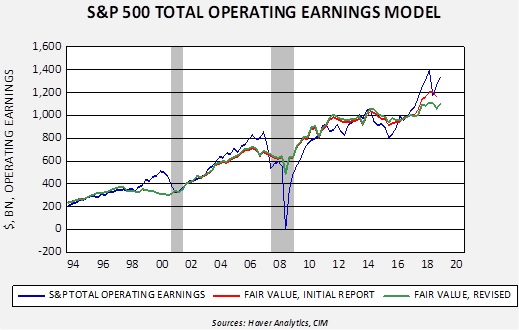
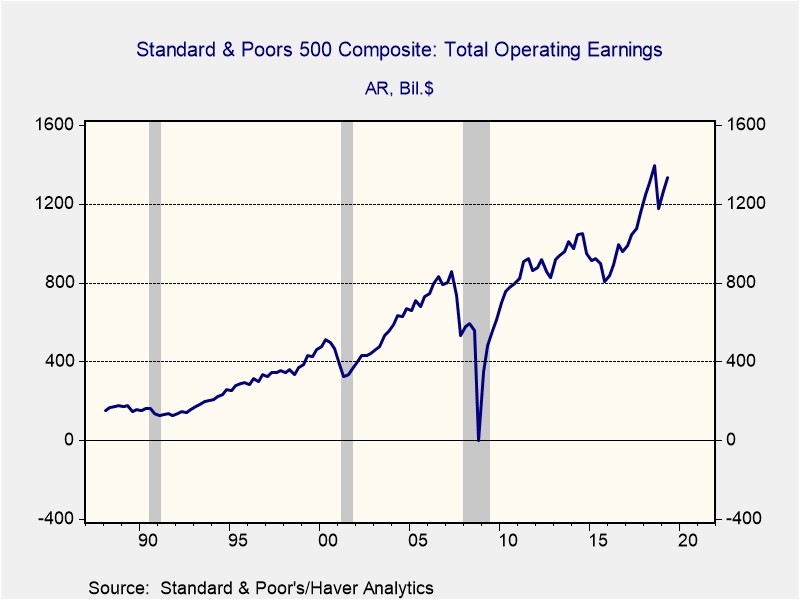
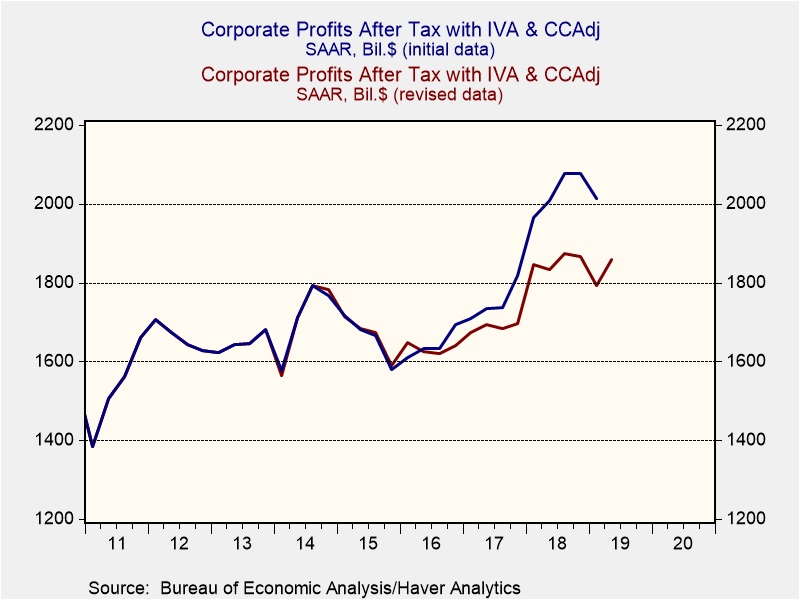
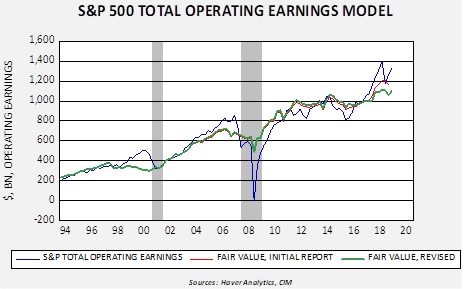
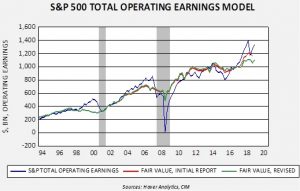
In the U.S., earnings growth is likely to be more restrained than what we have experienced over the past three years. As noted above, the CFO survey by Duke University is more muted, with optimism regarding the U.S. economy as well as their own companies lower than prior quarters. Another complication to the earnings picture is the revision to the Bureau of Economic Analysis [BEA] profit calculations. Prior to the revision the operating earnings for the S&P 500 were marginally elevated, yet within model ranges. However, due to the revision, our model suggests that absent a durable catalyst, pressure on earnings growth is likely. As a result, we are reducing our allocations to risk assets and concentrating in the larger capitalization, higher quality segments of U.S. stocks.

As with the past several quarters, we express near-term caution regarding non-U.S. developed and emerging markets. Despite valuations for non-U.S. stocks generally being attractive relative to U.S. counterparts, the elevated level of global economic uncertainty encourages our purely domestic exposure. Within investing styles, we have initiated a 60/40 tilt to value over growth and have introduced an allocation to a quality factor focusing on profitability, earnings quality and lower leverage. Additionally, we have modified the large cap equity sector weightings, retaining a slight overweight to Technology and introducing overweights to the Consumer Staples and Health Care sectors. Among market capitalizations, current exposures now favor large capitalization companies over mid-cap and small cap. Although trailing valuations of lower market cap companies appear attractive, the potential for earnings compression leads us to lean toward firms with larger market capitalizations, particularly those with more defensive characteristics.

BOND MARKET OUTLOOK

The more accommodative posture of the Fed combined with the global appetite for yield should lead to a normally sloped yield curve over the course of the next several quarters. Over our three-year forecast period, we regard longer term Treasuries as relatively attractive given the global yield appetite and the potential for gravitational pull exerted by $15 trillion of bonds outstanding with negative yields. Additionally, longer term U.S. Treasuries should prove resilient in the event of more volatile global equity markets. Although nearly $5 trillion of corporate debt will be maturing before 2023, our caution is directed toward speculative grade, or high yield, corporate bonds where we expect spread widening to occur.

The duration of bond holdings in the strategies with income objectives has been extended slightly, accruing from our forecast for an accommodative Fed, a slowing economy, lack of inflationary pressure and global demand for bonds. We retain the laddered structure as a nucleus beyond the short-term segment in these strategies.

OTHER MARKETS

Despite the outsized returns that many REITs have enjoyed during 2019, the combination of our forecast for rates, the lack of excesses in the segment and the more diversified pool of enterprises leads to our constructive view on REITs. As a result, REITs are included in the income-oriented strategies given the diversified income stream they provide.

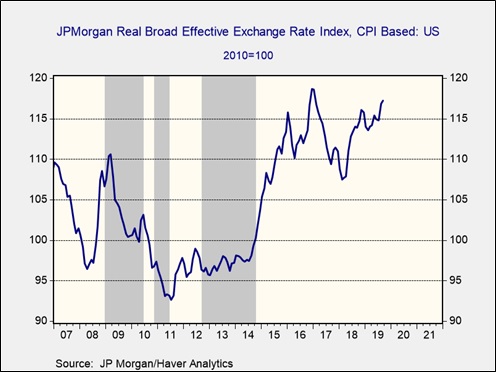
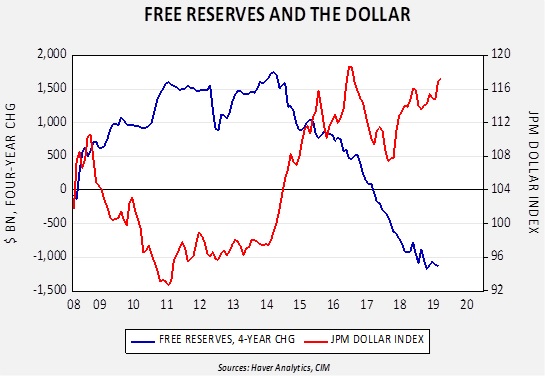
We have increased the prior allocation to gold given its ability to offer a hedge against geopolitical risks combined with the safe haven it can afford during an uncertain climate for both equities and the U.S. dollar.

View the complete PDF

Weekly Geopolitical Report – The End of the Carter Doctrine: Part I (October 14, 2019)

by Bill O’Grady

In our 2018 Mid-Year Geopolitical Outlook we opened the report with an analysis of America’s evolving hegemony.  We noted that America’s hegemonic narrative centered on containing communism.  This factor united Americans to accept the burden of the superpower role.  However, embedded in that commitment to contain communism was the “freezing” of three conflict zones.

In Part I of this report, we will identify and reiterate the need to stabilize these three areas in order to maintain global peace.  We will focus on the Middle East and discuss the development of the Carter Doctrine and examine how the doctrine has been enforced since its inception.  In Part II, we will discuss the reasons for the breakdown of the order prior to President Trump and follow this discussion with the impact of the current president.  We will project the likely actions of the nations in the region and, as always, conclude with market ramifications.

View the full report

Asset Allocation Weekly (October 11, 2019)

by Asset Allocation Committee

The financial markets have been roiled recently by the apparent shortage of liquidity in the repo markets.  Our take is that the problem is twofold—there are regulatory problems that mean the banking system requires more in reserves than it did prior to the Great Financial Crisis, and there are likely industry concentration issues that are exacerbating the issue.  Although we don’t expect the repo situation to become a systemic problem, there are potential second order effects that could affect financial markets.

Ultimately, the repo situation makes it clear that the Fed has reduced its balance sheet more than it should have.  Therefore, the fix will require expanding the balance sheet again.  As a result, other than to calm the short-term money markets, we have been searching to figure out what other markets might be affected by a new expansion of the balance sheet.

When the Bernanke Fed implemented the three phases of quantitative easing (QE), one of the overlooked areas of impact was the dollar.

The areas in gray show periods of QE; in the first two events, the dollar clearly weakened.  In the third episode, the dollar did weaken going into the event but mainly was steady at low levels.  However, the dollar soared as the Fed signaled the end of QE.

One way to examine the effect of the balance sheet on the banking system is to monitor free reserves.  These are banking reserves that are above the level of required reserves.

This chart examines the relationship between the four-year change in free reserves and the JPM dollar index.  The key point is that the level of reserves matters less to the dollar than the direction of change.  If the Fed begins to reflate its balance sheet, it will likely cause free reserves to rise.  That action will likely be dollar bearish.  Although monetary aggregates are not the sole driver of the path of the dollar, given that other measures have suggested the dollar is overvalued, a return to some sort of QE should be considered a bearish event for the greenback.  In general, a weaker dollar is bullish for gold and commodities, along with foreign equities, especially emerging markets.

View the PDF

Weekly Geopolitical Report – The Japan-South Korea Dispute: Part II (October 7, 2019)

by Patrick Fearon-Hernandez, CFA

In Part I of this report, we reviewed the history of Japanese-Korean relations over the last several centuries, highlighting the Japanese invasions of Korea in the 1590s and 1890s, Japan’s assassination of a Korean queen in 1895, and Japan’s colonization of Korea from 1910 to 1945.  We also showed how Japanese attitudes have been colored by Korea’s assimilation of Chinese culture and its close geographical proximity to the Japanese homeland.  As a result, we argued that the enmity between these two ancient peoples is probably much worse than most observers realize, even if their mutual dislike was subsumed under the hegemonic leadership of the United States after World War II.  Key to that process was U.S. pressure on Japan and South Korea to sign their Treaty on Basic Relations in 1965, under which Japan gave $500 million in aid to South Korea in order to settle all claims related to its colonization of the peninsula.  This week, in Part II, we’ll explain why Japanese-Korean hostilities have suddenly broken out into the open again.  We’ll conclude by discussing the implications of the dispute for the countries’ economies and for investors.

View the full report

Asset Allocation Weekly (October 4, 2019)

by Asset Allocation Committee

Although the convention for measuring earnings is compared to shares, Standard and Poor’s also calculates the level of operating earnings for all the stocks in the S&P 500.

The per-share value is calculated by dividing this number by the S&P divisor.  The advantage of this number versus the per-share data is that it is easier to compare total operating earnings of the S&P to the profits data compiled by the Bureau of Economic Analysis (BEA) as part of the National Product Account data.[1]  The BEA data measures total corporate profitability.

The BEA makes occasional revisions to the GDP and related reports, and recently we had a significant revision to the profits calculation.

The BEA made a meaningful revision to its profit calculation.[2]  We use this data and forecasts from the Survey of Economists conducted by the Philadelphia FRB in calculating our earnings forecast.

This chart is a model that estimates S&P operating earnings using the BEA profits data.  The value of comparing the BEA profits data to S&P operating earnings is that it does give us a warning when earnings for the index are “frothy” and probably due to decline.  In 2000 and 2006, S&P total operating earnings far exceeded the model’s fair value forecast and, as the recession approached, the index’s earnings fell to or exceeded the BEA-based model forecast.

Until the revisions, the S&P total operating earnings data was a bit high but not outside model ranges.  The revisions now suggest that current operating earnings are high and will likely decline in the coming quarters.  We still have other factors to take into account (the path of the divisor and the business cycle are two important ones) but, overall, earnings are likely to decline in the coming quarters. 

View the PDF


[1] The GDP data comes from this effort.

[2] For reference, we use after-tax profits with inventory and depreciation adjustment.

Weekly Geopolitical Report – The Japan-South Korea Dispute: Part I (September 30, 2019)

by Patrick Fearon-Hernandez, CFA

Since early July, the financial press has been reporting on a continued trade spat between Japan and South Korea.  The reports have focused on a series of tit-for-tat trade restrictions the countries have imposed on each other, which are ostensibly tied to South Korean anger over Japan’s behavior in the runup to World War II.  The reports rightly point to the conflict as an example of how trade policy has been weaponized by populist, nationalist leaders around the world, but we think it reflects much more than that.  For one thing, the dispute is only the latest chapter in a long history of conflict between the Koreans and the Japanese – a centuries-old story of mutual fear and loathing, colonization and rebellion, and even the assassination of a powerful, beautiful queen.  Just as important, the conflict is an example of how the U.S. retreat from its traditional hegemonic leadership role has unleashed dangerous conflicts that had previously been frozen.

In Part I of this report, we’ll show how today’s dispute fits into the history of Japanese-Korean relations over the last several centuries and demonstrate that the enmity between these two ancient peoples is probably much worse than most U.S. observers realize.  In Part II, we’ll discuss how the changing U.S. approach to international relations has allowed the dispute to grow.  We’ll also discuss the likely ramifications for investors.

View the full report

Asset Allocation Weekly (September 27, 2019)

by Asset Allocation Committee

Over the past few months, we have been on “recession watch.”  Our position is that the odds of a downturn are elevated but it is too soon to fully position for a downturn.   The inversion of yield curves is a reliable recession warning.  On the other hand, the economic data continues to signal a slow U.S. economy but not one seeing negative growth.  As long as the economy continues to expand, it does not make sense to underweight equities.

However, there is another possibility to consider.  Investors appear to have become overly cautious recently.

This chart shows retail money market levels on a weekly basis along with the Friday closes of the S&P 500.  The gray bars show recessions, whereas the orange bars show periods when retail money markets (RMMK) fall below $920 bn.  In general, when RMMK fall to $920 bn or below, the uptrend in equities tends to stall.  It would seem there is a certain level of desired cash, and when that level falls below $920 bn, households try to rebuild cash by either slowing their purchases of equities or selling stocks to build liquidity.

The chart shows that, in early 2018, households began to aggressively build RMMK, which would coincide with rising trade tensions.

This chart shows RMMK with the 12-month average of the Policy Uncertainty Index for trade policy.  The fit is rather obvious.  If the U.S. and China come to a short-term agreement that reduces trade worries, it might free up significant liquidity that would find its way into equities.  The potential for such flows, coupled with the usual positive seasonal trend in Q4, could lead to a strong close in equities for 2019.  This doesn’t mean that investors should not continue to watch for recession signals, but de-risking portfolios too quickly may very well be counterproductive.

View the PDF