

Author: Rebekah Stovall
Weekly Geopolitical Report – Thirty Years Since the Fall of the Berlin Wall: A Retrospective, Part I (November 11, 2019)
by Bill O’Grady
On August 13, 1961, the German Democratic Republic (GDR), otherwise known as East Germany, began construction on a barrier that would slow the emigration of Germans to the Federal Republic of Germany, known as West Germany. Prior to the construction of the wall, it is estimated that 3.5 million East Germans emigrated to West Germany from 1950 until 1961, often by crossing from East Berlin, which was under Soviet Union control, to West Berlin, under Western allied control. After the wall was built until November 9, 1989, it is estimated that 100,000 people tried to circumvent the wall, with approximately 5,000 making it across safely. An estimated 140 to 200 escapees were killed by border guards or by lethal impediments to escape.
By the spring of 1989, the Eastern Bloc was starting to unravel. On July 7, 1989, Soviet President Mikhail Gorbachev implicitly ended the Brezhnev Doctrine, which gave Moscow the power to intervene in any Warsaw Pact nation. Gorbachev stated that “any interference in domestic affairs and any attempts to restrict the sovereignty of states—friends, allies or any others, is inadmissible.”
Gorbachev was reacting to developments already in place. In 1988, Poland, which had been moving away from Moscow for some time due to the Solidarity movement, was the first to break with the Eastern Bloc. Hungary moved to a multi-party democracy in the spring of 1989, and on May 2, 1989, it began to dismantle the 150-mile border fence that separated Hungary from Austria. Over the summer and autumn of 1989, the “crack” in the Iron Curtain led to an outflow of Czechoslovakians and East Germans. Before East German officials could stop their citizens from “traveling” to Hungary, it is estimated that 30k East Germans had fled to the West. By October, demonstrations in the GDR had grown in both number and frequency. According to reports, Erich Honecker, the leader of the GDR, had planned a Tiananmen Square-type massacre of protestors.[1] However, GDR security forces refused to fire on its citizens. Honecker’s last hope was Soviet troops stationed in his country. However, due to Gorbachev’s rejection of the Brezhnev Doctrine, the Soviet forces did not intervene.
On November 1, 1989, the border with Czechoslovakia was opened to the West. East Germans began to travel west via this opening. Protests in the GDR expanded, and, on November 9, the border checkpoints on the East and West German frontier and in Berlin were opened. In effect, the Berlin Wall and the border between East and West Germany were a fiction.
The breaking of the barrier known as the Berlin Wall was a key event marking the beginning of the end of Soviet communism. By 1991, the U.S.S.R. had unraveled, and several of the numerous republics within the former Soviet Union had become independent states. The Soviet Union no longer existed.
For those of us who spent our lives under the shadow of the Cold War, seeing the Berlin Wall being dismantled was shocking. The world for anyone born after 1947 was one of two competing blocs with fundamentally different systems. The differences between the two blocs were profound and incompatible. With the unwinding of the Soviet Union two years later, anything that resembled traditional Marxism was relegated to outposts like Cuba or North Korea. Mainland China, which to this day describes itself as communist, operates as a capitalist economy.
Considering these amazing events, a number of trends emerged that reflected what leaders, at the time, believed the end of communism meant. After three decades, we now have a better notion of how well these ideas fared and can reflect on the lessons one should take from such important events. In Part I of this report, we will cover two ideas about the post-Cold War era and how well they fared. In Part II, we will cover two more ideas and conclude with market ramifications.
[1] Fulbrook, Mary. (2002). History of Germany, 1918-2000: The Divided Nation (2nd ed.). Malden, MA: Fontana Publishers. p. 256.
Asset Allocation Weekly (November 8, 2019)
by Asset Allocation Committee
The Federal Reserve, in its Financial Accounts of the United States database,[1] has created a Distributional Financial Accounts sub-database that measures household wealth by percentile groups. The data is only reported in four broad categories (Top 1%, 90% to 99%, 50% to 89%, and bottom 50%) and has a fairly short history, starting in Q3 1989. However, even with these limitations, it offers some interesting insights into which different segments of society hold wealth.
For starters, we group the data by the top 10% compared to the bottom 90%.
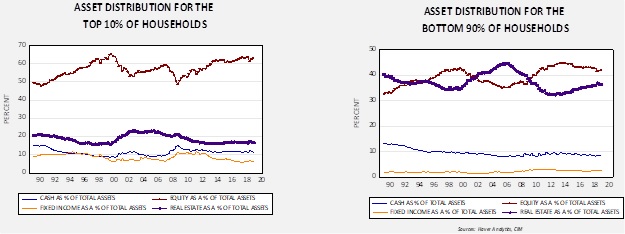
Both charts compare four categories of wealth—cash, equities, fixed income and residential real estate, including vacant land—relative to total assets. A clear distinction between the two groups is that the top 10% hold most of their wealth in equities. Real estate represents less than 20% for the top 10% but it’s around 40% of assets for the bottom 90% of households. Equities represent around 40% of assets for the bottom 90% as well. This tells us that booms and busts affect households differently relative to their wealth; a housing boom tends to make the bottom 90% wealthier, while a bull market in stocks is a bigger deal to the top 10%.
The ratio of equity and real estate wealth for the top 10% to the bottom 90% highlights this factor.
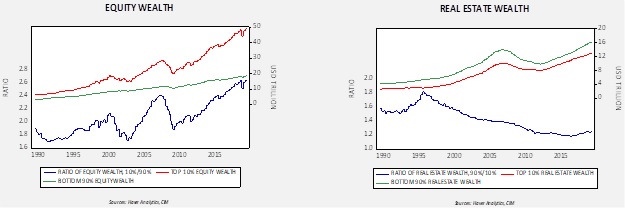
Currently, the equity wealth of the top 10% exceeds the bottom 90% by 2.6x. In terms of real estate, the bottom 90% hold more in total terms, but the two segments tend to mirror each other.
Finally, the ratios of net worth and liabilities show a similar pattern.
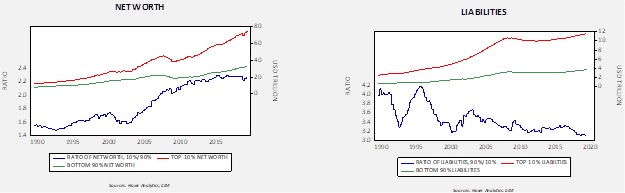
The top 10% net worth exceeds the net worth of the bottom 90% by 2.2x. Liabilities of the bottom 90% exceed those of the top 10% by 3.1x.
These charts show the relative risk to the economy from various market events. A bear market in equities will have much less of an impact on the economy than would declining home prices. Higher borrowing costs will hurt the bottom 90% more than the top 10%. And, in terms of net worth, the difference between the top 10% and the bottom 90% highlights the precarious nature of the latter.
[1] This database was previously called the “Flow of Funds.”
Weekly Geopolitical Report – Japan: Will the Tax Hike Bite? Part II (November 4, 2019)
by Patrick Fearon-Hernandez, CFA
Some of Japan’s biggest economic hiccups have started with a major tax hike, so investors are wondering what will happen following a boost in the country’s value-added tax (a type of sales tax) that went into effect early last month. To lay the groundwork for understanding the VAT hike and its implications, Part I of this report last week provided an overview of the Japanese economy and financial markets, including a discussion of how they’ve performed over the past several decades. The analysis showed just how sharply Japan’s economic growth has slowed since the boom years of the 1970s and 1980s and the implosion of its asset bubble in 1989. Part of the long slowdown simply reflects Japan’s decision to gradually eliminate its post-bubble excess capacity and bad debts. However, we also examined how Japan’s extended revaluation process has been exacerbated by a unique set of headwinds: an aging population, high debt levels and disinflation.
This week, in Part II, we’ll home in on the Japanese government’s geopolitical and domestic priorities and the reasons for its new VAT hike. We’ll also examine why the tax hike doesn’t seem to be hurting the economy as much as past hikes have. As always, we’ll conclude with ramifications for investors as they face Japan’s current economic and financial trends.
Asset Allocation Weekly (November 1, 2019)
by Asset Allocation Committee
We continue to hold a favorable outlook toward gold despite evidence that current prices may be getting a bit ahead of themselves. Our gold model puts fair value at 1391.
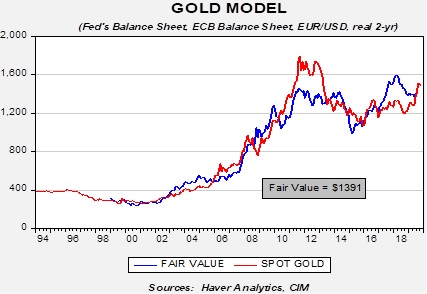
In the coming months, we expect the fair value to rise; both the ECB and the Federal Reserve have resumed expanding their balance sheets. And, the Fed will likely continue to cut rates, which would be expected to reduce the real interest rate on two-year T-notes. The dollar remains overvalued but will likely need a catalyst to trigger depreciation. Still, over time, we do expect gold prices to find support from improving fundamentals.
In addition, the high level of zero-yielding debt should be supportive.
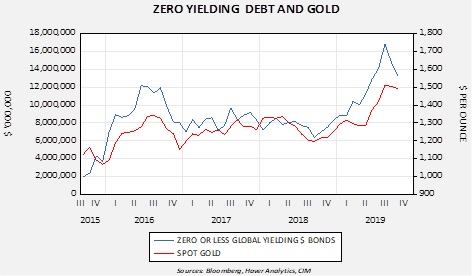
We have seen a drop in zero-yielding debt recently, but with slowing global economic growth, a renewed expansion is likely.
Finally, there is a long-term relationship between gold prices and the level of the fiscal deficit. Although the level of the current deficit does suggest, again, that gold prices might be a bit overvalued currently, the likelihood of expanding deficits should offer underlying support for gold prices.
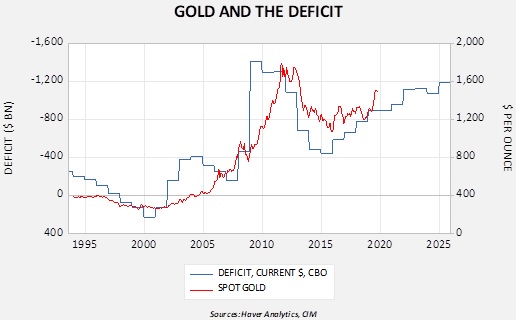
In the immediate term, we may see steady to lower gold prices but there are ample fundamental factors that should support future prices.
Weekly Geopolitical Report – Japan: Will the Tax Hike Bite? Part I (October 28, 2019)
by Patrick Fearon-Hernandez, CFA
Even though Japan has one of the world’s largest economies and accounts for a hefty share of global stock market capitalization, it isn’t getting nearly as much attention from investors as it did during its boom years in the 1970s and 1980s. In part, that’s because Japan’s economic growth has become slower and more erratic ever since its stock bubble imploded in 1989. Inflation has become worrisomely low, prompting a range of radical fiscal and monetary policies.
Some of Japan’s biggest slowdowns have started with tax hikes, so investors are now worried what will happen after a boost in the value-added tax (VAT) is implemented on October 1. Since it looks like Japan will weather the new tax hike well, it may be a good time to review the recent developments in the Japanese economy and explain why this tax hike doesn’t seem to be causing problems. Part I of this report will provide a primer on the current Japanese economy and financial markets. Next week, in Part II, we will focus on Japan’s geopolitical and domestic priorities, the reasons for the new VAT hike and ramifications for investors.
Asset Allocation Weekly (October 25, 2019)
by Asset Allocation Committee
For nearly two years, the energy sector has dramatically underperformed the overall equity market and oil prices.
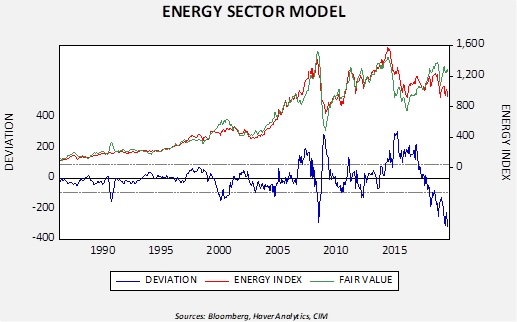
This chart shows our S&P energy sector model. We regress the overall S&P 500 and oil prices against the energy sector. For most of the index’s history, these two variables explained much of the behavior of the energy sector. The deviation line shows that this is the most significant underperformance of energy over the past thirty years. The current underperformance was preceded by strong outperformance in the two previous years.
So, why are we seeing this underperformance? It isn’t exactly clear. There are a number of candidates to explain the deviation. It may reflect a correction from the earlier outperformance that was likely based on euphoria surrounding fracking. There may be an element that, due to fears of climate change, hydrocarbons are falling into “pariah” status. If this is the case, there may be a long-term underweighting of energy stocks going forward. It may be that energy equity investors believe oil prices are too high and simply won’t “pay up” for equities to match current prices.
We are not sure which factor accounts for the underperformance but it does pose a problem for asset allocation. Energy is only 2.6% of the growth index for the S&P 500 but 6.4% of the value index. If an investor wanted to tilt his/her portfolio toward value due to concerns about a slowing economy but was worried that the underperformance of energy is a secular trend, the tilt to value might leave that investor with an excessive allocation to energy. Our Asset Allocation Committee recently faced this problem. To deal with this issue, we added a quality factor product to our Asset Allocation portfolios, which will still give us the defense posture without a large energy component. This is one way to address the higher proportion of energy in the value index and create a more defensive posture in asset allocation.
Business Cycle Report (October 24, 2019)
by Thomas Wash
The business cycle has a major impact on financial markets; recessions usually accompany bear markets in equities. We have created this report to keep our readers apprised of the potential for recession, which we plan to update on a monthly basis. Although it isn’t the final word on our views about recession, it is part of our process in signaling the potential for a downturn.
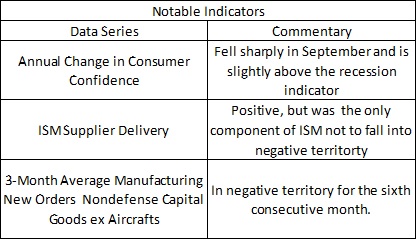
Data released for September suggests the economy is still firmly in expansion, but a slowdown in manufacturing and signals of financial weakness continue to be a drag on the index. Currently, our diffusion index shows that nine out of 11 indicators are in expansion territory, with several indicators approaching warning territory. The index remains unchanged from the prior month at +0.575.[1]
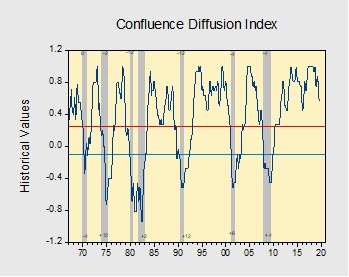
The chart above shows the Confluence Diffusion Index. It uses a three-month moving average of 11 leading indicators to track the state of the business cycle. The red line signals when the business cycle is headed toward a contraction, while the blue line signals when the business cycle is headed toward a recovery. On average, the diffusion index is currently providing about six months of lead time for a contraction and five months of lead time for a recovery. Continue reading for a more in-depth understanding of how the indicators are performing and refer to our Glossary of Charts at the back of this report for a description of each chart and what it measures.
[1] The diffusion index looks slightly different from last month due to adjustments we made to the formula and revisions in certain data sets.
Weekly Geopolitical Report – The End of the Carter Doctrine: Part II (October 21, 2019)
by Bill O’Grady
In Part I of this report, we identified the need to stabilize three areas of the world prone to war in order to maintain global peace. We focused on the Middle East and discussed the development of the Carter Doctrine, examining how the doctrine has been enforced since its inception. In this week’s report, we will discuss the reasons for the breakdown of the order prior to President Trump and follow this discussion with the impact of the current president. We will project the likely actions of the nations in the region and, as always, conclude with market ramifications.
The Breakdown of the Order
The key element of the Carter Doctrine was the explicit threat to use military force to prevent outside powers from gaining influence in the Middle East. The tacit element of it was that the U.S. would enforce stability in the region which included honoring existing borders regardless of the internal social problems that the colonial frontiers created. Since the turn of the century, U.S. actions have tended to undermine regional stability. It began as overreach, but it has evolved into neglect.