Looking forward to the coming years and decades, today’s long-term investors face a stark question: will they be investing in a China-dominated world molded by authoritarian leaders in Beijing? Or, will they be investing in a more familiar, Western-dominated environment reflecting the historic leadership of the U.S. and incorporating the values of freedom, private property, and justice, as handed down from British common law? Here at Confluence, we have long discussed the global public goods of security and a reserve currency that the U.S. has provided in its traditional role as global hegemon, and we’ve shown that U.S. citizens have become tired of providing those goods. We’ve argued that the most likely future is one in which the U.S. relinquishes its global dominance, producing an unstable and dangerous transition period from which some new hegemon—perhaps China—will eventually arise.
But the end of U.S. hegemony and its replacement by China are not yet set in stone. High-level “China hawks” in the Trump administration have launched an audacious effort to convince the American people and America’s foreign allies that they must push back against China and its effort to assume the throne of global leadership. At the dawn of the Cold War, the architects of U.S. “containment policy” faced a similar challenge as they built the case for thwarting Soviet expansionism. The question now is whether the new tough-on-China argument will resonate to the same extent.
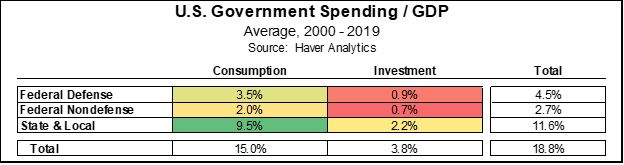
Investors often fall into the habit of sloppy thinking about government spending and its relation to the economy. For example, it’s easy to focus only on total government-sector expenditures. According to the White House Office for Management and Budget, total government outlays in the U.S. averaged 32.3% of nominal gross domestic product (GDP) over the two decades ended in 2019 (one of the lowest ratios among advanced countries). However, that figure overstates the government’s contribution to GDP because it includes a lot of “transfer payments,” i.e., funds that are simply redistributed from one set of economic actors to another. Social Security retirement checks, Medicare payments, and unemployment benefits are all examples of such transfers. Counting transfers as a component of GDP would result in double-counting because the funds would also be captured in the calculation when they are spent. Instead, economists strip out transfers from total government outlays and focus only on government consumption and investment expenditures. Over the last two decades, government consumption and investment averaged just 18.8% of GDP.
Government consumption expenditures (on items like wages, fuel, and office supplies) averaged about 15.0% of GDP over the last two decades. Government investment (spending on long-lasting goods like vehicles, buildings, and roads) was much less important for the economy, averaging 3.8% of GDP. The public sector data can also be broken down into the federal government’s share and the portion spent by state and local agencies. Over the last two decades, total federal consumption and investment (both defense and nondefense) averaged 7.2% of GDP, while state and local spending accounted for a full 11.6%. Showing all these subcomponents together, the heat table below makes clear that consumption spending by state and local agencies is by far the public sector’s most important contributor to national economic activity, at 9.5% of GDP.
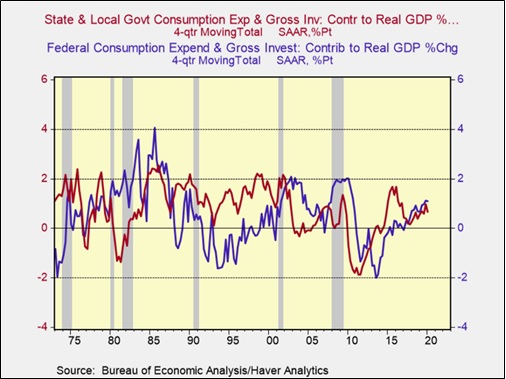
These figures help explain why a key risk for the economy going forward is whether state and local governments, facing a sharp decline in revenues because of the coronavirus crisis, will be forced to cut their spending so much that they offset the stimulatory effect of loose fiscal and monetary policy at the federal level. That’s exactly what happened after the Great Financial Crisis of 2008-2009. Corporate and personal income taxes, sales taxes, property taxes, and fees all plunged with the collapse in the housing market and the deep recession that followed, but the impact was especially severe on state and local governments since they are usually bound by law to balance their budgets. Their consumption and investment spending fell far more sharply than the federal government’s spending from 2008 to 2013. State and local spending declines in those years initially offset the federal government’s increased stimulus spending and later exacerbated the federal spending cuts associated with the “sequester” law. That can be seen most clearly in the chart below, which shows the contribution to GDP from each level of government and the particularly negative contribution from state and local spending in 2010 through 2012.
Going forward, we remain optimistic that the economy will eventually recover from the disruptions of the coronavirus pandemic. With the plethora of potential virus vaccines and treatments in development and the extraordinary amount of monetary and fiscal stimulus being provided, we think many sectors and businesses are likely to regain their footing and start growing again, which would be positive for corporate profits and stocks. However, as the administration and Congress continue to negotiate over the latest coronavirus relief bill, we see a significant risk. If insufficient aid is provided to state and local governments to make up for the pandemic’s hit to their revenues, spending in that big chunk of the economy could be cut enough to drag down overall economic activity and weigh on the equity market.
by Bill O’Grady, Thomas Wash, and Patrick Fearon-Hernandez, CFA | PDF
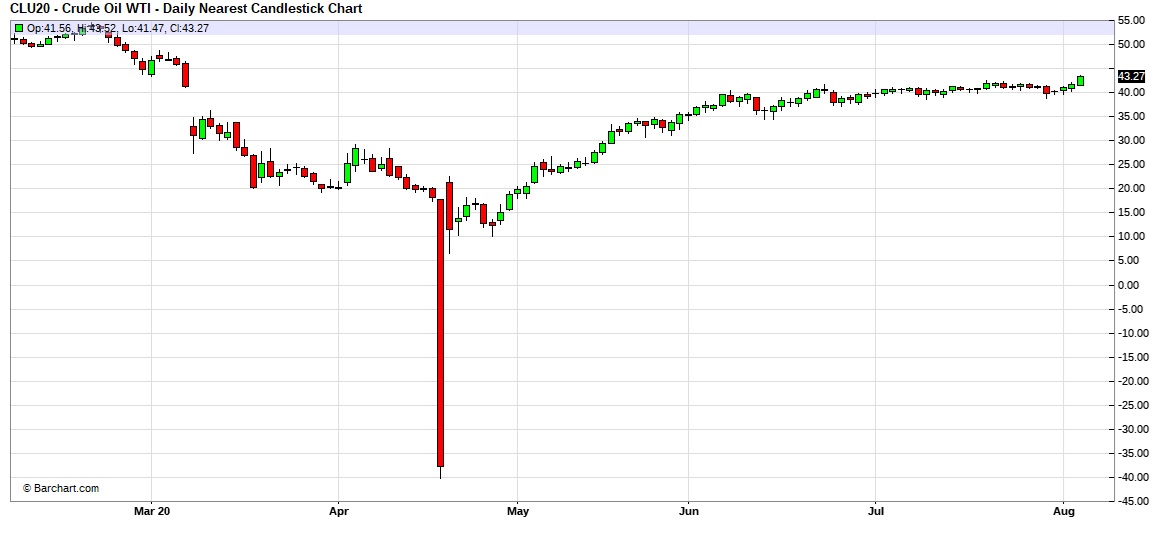
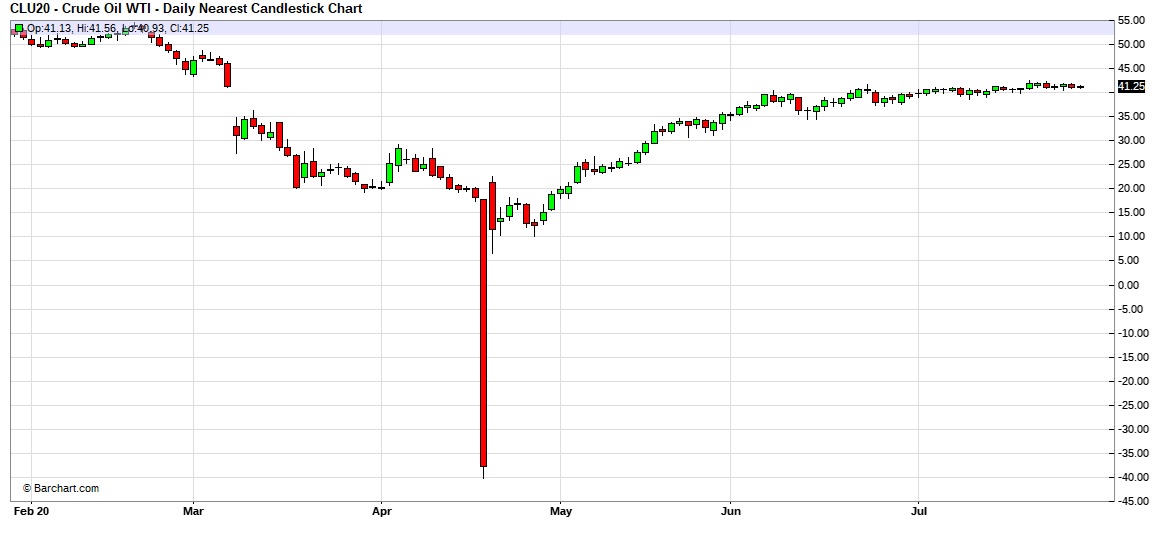
Here is an updated crude oil price chart. The oil market has stabilized at higher levels after April’s historic collapse.
(Source: Barchart.com)
Crude oil inventories fell more than anticipated, declining 7.4 mb compared to forecasts of a 3.5 mb decline. The SPR was unchanged this week.
In the details, U.S. crude oil production fell 0.1 mbpd to 11.0 mbpd. Exports fell 0.4 mbpd, while imports rose 0.9 mbpd. Refining activity rose 0.1%, close to expectations. The recovery of imports is consistent with the passing of recent tropical storm activity.
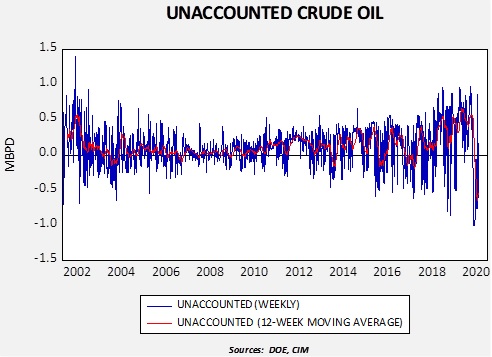
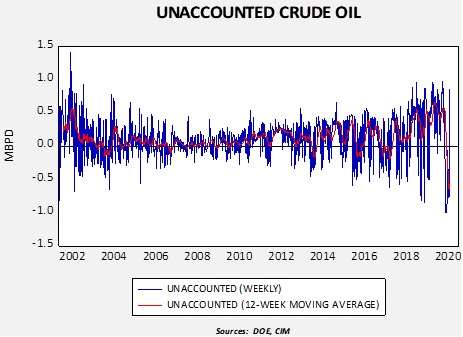
Unaccounted-for crude oil is a balancing item in the weekly energy balance sheet. To make the data balance, this line item is a plug figure, but that doesn’t mean it doesn’t matter. This week’s number is -609 kbpd. It is possible that production fell more than the DOE estimate.
(Sources: DOE, CIM)
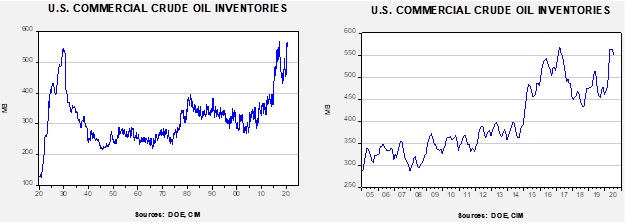
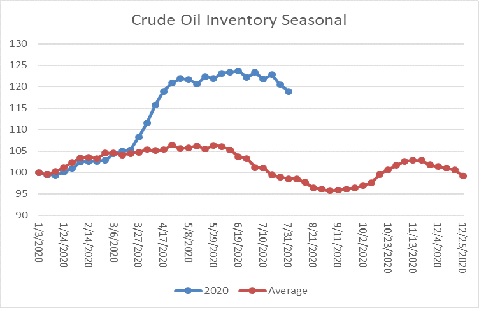
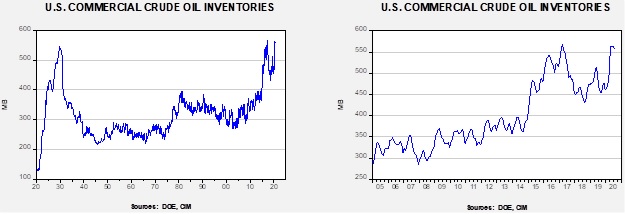
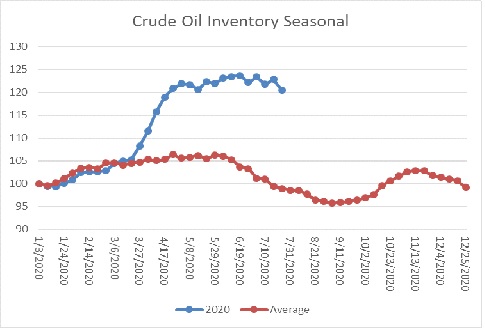
The above chart shows the annual seasonal pattern for crude oil inventories. This week’s data showed a decline in crude oil stockpiles. We are approaching the end of the seasonal withdrawal period. Although the declines of the last few weeks are supportive, stockpiles remain well above seasonal norms and remain a bearish factor.
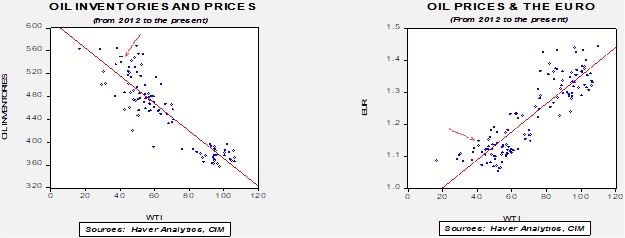
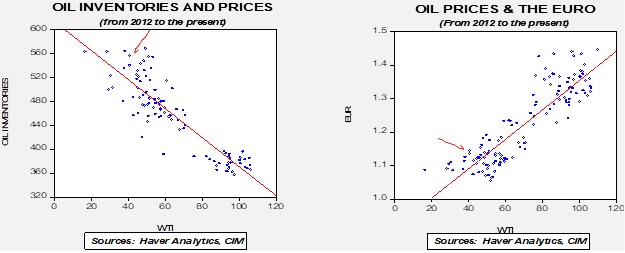
Based on our oil inventory/price model, fair value is $34.29; using the euro/price model, fair value is $57.11. The combined model, a broader analysis of the oil price, generates a fair value of $45.81. The wide divergence continues between the EUR and oil inventory models. As the trend in the dollar rolls over, it is bullish for crude oil. Any supportive news on reducing the inventory overhang could be very bullish for crude oil.
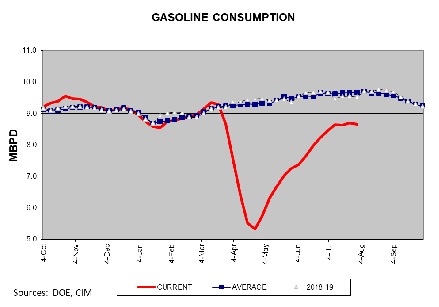
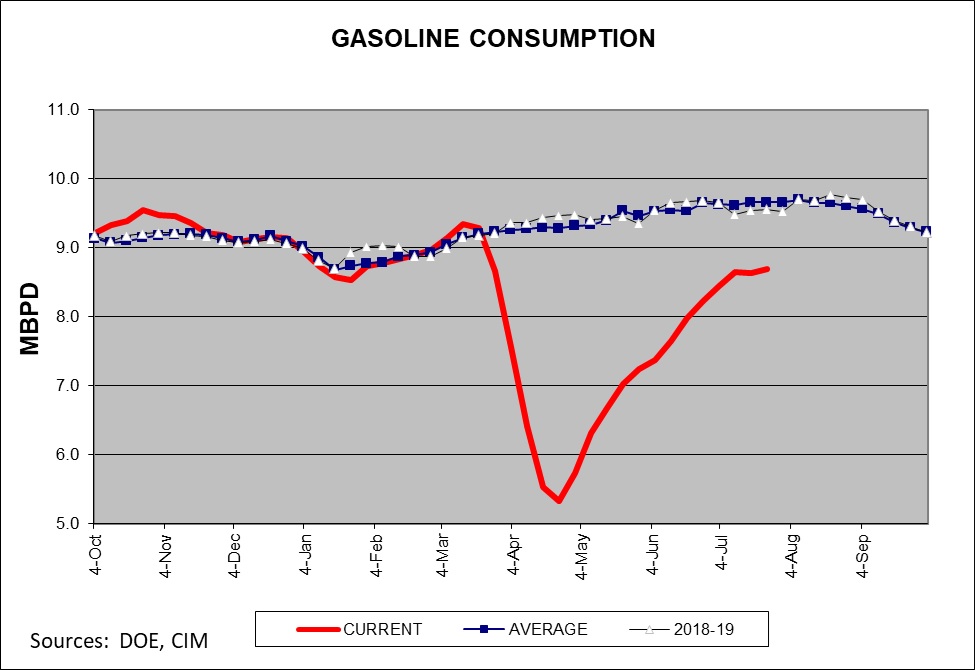
After a steady recovery since the trough in late April, gasoline consumption has stalled. We suspect this is related to the surge in COVID-19 infections; if it continues, it is a bearish factor for crude oil prices.
In energy news, the U.S. has expanded economic sanctions on Iran, specifying a series of industrial metals thought to contribute to Iran’s missile program. A total of 22 metals were listed; any nation trading these with Iran could be subject to sanction.
Saudi Arabia, with the help of the Chinese, constructed a facility to make “yellowcake” from uranium ore. This is an important step in the nuclear process and suggests the kingdom has decided to at least create the infrastructure for a nuclear program. This news follows on the heels of reports that the UAE opened a nuclear power plant. The U.S. has tried to prevent Middle East nations from going nuclear. It failed to stop Pakistan and it is thought that Israel has a nuclear weapon. But, Iran’s drive to be a nuclear threshold state and America’s steady withdrawal from hegemony appears to be leading Arab states to at least start the process for their own nuclear programs.
Turkey has been involved in Libya, supporting Islamist factions against secular forces operating in the eastern part of the country. The secular forces have been aided by Russia, the UAE, and Egypt. To reduce Turkey’s influence in Libya, Egypt has allegedly sent troops to Syria to bolster Assad’s military aligned against Ankara.
As the pandemic affects global trade flows, the Gulf States are increasingly concerned over food security. These nations are mostly desert and are thus dependent on imports for much of their food supply. They have been taking increasingly aggressive steps to manage this issue.
In Part I, we described China’s situation using Japan as a historical analog. This week, we will complete the analogy and examine in some detail the potential motivations of Chinese and U.S. policymakers. As always, we will conclude the discussion with potential market ramifications.
China’s Situation
Similar to Japan in the 1930s, China has become a large economy showing geopolitical power that is threatening the established order. Similar to Japan in the 1980s, it has an economy overly reliant on investment, trade and debt. And, like Japan, it is dependent on sea lanes it does not control. Finally, as was the case with Japan during both the 1930s and 1980s, China has reached a point where the U.S. is refusing to accommodate its rise. However, unlike Japan, China is not as dependent on the U.S. for its security (although it is quite vulnerable to a blockade).
It is arguable that Deng realized China would eventually reach this state and thus encouraged Chinese leaders to bide their time. Simply put, Deng wanted to extend China’s ability to stay “under the radar” for as long as possible before it would inevitably trigger a response from the U.S.
It is important to realize China is not acting in a vacuum. The U.S. has a clear role in how this situation evolves. The American response to China’s rise appeared to be guided by two principles. The first is that eventually China would accept U.S. hegemony and the trading system America had created after WWII. The second was that communism was fundamentally flawed and China would eventually develop into a capitalist democracy.
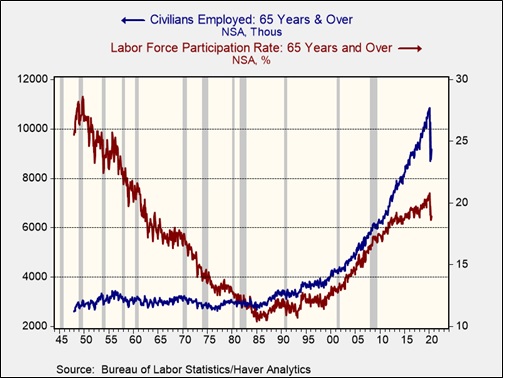
Americans working past 65 years old, at least as a percentage of the total labor force, was common after WWII. Social Security was still relatively new. But, from 1947 to 1985, the participation rate for Americans over the age of 65 fell from the 28.6% peak in October 1949 to a low of 10.4% in June 1984. The number of Americans in the labor force over the age of 65 peaked at 10.8 MM in February. It has fallen sharply since.
This chart shows both the actual number of civilians employed over the age of 65 and the percentage of these workers compared to the labor force of 65-year-olds and older. Participation has been rising since the early 1990s. Some of this rise is simply due to a rising population of Americans aged 65 years and older relative to the total population.
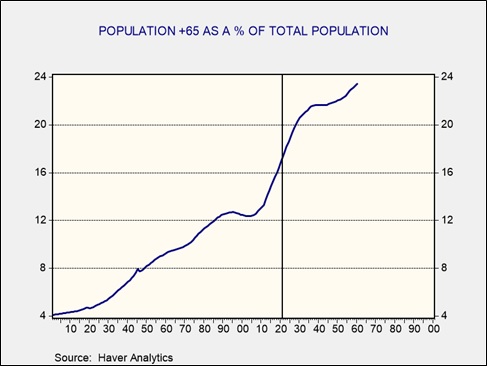
This chart shows the actual and projected level of 65-year-olds and older compared to the total population. The percentage has been rising since 2003 and is forecast to plateau in 2040. The entire baby boom generation will be 65 years or older by the end of the decade.
It is possible that the tendency for COVID-19 to be a greater risk to older workers may mean that the drop in employment for adults 65 and over will be lasting. These workers have the option of taking Social Security and don’t necessarily need to take the risk of returning to work. If they do leave the workforce for an extended period, perhaps 18 to 24 months for a widely available vaccine, employers may be less open to hiring this age of worker when a younger one can be found.
What impact would a decline in workers aged 65 and older have? Since older workers are often paid more due to their years of service, losing these workers will, at least initially, improve margins. It will almost certainly lead to some increased hiring of younger workers and may accelerate lowering the age of the workforce. It may also lead these older households to lower the risk in their portfolios by reducing equity positioning. Of course, given current paltry interest rates on low-risk fixed income, investors striving for yield will be forced to take on equity-like risk at times. It is still unclear whether the pandemic will lead to a permanent shift, but there is a good chance it will. Thus, we will continue to monitor this development.
by Bill O’Grady, Thomas Wash, and Patrick Fearon-Hernandez, CFA | PDF
Here is an updated crude oil price chart. The oil market has stabilized at higher levels after April’s historic collapse.
(Source: Barchart.com)
Crude oil inventories unexpectedly fell, declining 10.6 mb compared to forecasts of a 1.0 mb rise. The SPR was unchanged this week.
In the details, U.S. crude oil production was steady at 11.1 mbpd. Exports rose 0.2 mbpd, while imports fell 0.8 mbpd. Refining activity rose 1.6%, well above expectations. The drop in imports may have been affected by tropical storm activity; if so, we should see a rebound next week.
Unaccounted-for crude oil is a balancing item in the weekly energy balance sheet. To make the data balance, this line item is a plug figure, but that doesn’t mean it doesn’t matter. This week’s number is +43 kbpd. Although this is one week’s report, stabilization would suggest the DOE is getting a better handle on production and inventory.
(Sources: DOE, CIM)
The above chart shows the annual seasonal pattern for crude oil inventories. This week’s data showed a decline in crude oil stockpiles. We are well into the seasonal draw for crude oil. By this time of the summer, we have usually seen a 5% decline in commercial storage. The fact that inventories are mostly steady is a bearish factor.
Based on our oil inventory/price model, fair value is $31.95; using the euro/price model, fair value is $56.08. The combined model, a broader analysis of the oil price, generates a fair value of $44.17. The wide divergence continues between the EUR and oil inventory models. As the trend in the dollar rolls over, it is bullish for crude oil. Any supportive news on reducing the inventory overhang could be very bullish for crude oil.
After a steady recovery since the trough in late April, gasoline consumption has stalled. We suspect this is related to the surge in COVID-19 infections; if it continues, it is a bearish factor for crude oil prices.
In energy news, U.S. oil companies are reporting a return of production as shale output returns. Although it is unlikely that we will see a return to the peak levels of production for a while, the backlog of “drilled but uncompleted” wells offer ample opportunity for rising oil production.
The DOE has updated its data for April (the official data has a rather long lag), and as one would expect the decline in consumption of energy was historic, falling to three-decade lows. Petroleum consumption fell to its lowest level since 1983 and coal consumption declined to its lowest level since the DOE began collecting data.
Russia has been supporting Gen. Haftar in Libya. A “private” mercenary group, based in Russia, known as the Wagner Group, has captured Libya’s largest oil field and the Es Sider export facility. There are increasing concerns that Russia’s proxies are moving to take full control of Libya’s oil industry. Libya is becoming a new point of friction between the U.S. and Russia. The primary opposition to Russia’s aims in Libya is Turkey, which is supporting Islamist groups in the country.
VP Biden’s energy policy has led to concerns in the energy sector that he will support an aggressive “green” policy. However, in his plans for climate, we note a call for increased funding for carbon capture. A successful carbon capture regime would support both coal and natural gas. Although a Biden presidency would not be considered friendly for the energy sector, it is also possible that the outcome may not be as dire as some might suspect (and also disappointing for left-wing populists). We note that oil and gas groups have suggested there is “common ground” in the Biden energy plan.
Carbon credits, a European market that allows firms to trade carbon emissions, has become a significant bull market. The rising price of credits is putting pressure on European coal.
President and General Secretary Xi Jingping has changed the course of Chinese governance. Deng Xiaoping Peng created a collective leadership model to prevent the rise of another Mao. Leaders were carefully selected and surrounded by leading figures of the various factions of the Communist Party of China (CPC). Term limits were put in place to restrict a President/General Secretary to two five-year terms. Deng established a structure of government which was somewhat decentralized. Cults of personality were discouraged.
Xi Jinping has reversed these measures. He has ended the restrictions on term limits. The Standing Committee of the Politburo is mostly composed of allies. Instead of using the structure of government that diffused power, Xi has created a series of informal committees that actually execute policy; this gives him nearly complete control of the government. “Xi Jinping thought” is now discussed in party and academic circles; although no one has bound them into a little red book, it would not be a surprise if that were to occur.
Xi is also changing China’s foreign policy. Under Deng, foreign policy was all about “hide your ambitions and disguise your claws.” Under Xi, foreign policy has been more assertive. However, over the past 18 months, we have seen aggressive and, perhaps more importantly, widespread actions. China seems to be willing to create tensions across a broad spectrum, which does appear to be a new development.
There are two broad themes to this report. In Part I, we will frame China’s situation using Japan as an analog. In Part II, we will continue the analog, discuss recent Chinese aggression and offer a detailed analysis of the potential motivations of Chinese and U.S. policymakers. As always, we will conclude the discussion with potential market ramifications.
We use cookies to ensure that we give you the best experience on our website. If you continue to use this site we will assume that you are happy with it.