

Asset Allocation Weekly (August 7, 2020)
by Asset Allocation Committee | PDF
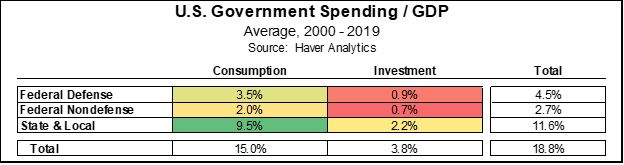
Investors often fall into the habit of sloppy thinking about government spending and its relation to the economy. For example, it’s easy to focus only on total government-sector expenditures. According to the White House Office for Management and Budget, total government outlays in the U.S. averaged 32.3% of nominal gross domestic product (GDP) over the two decades ended in 2019 (one of the lowest ratios among advanced countries). However, that figure overstates the government’s contribution to GDP because it includes a lot of “transfer payments,” i.e., funds that are simply redistributed from one set of economic actors to another. Social Security retirement checks, Medicare payments, and unemployment benefits are all examples of such transfers. Counting transfers as a component of GDP would result in double-counting because the funds would also be captured in the calculation when they are spent. Instead, economists strip out transfers from total government outlays and focus only on government consumption and investment expenditures. Over the last two decades, government consumption and investment averaged just 18.8% of GDP.
Government consumption expenditures (on items like wages, fuel, and office supplies) averaged about 15.0% of GDP over the last two decades. Government investment (spending on long-lasting goods like vehicles, buildings, and roads) was much less important for the economy, averaging 3.8% of GDP. The public sector data can also be broken down into the federal government’s share and the portion spent by state and local agencies. Over the last two decades, total federal consumption and investment (both defense and nondefense) averaged 7.2% of GDP, while state and local spending accounted for a full 11.6%. Showing all these subcomponents together, the heat table below makes clear that consumption spending by state and local agencies is by far the public sector’s most important contributor to national economic activity, at 9.5% of GDP.
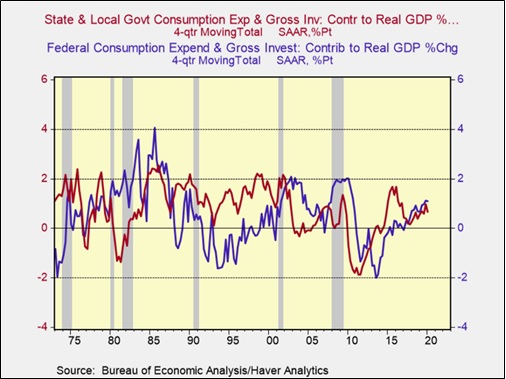
These figures help explain why a key risk for the economy going forward is whether state and local governments, facing a sharp decline in revenues because of the coronavirus crisis, will be forced to cut their spending so much that they offset the stimulatory effect of loose fiscal and monetary policy at the federal level. That’s exactly what happened after the Great Financial Crisis of 2008-2009. Corporate and personal income taxes, sales taxes, property taxes, and fees all plunged with the collapse in the housing market and the deep recession that followed, but the impact was especially severe on state and local governments since they are usually bound by law to balance their budgets. Their consumption and investment spending fell far more sharply than the federal government’s spending from 2008 to 2013. State and local spending declines in those years initially offset the federal government’s increased stimulus spending and later exacerbated the federal spending cuts associated with the “sequester” law. That can be seen most clearly in the chart below, which shows the contribution to GDP from each level of government and the particularly negative contribution from state and local spending in 2010 through 2012.
Going forward, we remain optimistic that the economy will eventually recover from the disruptions of the coronavirus pandemic. With the plethora of potential virus vaccines and treatments in development and the extraordinary amount of monetary and fiscal stimulus being provided, we think many sectors and businesses are likely to regain their footing and start growing again, which would be positive for corporate profits and stocks. However, as the administration and Congress continue to negotiate over the latest coronavirus relief bill, we see a significant risk. If insufficient aid is provided to state and local governments to make up for the pandemic’s hit to their revenues, spending in that big chunk of the economy could be cut enough to drag down overall economic activity and weigh on the equity market.