It’s now been more than a quarter century since the first nefarious behavior was observed on the internet. There have been countless news reports about computer hacks, stolen data, ransom scams, misinformation aimed at manipulating elections, and the like. Many of us have had to change our passwords and sign up for free credit monitoring after a service provider suffered a digital breach. We’ve probably all seen how businesses have been forced to up their game and adopt stronger computer security, just like they lock their doors against common burglars.
But what if common burglars aren’t necessarily the best model for thinking about hackers? Some of the hackers who threaten our personal data or the sensitive systems of our companies and public institutions certainly are “lone wolves,” but in this report, we’ll show that another model for understanding today’s hackers can be found in the pirates who prowled the Spanish Main from the 1500s to the 1700s. We’ll look at what some hackers have in common with those pirates and what it means for digital security. As always, we’ll wrap up with a discussion of potential investment ramifications.
Many investment managers think of “foreign equities” as one big, monolithic asset class and leave it at that. When setting a portfolio’s asset allocation strategy, many simply assign a certain percentage to the asset class and implement it by investing in a broad international index fund. Here at Confluence, we go a step further by identifying individual countries that may be attractive based on our analysis of their geopolitical power, economic performance, social developments, and financial dynamics. We think the current negotiations for a post-Brexit trade deal between the European Union and the United Kingdom offer especially rich insights into the relative power and prospects of the various EU member states and the U.K. Our analysis suggests the EU’s Central European members and the U.K. may be especially well placed to outperform economically in the coming years.
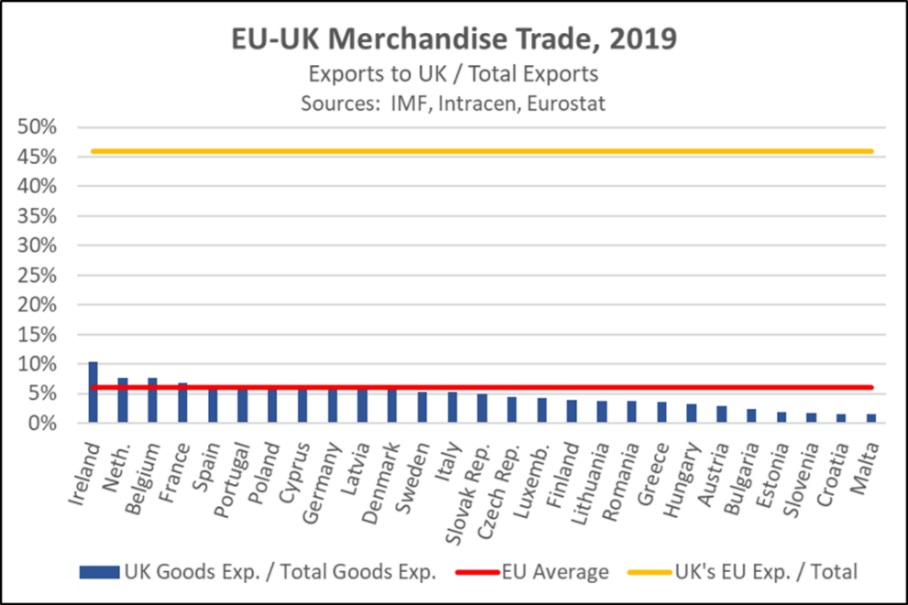
At first glance, the EU would seem to have immense leverage in the post-Brexit trade talks because its exports to the U.K. make up only a small part of its total trade and economic activity. In theory, the EU could easily walk away from the negotiations and accept any trade barriers that would snap into place under a “hard Brexit.” In contrast, the U.K. would stand to lose a huge chunk of its exports and economic activity, which would supposedly force it to make significant concessions. To illustrate, the chart below shows that only about 6.0% of the EU’s merchandise exports went to the U.K. in 2019 (the red line in the chart). For Ireland and a few other big EU members, the U.K. represented as much as 10.3% of exports (the blue columns), but no EU member came close to the U.K.’s dependence on cross-Channel trade. Fully 46.0% of the U.K.’s foreign merchandise sales went to the EU (the gold line).
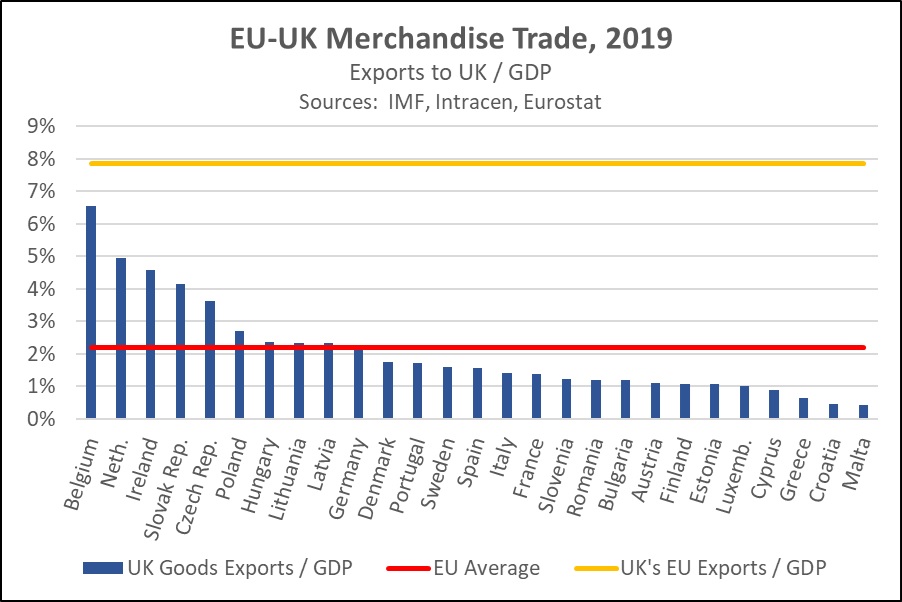
Despite the EU’s apparent negotiating advantage, however, all indications are that the U.K. is holding its own in the talks. Last week, for example, a British threat to walk away from the negotiations brought the EU back to the table with promises that it would be willing to compromise on the remaining issues of fisheries and corporate subsidies. A close look at the following graph suggests why the EU may have less leverage than expected. The red line in this graph shows that, on average, EU members’ exports to the U.K. represent only 2.2% of their gross domestic product (GDP). The gold line shows that the U.K.’s exports to the EU represent fully 7.6% of its GDP. But the key story is revealed by the blue columns, which show each individual EU member’s merchandise exports to the U.K. as a share of its GDP. Besides the obvious dependency of close neighbors like Ireland, Belgium, and the Netherlands, what’s notable is that the Central European states like Slovakia, the Czech Republic, Poland, and Hungary are also unusually dependent on shipments to the U.K.
The Central Europeans clearly have a strong interest in maintaining close EU trade ties with the U.K. The Poles and Hungarians have also recently been at odds with the EU leadership over what some see as their authoritarian political and judicial policies. In other words, even if the EU leadership in Brussels would prefer to play tough with the U.K. and risk a hard Brexit, the Central Europeans would probably oppose the move. But do the Central Europeans really have the power to thwart Brussels? The answer is “yes.” The reason is that most major EU decisions ultimately need to be approved by all member states. The Central Europeans have leverage over Brussels because they can threaten to withhold their approval for major legislation, budgets, trade deals, and the like, whether they’re related to the issue at hand or not. The EU negotiators therefore have to be cognizant of the Central Europeans’ interests and likely can’t risk being so tough on the U.K. that a trade deal falls apart.
More broadly, the need for unanimous decisions means the EU as a bloc will continue to be hamstrung politically. Indeed, former European Commissioner Romano Prodi recently said in an interview that, “Europe’s enemy is unanimity. . . In this moment I’m pessimistic about [change.] Unanimity will go on in the major issues, at least in the foreseeable period of time, unless there will be a quick realization that this will kill Europe.” On a more positive note, however, these dynamics suggest the Central Europeans will continue to use their leverage to win economic and political concessions from Brussels. Meanwhile, the U.K. and other countries negotiating with the EU on various issues will probably learn that they can exact concessions by “playing the Central European card.” In sum, these political dynamics suggest the U.K. could well end up with a favorable post-Brexit trade deal and the Central Europeans will likely be able to protect their economic interests fairly well in the coming years, making both more attractive investment destinations than would otherwise be the case.
The business cycle has a major impact on financial markets; recessions usually accompany bear markets in equities. The intention of this report is to keep our readers apprised of the potential for recession, updated on a monthly basis. Although it isn’t the final word on our views about recession, it is part of our process in signaling the potential for a downturn.
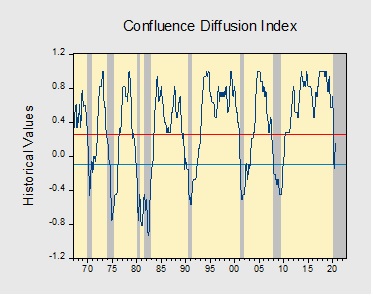
In September, the diffusion index rose further above contraction territory, signaling that the economy remains on track to expand in Q3. Financial markets were weaker as equities dipped and the yield spreads were roughly unchanged. Meanwhile, the labor market continues to show signs of improvement as firm hires remain strong. However, the lack of progress on additional fiscal stimulus continues to weigh on growth expectations as concerns over slowing consumer spending continue to mount. As a result, four out of the 11 indicators are in contraction territory. The reading for September rose from +0.0909 to +0.1515, above the recovery signal of -0.100.
The chart above shows the Confluence Diffusion Index. It uses a three-month moving average of 11 leading indicators to track the state of the business cycle. The red line signals when the business cycle is headed toward a contraction, while the blue line signals when the business cycle is headed toward a recovery. On average, the diffusion index is currently providing about six months of lead time for a contraction and five months of lead time for a recovery. Continue reading for a more in-depth understanding of how the indicators are performing and refer to our Glossary of Charts at the back of this report for a description of each chart and what it measures. A chart title listed in red indicates that indicator is signaling recession.
by Bill O’Grady, Thomas Wash, and Patrick Fearon-Hernandez, CFA | PDF
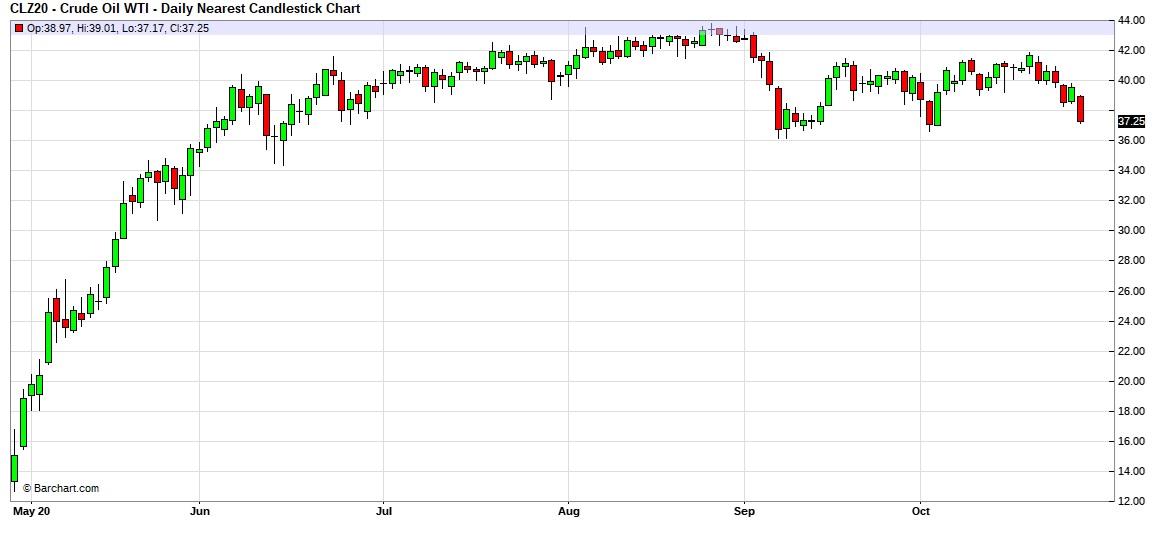
Here is an updated crude oil price chart. Prices remain rangebound but are testing the lower boundary of the range.
(Source: Barchart.com)
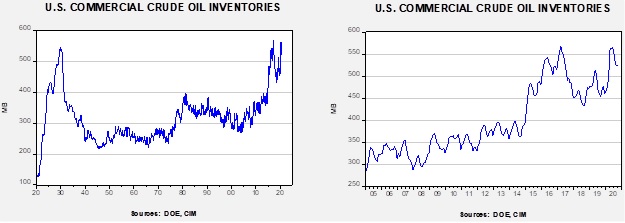
Commercial crude oil inventories rose 4.3 mb when a 1.5 mb build was expected. The SPR declined 0.7 mb; since peaking at 656.1 mb in July, the SPR has drawn 17.2 mb. Given levels in April, we expect that another 4.4 mb will be withdrawn as this oil was placed in the SPR for temporary storage. Taking the SPR into account, storage rose 3.7 mb.
In the details, U.S. crude oil production rose 1.2 mbpd to 11.0 mbpd. Exports rose 0.4 mbpd, while imports also increased 0.5 mbpd. Refining activity rose 1.7%. The data suggest a return to normal after a few weeks of hurricane disruptions, although we are dealing with another this week, Hurricane Zeta. The hurricane season traditionally ends on Halloween and Zeta doesn’t appear to be strong enough to cause a significant decline in production. Thus, we should be close to finished with the effects of tropical activity.
(Source: Barchart.com)
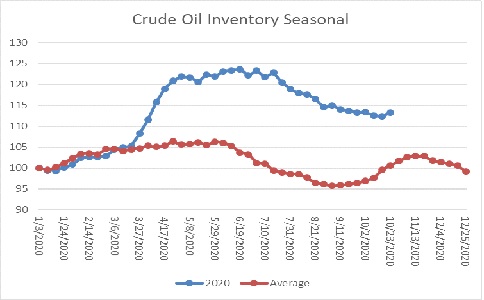
The above chart shows the annual seasonal pattern for crude oil inventories. This week’s data showed a build in crude oil stockpiles, which is the normal seasonal pattern. Inventories tend to make their second seasonal peak about mid-November. We are approaching the period where inventories tend to decline into year’s end.
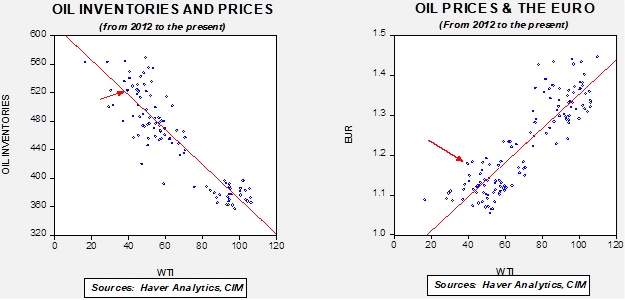
Based on our oil inventory/price model, fair value is $42.84; using the euro/price model, fair value is $62.70. The combined model, a broader analysis of the oil price, generates a fair value of $51.92. The wide divergence continues between the EUR and oil inventory models. However, current oil prices are below all three measures of fair value, suggesting that oil prices are likely undervalued.
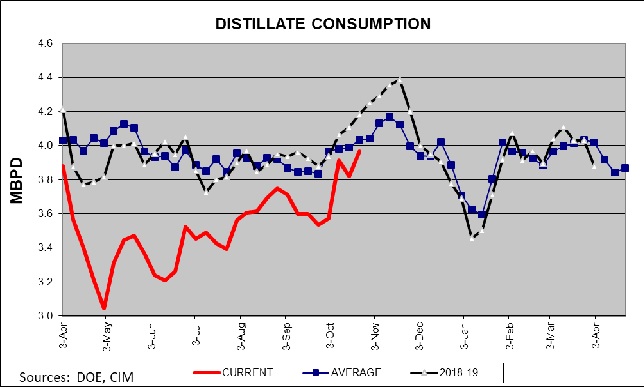
Last week, we noted that distillate inventories had declined. They did so again this week. But what caught our attention this week has been the recovery in distillate demand. This rise may be more due to home heating inventory building, but it may also be a “ground level” indication that the economy is improving. Consumption is near the five-year average.
With U.S. elections next week, political tensions are elevated. At the last debate, VP Biden suggested he supported moving away from oil production. This is part of the party’s platform, but it was surprising he would say it in a debate. In the short run, the comment won’t help in Texas or, more critically, Pennsylvania.
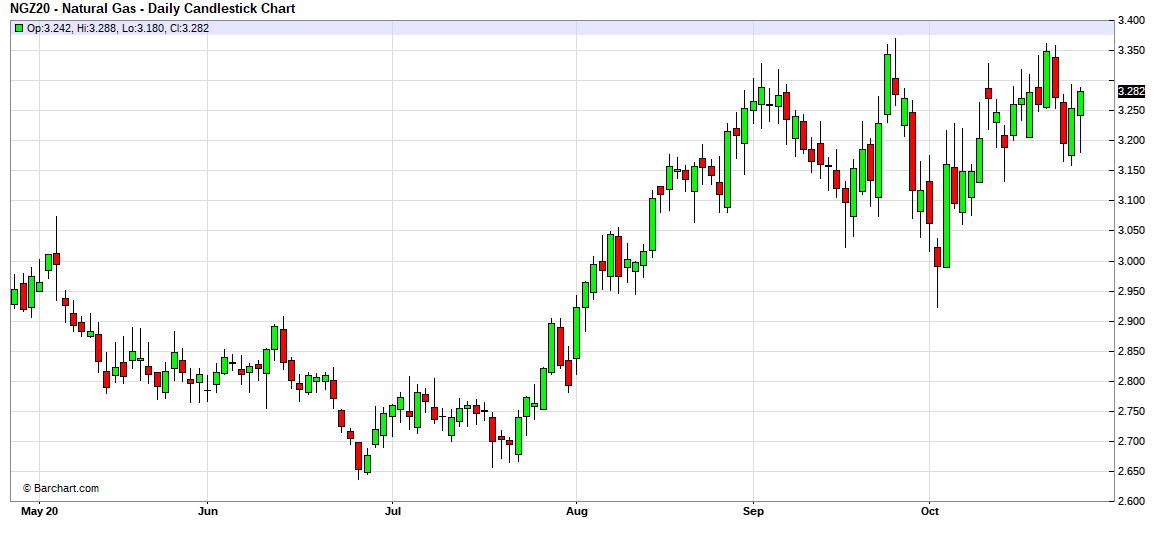
Natural gas prices have been rising since late July and have been holding steadily above $3.000 per MMBTU.
(Source: Barchart.com)
The bullish fundamental factor that is lifting prices is a decline in production.
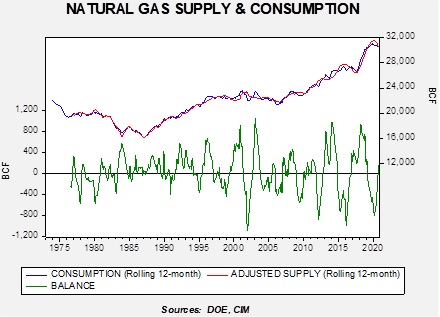
This chart shows the rolling 12-month level of supply (production + net imports) compared to the same measure for domestic consumption. Supply has been declining for two reasons; first, the sharp decline in oil prices has led to a drop in oil production that has reduced associated natural gas production that is part of the drilling process. Second, net imports are negative.
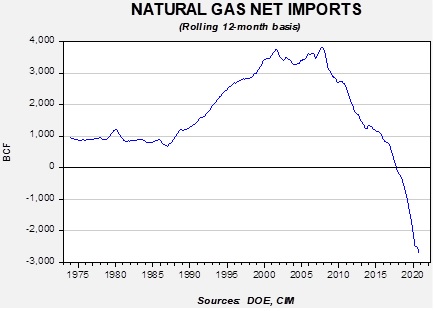
The expansion of LNG and pipeline sales to Mexico, along with a drop in gross imports, has led to the positive trade balance (negative net imports mean positive exports).
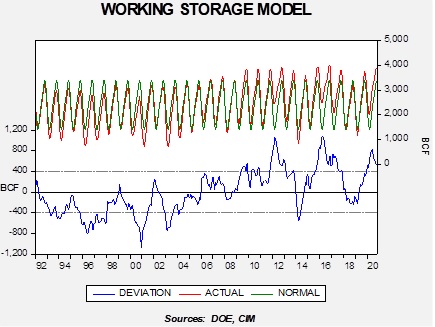
Unfortunately, inventory levels are elevated as we move into winter.
This model seasonally adjusts the level of inventories; when the lower line is above zero, storage levels are higher than normal.
If we combine the level of output, the balance between supply and consumption, and the level of inventories, fair value for natural gas is $2.14 per MMBTU. To justify current prices, inventory levels would need to decline by nearly 450 bcf on a seasonally adjusted basis. Since inventories are poised to decline on a seasonal basis starting in November, stockpiles must fall much faster than normal for prices to be maintained, implying winter demand will need to be robust. Given the winter forecast, that isn’t likely, so prices are vulnerable to a pullback into 2021.
Last week, we outlined the history of the presidential election of 1876. This election was disputed and required a special commission to resolve. This week, we will begin with a discussion of our current procedure for electing presidents and the impact of partisanship on the existing environment. We will use last week’s historical foundation to compare and contrast the 1876 election to the current turmoil and offer insights on how the 2020 election might unfold. We will also examine the international implications of an uncertain election; in other words, what could happen if the world’s hegemon doesn’t have a clear commander in chief? As always, we will conclude with market ramifications.
The Current Procedure
One of the strengths of democracies is their ability to adapt. Authoritarian regimes tend to ossify over time, which often undermines them and eventually leads to their downfall. At the same time, while democracies do show they can change, it doesn’t mean it’s pleasant to watch.
The measures adopted to combat the spread of COVID-19 caused one of the most unusual recessions in American economic history. Although all recessions have their own unique characteristics, the recession that began in February was historically deep; it is likely already over too, making it one of the shortest on record. To a great extent, this is because this recession was caused by the disruptions due to the pandemic, not by the more usual factors, such as geopolitical events or monetary policy error. Business cycles are broken into three phases: recession, recovery, and expansion. The onset of recession is defined as the peak of the economy. The recession occurs during the decline in business activity and ends when the cycle troughs. The recovery begins at this point and lasts until the previous peak in business activity is exceeded, starting the next expansion. Given the deep initial decline in business activity, the recovery is now underway. Accordingly, economic analysis is now focused on the path of recovery. In this report, we are going to focus on how the pandemic has caused a services recession which will complicate the recovery.
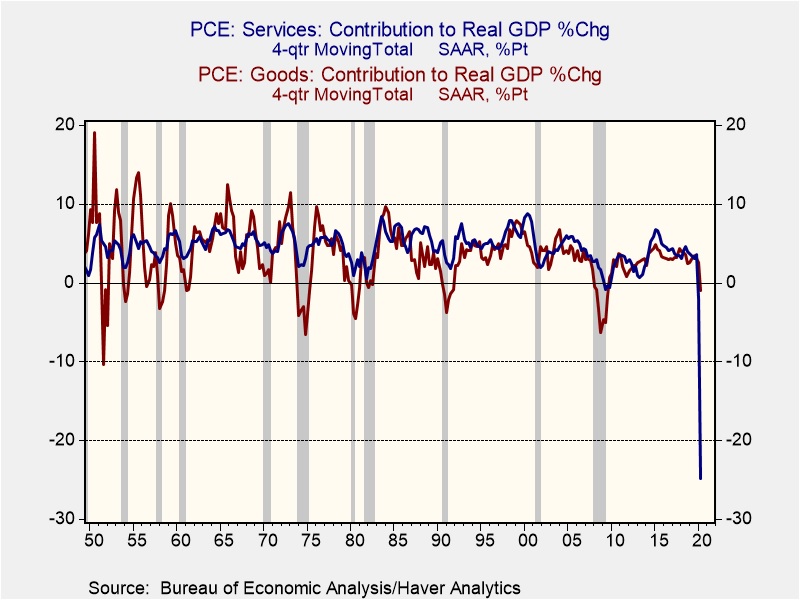
This chart shows the four-quarter sum of the contribution to GDP from services and goods consumption. In the 11 recessions that have occurred since 1950, a negative contribution from goods consumption has occurred in all but two (1970, 2001). A negative reading from services has only occurred twice, in the last two recessions. But, clearly this recession is unlike any in the postwar experience. Goods consumption has turned negative, but barely so; the decline in services, on the other hand, is unprecedented.
Because goods can be held in inventory, any lost sales in the near term can be facilitated in the future by providing the goods out of stockpiles. Eventually, inventory is exhausted and will need to be rebuilt. Last week’s AAW addressed this issue directly. One consistent factor we see in recoveries is that contribution from inventory, but services really can’t be inventoried. A forgone haircut or an evening at a restaurant won’t be recouped in the future. If one takes two cruises a year, it isn’t likely that one will take four in the first year of the vaccine; the two not taken will likely be lost consumption. Another way to consider this issue is that inventory in services is labor. Within the constraints of a restaurant, for example, the way one increases capacity is by hiring wait staff and cooks. To adjust to less traffic, the way a firm would reduce inventory is through layoffs.
At the same time, households are not just holding their savings; there has been a definite shift in spending—away from services and toward goods.
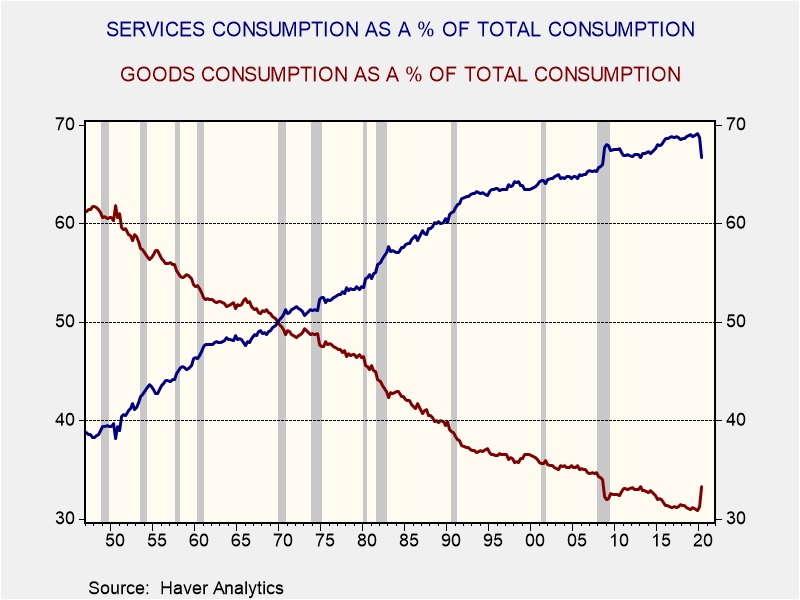
After WWII, goods consumption was just over 60% of all consumption, while services was just under 40%. By 1970, the two had equalized and, in Q4 2019, the divergence had made a new record—69.1% of consumption had gone to services and 30.9% to goods. Since then, goods have risen to 33.3% and services has declined to 66.7%. Although we would expect the secular trend to resume at some point, until a vaccine emerges and/or a reliable antiviral therapy is developed, the bias toward goods consumption will likely remain in place.
Given the likely overcapacity in services (as seen in the job losses in services industries), we would expect that the lack of demand will tend to act as an overhang on the economy and lead to a slow recovery. If we are correct in this assessment, it should keep monetary policy accommodative and inflation under control. As we will also show in this report’s accompanying chartbook, restaurants, gasoline, and recreation have suffered tremendous losses that will be difficult to recover from, while housing is getting a significant boost due to changes in office attendance.
We use cookies to ensure that we give you the best experience on our website. If you continue to use this site we will assume that you are happy with it.