Weekly Geopolitical Report – Data and Geopolitics: Part II (August 23, 2021)

by Patrick Fearon-Hernandez, CFA | PDF

In Part I of this report, we discussed why today’s political leaders and governments are now paying such close attention to the control of data and information, and what that means for geopolitics.  In Part II, we will show how China is perhaps the best example of modern state control over data and information.  Indeed, China’s current “industrial policy” is essentially a form of “information policy.”  A central strategy for China’s current leadership is to generate, utilize, control, and protect information as a way of building up its geopolitical and economic power.  To wrap up the discussion, we will discuss the ramifications of this trend for investors.

Read the full report

Asset Allocation Weekly – The Impact of Older Americans on the Labor Market (August 20, 2021)

by the Asset Allocation Committee | PDF

In analyzing the path for the economy, an important factor is separating the temporary effects of the pandemic from those that are longer lasting.  The debate over whether inflation will be transitory is tied to this determination.  The impact on the labor markets is another element.  One change that appears to be permanent is that the pandemic accelerated retirement among baby boomers.

Currently, Americans born in 1959 or earlier are eligible for Social Security, but 65 years old remains the traditional retirement age.  Americans working past 65 years old, at least as a percentage of the total labor force, was common after WWII.  Social Security was still relatively new.  However, from 1947 to 1985, the participation rate for Americans over the age of 65 fell from the 28.6% peak in October 1949 to a low of 10.4% in June 1984.  The number of Americans in the labor force over the age of 65 peaked at 11.2 million in February 2020.  It has fallen since the onset of the pandemic.  The participation rate, the percentage of workers relative to the labor force, has declined since the onset of the pandemic and is continuing to decline.

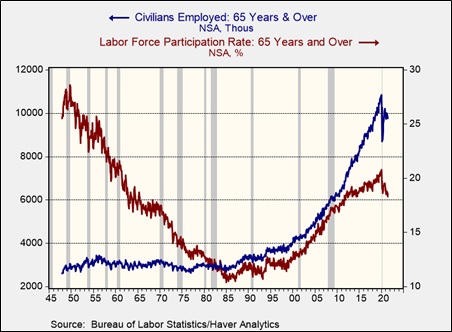
The chart above shows both the actual number of civilians employed over the age of 65 and the percentage of these workers compared to the labor force of 65-year-olds and older.  Participation has been rising since the early 1990s.  Some of this rise is simply due to a rising population of Americans aged 65 years and older relative to the total population.

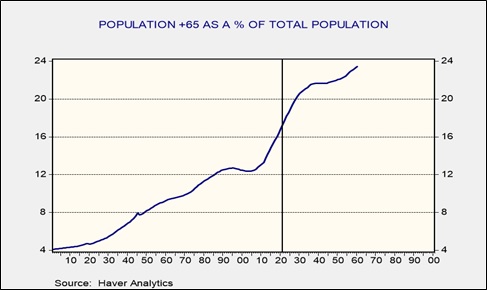
This chart shows the actual and projected level of 65-year-olds and older compared to the total population.  The percentage has been rising since 2003 and is forecast to plateau in 2040.  The entire baby boom generation will be 65 years or older by the end of the decade.

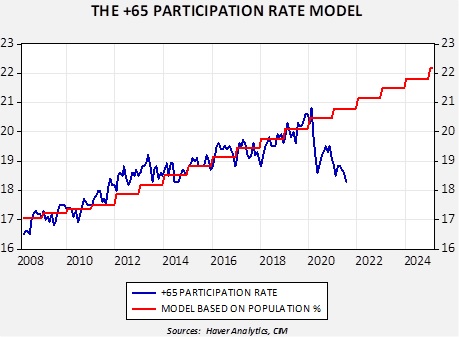
We developed a simple model to measure labor participation of those 65 years and older compared to the population of that age cohort.  Starting in 2008, the model generally predicted the path of participation in this age bracket.  However, since the pandemic, participation has plunged, and the pattern suggests that it’s likely permanent.  Using a similar calculation using the employment/population ratio for this age cohort, the decline in older worker employment represents around 833,000 jobs.  Assuming a stable labor force, that would have reduced the overall unemployment rate to 4.9%.

What impact would a decline in workers aged 65 and older have?  Since older workers are often paid more due to their years of service, losing these workers will, at least initially, improve margins.  It will almost certainly lead to some increased hiring of younger workers and may accelerate lowering the age of the workforce.  Industries will not be equally affected; some are at high risk.  For example, in 2020, 32.9% of farmers and 25.0% of aircraft assemblers are in this age bracket.

For markets, older Americans who leave the workforce may be inclined to reduce their equity positions.  However, returns in fixed income are paltry, so the potential negative impact might be less than one would expect.  Dividend-paying equities could be particularly attractive.  But overall, the impact on financial markets will likely be centered on the wage effects.

View PDF

Weekly Geopolitical Report – Data and Geopolitics: Part I (August 16, 2021)

by Patrick Fearon-Hernandez, CFA | PDF

For decades now, the post-industrial “information age” has been a key topic of interest for economists, business leaders, financial managers, and investors.  All have come to appreciate the implications of silicon-based semiconductors and the opportunities they create for mass data management, storage, communications, and analytics.  In recent years, data has also become a major concern for governments.  In Part I of this report, we discuss why political leaders are now paying closer attention to the control of data and information, and what that means for geopolitics.  In Part II next week, we will show how governmental control over data and information is playing out in China, in particular, and conclude with the ramifications for investors going forward.

Read the full report

Asset Allocation Weekly – Intellectual Property Takes Over Fixed Investment (August 13, 2021)

by the Asset Allocation Committee | PDF

It’s probably no surprise to anyone that information processing has become a bigger and bigger part of the economy over the last several decades.  By now, we’ve all gotten used to seeing new kinds of computers and telephones every year, and we’ve struggled with learning new software programs at home or at work.  Whether you call it the “digital economy” or the “knowledge economy,” what few people realize is that it’s about to reach an important milestone in the data on U.S. gross domestic product (GDP).  Therefore, this may be a good time to explore some of the investment ramifications of the trend.

In the U.S., private investment spending currently accounts for about 17.5% of total GDP, but the category naturally includes a lot of subcomponents.  Housing and corporate inventory investment are only a small part of the total.  The biggest component of the category is “nonresidential fixed investment,” which is often referred to as “corporate” fixed investment and makes up roughly 13.5% of GDP.  As late as the 1990s, corporate fixed investment was dominated by spending on machinery, equipment, and structures.  Investment in intellectual property—mostly spending on research and development—was a much smaller part of the category.  The difference now is that spending on intellectual property has exploded, mostly because of a surge in software investment.  Overall, corporate fixed investment has grown at an average annual rate of 7.6% over the last four decades (including price changes), with software investment rising at a rate of 10.9% and R&D investment rising at a rate of 7.1%.  As a result, intellectual property is on the verge of becoming the biggest component of corporate fixed investment.

The implications of this evolution are enormous.  In economic terms, the marginal cost of selling an additional software package or leveraging the R&D behind it can be minimal.  In addition, digital products and software can have big spillover effects, in the sense that they can give value to customers beyond the core service the software is designed for.  A good example of this is the “network effect” when the customer gets greater value from joining a social media network when the network has more people.  The low cost of selling additional units and the incentive to capture spillover value means that digital businesses have a huge incentive to grow their network and become as big as possible.  The growing dominance of intellectual property in the economy is probably one reason why corporate profits as a share of GDP have risen starkly over the last several decades (see chart below).  Note, however, that those businesses’ enormous size is now generating concerns that they are stifling competition, which could lead to tougher antitrust regulation around the world.

Naturally, investors are attracted to the increasing size and profitability of firms that produce software or can efficiently leverage their digital R&D.  In addition, as other businesses continue learning how to boost their productivity using big data, data management, data analysis, and artificial intelligence, they are probably less likely to cut their intellectual property investment in times of recession.  Indeed, intellectual property investment continued to rise throughout the Great Financial Crisis of 2008-2009 and the recession in 2020 due to the coronavirus, as shown in the first chart above.  From another perspective, the growth rate of inflation-adjusted intellectual property investment has had a standard deviation of just 5.2% since 2000, which is modestly lower than the standard deviation of 5.8% for overall GDP and dramatically lower than the average deviation of 13.9% for equipment and 14.4% for structures.  In sum, intellectual property investment is much more stable than investors realize, so there is a good economic reason why digital technology and software firms are increasingly being seen as “defensive.”  In many environments, we favor this sector for offering an attractive combination of good prospects with relatively less sales volatility than investors perceive.

View PDF

Weekly Energy Update (August 12, 2021)

by Bill O’Grady, Thomas Wash, and Patrick Fearon-Hernandez, CFA | PDF

Oil prices remain depressed, with $67 acting as support.

(Source: Barchart.com)

Crude oil inventories unexpectedly fell 0.4 mb compared to the 2.0 mb draw forecast.  The SPR was unchanged this week.

In the details, U.S. crude oil production rose 0.1 mbpd to 11.3 mbpd.  Exports rose 0.8 mbpd, while imports were unchanged.  Refining activity rose 0.5%.

(Sources: DOE, CIM)

This chart shows the seasonal pattern for crude oil inventories.  We are well into the summer withdrawal season.  Note that stocks are well below the usual seasonal trough seen in early September.  A normal seasonal decline would result in inventories around 550 mb.  Our seasonal deficit is 69.2 mb.  Since early July, inventory levels have stabilized; as the chart indicates, seasonal inventory stabilization usually occurs in September, so if this pattern continues, the seasonal deficit should narrow.

Based on our oil inventory/price model, fair value is $61.67; using the euro/price model, fair value is $62.50.  The combined model, a broader analysis of the oil price, generates a fair value of $61.76.  The weaker EUR has started to affect the model forecast, putting all the models’ fair value calculations well below the current price.

Market news:

  • Headlining this week’s market news is the IPCC report that suggests global temperatures are rising rapidly and the odds of climate destabilization are rising. One element of this destabilization is wildfires, which are punishing Europe and the Western U.S.  Although devising new ways to limit methane and CO2 emissions will help limit the damage, in reality, much of the damage is already in place and even moving to zero emissions today will not likely prevent continued warming.  So, policymakers have to not only move on alternative energy but also climate mitigation.
  • The Senate passed a $1.2 trillion infrastructure package, which has some measures to address both mitigation and emissions control. The bill includes:
    • $73 billion for grid upgrades and increased powers to FERC for power lines. One of the problems facing the country is that alternative energy production usually exists in low population areas and long power lines are required to move the “juice” to where it is needed, which are urban areas.  However, building these lines is difficult because of local opposition, which is sometimes funded by urban utilities that don’t want the wind or solar competition.
    • $6 billion for nuclear energy which is designed to extend the life of existing facilities. Although nuclear power is controversial, it is clearly emission-free power.
    • $7.9 billion for funding clean energy initiatives, with an emphasis on battery manufacturing and recycling.
    • $15 billion for electrification, with half going to funding EV charging stations.
    • $8.5 billion for carbon capture and sequestration.
    • $1.0 billion for clean hydrogen.
    • An initiative but no funding for orphaned oil and gas wells.
    • Executive order for 50% zero emissions vehicles by 2030.

Overall, the bill mostly supports big electricity.  Distributed power didn’t get much support.  In addition, there was a clear focus on building the infrastructure for auto electrification.

  • Politics by its very nature leads to disingenuous behavior.  One of the primary functions of the political process is to determine who bears the cost of adjustment with any policy action.  Politicians always attempt to hide the costs from those who will bear them, or somehow argue that those stuck with the “bill” deserve the pain.  Acknowledging the fact that allocation costs and benefits are simply part of the political process isn’t enough; political operators also have to justify their actions.  After all, elections are popularity contests and being difficult makes one unpopular.  With that being said, we watched the recent actions by the administration with some degree of astonishment.  From the outset, as we have discussed in earlier reports, the administration has taken the path of acting on climate change.  The administration has enforced several actions, including restricting drilling on federal lands, discouraging the finance industry from supporting the fossil fuel industry, and threatening legal action against polluters, which are mostly oil and gas companies.  If the goal is to reduce CO2 emissions, rising energy prices are an unavoidable consequence.  However, this action conflicts with the popularity contest nature of elections.  And so, yesterday, National Security Director Sullivan criticized OPEC+ for not increasing oil production enough to lower oil and gas prices.
    • This criticism is epic in its disingenuousness.  Oil prices are up, in part, because the administration is reducing land available for oil and gas production and is starving the industry for investment funding.  These actions were taken due to climate concerns.  Pushing OPEC+ to boost output conflicts with the goal of addressing climate change.
    • The U.S. is rapidly abandoning involvement in the Middle East.  The U.S. troop withdrawal is leading to the Taliban retaking control in Afghanistan, which could destabilize parts of the region.  We are also reducing our involvement in Iraq to mere training of security forces.  Again, there are clearly justifiable reasons for reducing involvement in the region.  We can see peak oil demand on the horizon, and we should be focusing on great power competition with China.  Freeing up resources for this outcome makes sense.  But you can’t expect OPEC+ to listen when you have made it clear that most of the major oil-producing nations are no longer important.
    • The administration is also calling on the FTC to investigate gasoline “price gouging.”  I have covered energy since 1989 and have seen this sort of call occur numerous times.  It’s a bit like “rounding up the usual suspects.”
    • Overall, we don’t think this jawboning will have any effect.  The White House should be worried about higher energy prices hurting them politically.  An easy response would be to support domestic production which supports the U.S. economy.  Having OPEC+ increase output does nothing to meet climate change goals.
  • Recent fires in North Dakota are increasing calls for greater environmental rules on fracking in a region generally supportive to the activity.
  • The administration is reviewing oil and gas drilling rules for northern Alaska.
  • This week, the Senate held its amendment session for the upcoming budget.  In general, this activity is an exercise in political posturing.  The goal is to frame one party’s policies in a favorable light and make the opponent’s position unattractive.  It’s mostly a gaming session, but occasionally some insights emerge into the leanings of senators.  For example, an amendment to prevent the EPA from banning fracking picked up several Democratic Party votes.  Another one to means test EV tax credits won narrowly.  It is unlikely either will ever become law, but it does show where senators are leaning.
  • NOAA is still calling for an active hurricane season.  So far, the Atlantic has had seven named storms.  NOAA is still projecting 15-21 named storms.  Hurricane activity usually peaks on September 10.

Geopolitical news:

Alternative energy/policy news:

View PDF

Weekly Geopolitical Report – August 15, 1971 (August 9, 2021)

by Bill O’Grady | PDF

Next week, we will observe the 50th anniversary of President Nixon’s decision to exit the Bretton Woods agreement.  This choice was part of a broader package of policy actions designed to deal with a series of issues, including inflation, unemployment, and a balance of payments problem.  As is often the case, the focus of attention from Nixon’s address to the nation was probably on the announced wage and price freeze.  But, his decision to end the link to gold was monumental.  We have discussed this issue before,[1] but in light of the impending anniversary, it seemed right to revisit it again.

This report begins with a review of the problems Nixon faced and how he addressed them.  To put the issue into context, we examine two trilemmas: 1) Robert Mundell’s trilemma, which frames exchange rate, capital account, and monetary policy; and 2) Dana Rodrik’s trilemma, which analyzes the relations between global economic integration, domestic politics, and the nation-state.  From there, we look at the world Nixon wrought, what remains, and what is struggling to be maintained.  As always, we close with market ramifications.

Read the full report


[1] See WGRs, “Weaponizing the Dollar: Part I (8/12/2019) and Part II (8/19/2019).”