Daily Comment (March 28, 2016)

by Bill O’Grady and Kaisa Stucke

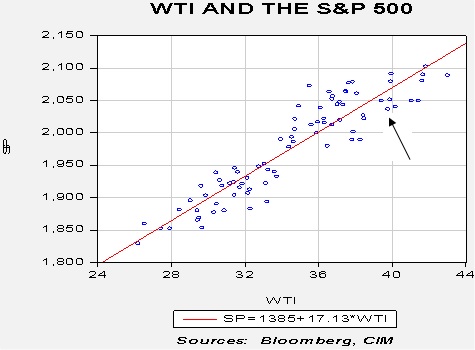
[Posted: 9:30 AM EDT] Trading was quiet overnight.  Hong Kong and European markets are closed for Easter Monday, which limited market activity.  On Good Friday, the Commerce Department issued the GDP report for Q4 (see below).  In addition to our usual coverage, we want to highlight a couple of important charts from this report.

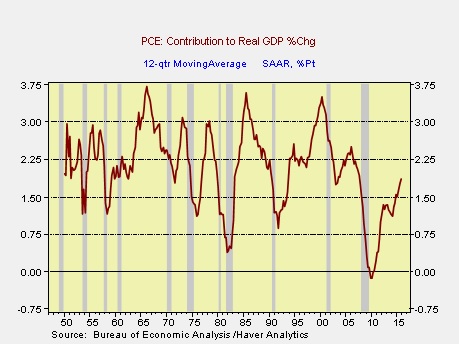
This chart shows the 12-quarter moving average of the contribution from consumption.  As the chart shows, consumption collapsed during the Great Financial Crisis but has since rebounded sharply.  Note that no recession has ever occurred with the measure rising.  Improving consumption is probably the most favorable data on the economy.

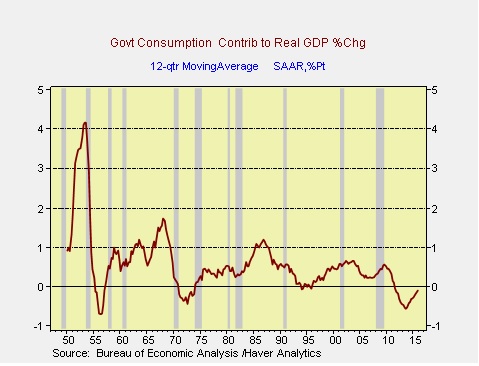
Perhaps the second most positive development for the economy is that government is almost no longer a drag on the economy.  Now, in an age of deficits and fights over the fiscal budget, suggesting that the lack of government spending is acting as a drag on the economy seems illogical.  However, we note that in the GDP calculation, government’s contribution to the economy is what government spends on “stuff”—bridges, tanks, roads, etc.  That discretionary part of the budget has been dramatically squeezed in this business cycle, meaning the government has subtracted from growth at its fastest pace since the demobilization from the Korean War.  However, as state and local government budgets improve, spending is also improving, adding to GDP.

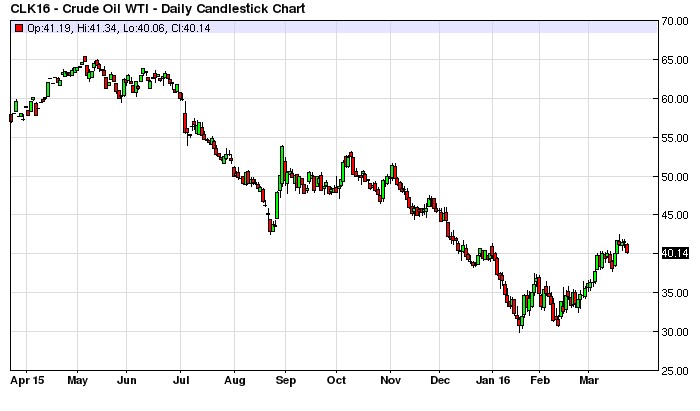
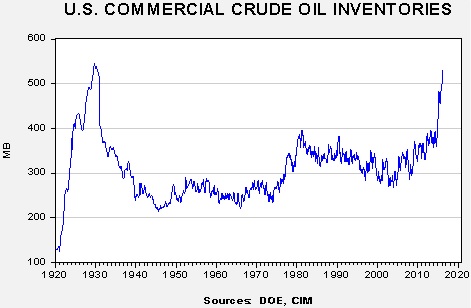
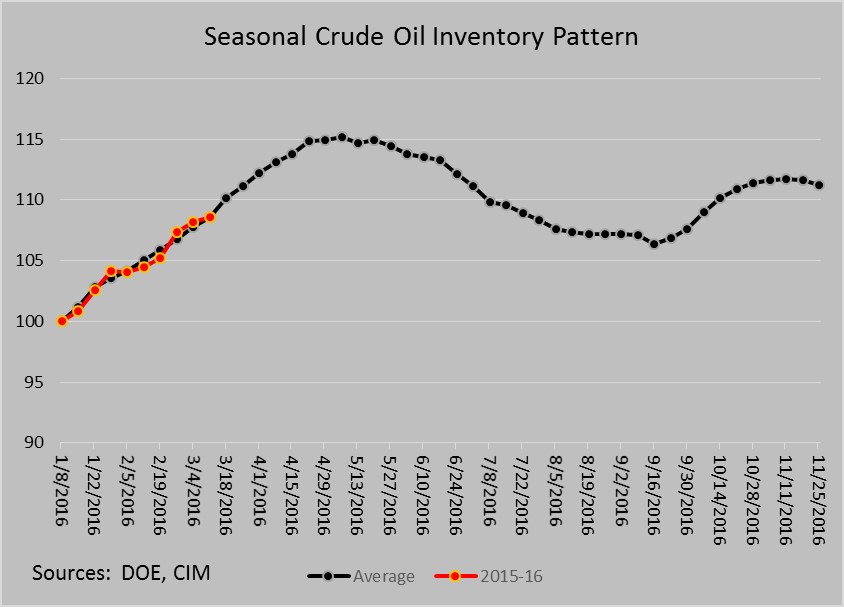
We have been getting a number of questions about our coverage of oil inventories.  Due to the attention on oil prices and their tight correlation to equities, we have been regularly updating the oil inventory data in this report; we have been mostly focusing on the seasonal pattern in oil stockpiles.  However, a number of readers have correctly noted that because demand is higher today, current inventory levels nearing the highs set in the 1930s is really not a fair comparison.  This is true.  So, to address these comments, we have created the two charts shown below.

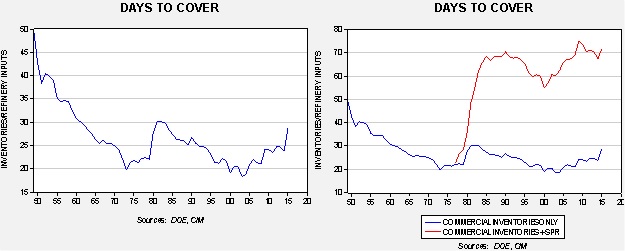
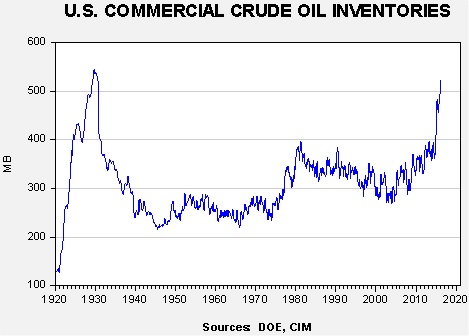
To measure the level of inventory to demand, we divide oil inventories by the amount of crude oil that is used by refineries.  That measure tells us how many days of inventory exist at the current refinery run rate.  The chart on the left looks at commercial crude oil inventories only.  Unfortunately, the DOE data only goes back to 1949, so we can’t capture the days to cover from the 1930s, but it is fairly clear that current inventory levels are not excessively high by this measure.  In fact, inventories are only approaching the levels seen during the early 1980s when oil companies were hoarding oil due to the Iran-Iraq War.

However, there is another element to the story.  In 1977, President Carter began filling the Strategic Petroleum Reserve (SPR) as part of an international effort to create an emergency supply buffer to counteract future supply disruptions from the Middle East or elsewhere.  The actual availability of the SPR is always an issue—defining what constitutes a real emergency is difficult.  On the other hand, the existence of the SPR probably does have some impact on storage management; before the SPR, commercial firms had to have large enough supply buffers to counteract events that might reduce supply.  Once the government took over this role, firms were no longer required to keep storage on hand for emergencies.  Thus, the right-hand chart is probably a more accurate snapshot of how much oil is available.  Interestingly enough, the right hand chart tells us that the current level of stockpiles, relative to refinery operations, isn’t all that unusual.

Our analysis suggests that commercial crude oil stocks are more critical to oil prices than the SPR, although we have done work that suggests adjustments to the Strategic Reserve have an impact on prices.  For example, in the fall of 1990, President George H.W. Bush ordered a test withdrawal from the SPR to see if it could be used in the case of war in Iraq.  The very announcement coincided with the peak in prices (although we did see a new panic high on the day the air war started that was very short lived).  In addition, his son’s policy of filling the reserve during his term likely boosted oil prices as well.

The bottom line is that when the SPR is included, oil stocks are ample and the rise in commercial inventories, which are unencumbered by policy, has an even greater impact.  Simply put, a major recovery in oil prices, barring a geopolitical event, needs a reduction in the inventory overhang.

View the complete PDF

Quarterly Energy Comment (March 24, 2016)

by Bill O’Grady

The Market

Oil prices have fallen steadily over the past year, reaching a new low early in the first quarter just below $30 per barrel.  Since mid-February, they have staged an impressive recovery.

(Source: Barchart.com)

Oil Prices and Inventories

This rally has occurred despite historic levels of U.S. commercial crude oil inventories.  The chart below shows the level of inventories dating back to 1920.  The current level of stockpiles is only about 12 mb below the all-time high set in October 1929.  The DOE estimates that U.S. working crude oil storage is 502 mb.  With current inventory levels at 533 mb, we are well above the working storage level.  Although there were some concerns over a price collapse if storage costs become excessive, thus far, the industry has been able to manage these high inventory levels without serious trouble.  Additionally, with the inventory build season nearing an end, the odds of breaking the recent lows are growing less likely.

View the complete PDF

Daily Comment (March 24, 2016)

by Bill O’Grady and Kaisa Stucke

[Posted: 9:30 AM EDT] As noted below, St. Louis FRB President Bullard has joined a chorus of other regional presidents pushing back against the dovish tone from the last Fed meeting.  The change in Fed behavior is discussed in this week’s Asset Allocation Comment, published below on page 7.  As these comments ripple through the market, we are seeing the recent rally fade in commodities, foreign currencies and equities.

What is becoming evident is that the paths of several markets are increasingly dependent on U.S. monetary policy.  The tone out of the March meeting was clearly bullish.  However, subsequent speeches have also made it known that this dovish position isn’t universally shared.  We do believe that Yellen is probably fending off the Phillips Curve adherents on the committee by using inflation expectations and dollar strength to argue against further tightening.  The dots plot suggesting two rate hikes this year is probably about right, but the financial and commodity markets are taking the position that monetary policy will be consistently accommodative.  For that to happen, Chairman Yellen is going to need to keep control of the committee against rising opposition to policy accommodation.  If she loses the battle, equities and commodities are at risk, whereas the dollar and Treasuries should benefit.  In general, it is usually safe to side with the chairman; however, it should also be noted that she probably can’t hold her position with three dissents on any policy decision.

At present, it would not be a stretch to see Bullard, George, Williams and Mester press for a rate hike in April.  If they hold off, that concession probably only comes with a promise to raise rates in June.  Only George has shown she will consistently dissent.  Growing opposition to dovish policy could make Yellen’s job much tougher in the coming months and create choppier markets.

Oil prices fell yesterday as inventories rose well above expectations.

Current stockpiles are 532.5 mb, only about 12 mb below the all-time high set in October 1929.  Based on seasonal patterns, we would expect that oil record to be broken before the end of next month.

This chart indexes current storage levels compared to the past five-year average.  By the middle of next month, the injection season will come to a close.  If we assume that the EUR/USD exchange rate remains in the $1.11 neighborhood, a return to the low $30s on crude oil is possible.  However, by late summer, a return to the low $40s would be expected.  To some extent, we view the crude oil market as a bit ahead of itself, but the bearish seasonal situation is almost over.

The relationship between oil prices and equities remains very tight.

The current pair of oil prices and the S&P 500 are noted with an arrow.  The current level of the equity index is a bit below the linear regression line, suggesting the market is a bit cheap.  If this relationship holds, a trip to the low $30s in crude oil will likely result in an S&P between 1,900 and 1,950.

View the complete PDF

Daily Comment (March 23, 2016)

by Bill O’Grady and Kaisa Stucke

[Posted: 9:30 AM EDT] In the aftermath of the terrorist bombings in Belgium, security officials in Europe have been working feverishly to track down the identities of the bombers and search for other terrorist cells.  It is widely thought that this cell was already in place and may have decided to activate after the recent arrests of other suspects.

A couple of observations are in order.  First, it appears that financial markets are becoming increasingly inured to terrorist events.  The reaction in equities was quite modest and the rally in gold is partially reversing today.  Second, attacking Brussels, the seat of the EU, looks like a big deal.  However, true sovereignty rests at the national level, not at the continental level.  The EU has no military.  It has a continental investigation unit but it cannot issue arrest warrants.  IS won’t face calls for military intervention like those that followed the Paris bombings.  The reason is that France has a military; the EU does not.  Thus, the attacks in Brussels are more symbolic than the Paris attacks but probably won’t lead to stepped up attacks on IS.

Is Yellen facing a rebellion?  The last FOMC meeting was decidedly dovish but three presidents, Dallas FRB President Harker, San Francisco FRB President Williams and Atlanta FRB President Lockhart, all made statements this week suggesting that they disagree with the pause in rate hikes and want the Fed to start raising rates.  It should be noted that none of these presidents are voting this year.  Thus, their statements, though important, don’t necessarily mean that policy is going to reverse.  However, it does suggest that Yellen may be facing more opposition to a dovish stance.  At the last meeting, KC Fed President George dissented.  At the time of this writing, St. Louis FRB President Bullard is talking on Bloomberg and is leaning toward tightening, although he seems quite comfortable with an inflation overshoot.  Bullard is a voter and he said he wants to see April as a “live meeting,” but the real thrust of his comment is that he thinks the Fed is giving out too much information and should stop offering “balance of risk” statements and dump the “dots” chart.  We agree this is exactly what the Fed should do.  The real issue is that the markets have adjusted to a dovish central bank and these statements suggest that the robustness of this dovish stance may be rather low.

Oil prices have enjoyed a nice lift (we get the DOE data later this morning), but the IEA is on the tape today suggesting that the OPEC freeze may be “meaningless” because Saudi Arabia is the only nation that can boost production anyway.  It is our position that this rally was a correction from oversold levels that were caused by uncertainty surrounding the availability of storage.  It appears that the industry has managed to find space for inventory and this, along with a drop in the dollar (partly caused by the unexpectedly easy Fed, noted above), has led to a strong rally in oil prices.  We believe this rally has eliminated the oversold rally and more, and a modest correction (prices between $30 and $35 per barrel) is likely in the coming weeks.  We think the recent lows will likely be the lows for this cycle but we don’t expect a major recovery unless the Saudis change their oil production policy.  In other words, without a cut in Saudi production, the oil price recovery will be “L” shaped, like what we saw after the oil market stabilized in 1986.

View the complete PDF

Daily Comment (March 22, 2016)

by Bill O’Grady and Kaisa Stucke

[Posted: 9:30 AM EDT] The big overnight news was a series of apparent terrorist bombings in Belgium.  At the time of this writing, 34 are confirmed dead after two bombing attacks, one at the Brussels airport and the other at a metro station near EU headquarters.  There have been reports of evacuations of a park near the royal palace and the palace itself.  At this time, it isn’t clear if more attacks are in the offing.  It is presumed that these were conducted by Islamic extremists; according to Belgian authorities, one attack was carried out by a suicide bomber, which is consistent with the operational tactics of Islamic terrorists.

Financial markets are reacting in a manner consistent with other such events.  The dollar, yen, Treasuries and gold are higher, while equities in Europe and the U.S. are lower.  Usually, such attacks don’t have an extended impact on the markets unless they are followed by additional events in short order.  It is highly probable that these attacks are in retaliation for the recent arrest of Salah Abdeslam, who is thought to be a key figure in the Paris terrorist attacks.

In other news, as we show below, the flash PMI data is out.  The European data was stronger than expected, led by robust German growth, while Japan was weaker than forecast.  The U.S. data is out later today.

Both Bloomberg and the WSJ are reporting comments about introducing “helicopter money.”  It is becoming apparent that monetary policy is reaching the point of diminishing returns.  With interest rates already low, QE is now at the point where central banks are simply accumulating assets.  The recent decision by the ECB to buy corporate debt dovetails with the BOJ’s purchases of equities.  At some point, it will become apparent that these measures merely prop up the financial markets but do little to actually boost economic activity.  Globally, investment remains depressed and the wealth effect hasn’t helped boost consumption.  For the most part, monetary policy works through the financial system but it does have the problem of “pushing on a string.”  In other words, just because one can create conditions that foster borrowing doesn’t mean that borrowing will actually occur.  Creditors may be spooked by the inability of debtors to service debt even at low rates, and debtors may not want to borrow.  Going to NIRP is probably the Almighty’s way of suggesting that monetary policy is exhausted; after all, the distortions caused by negative interest rates may far exceed the benefits.

Helicopter money means that the central bank directly funnels money to consumers, either by direct injections of liquidity to households (thus the metaphor of “helicopter”) or by direct monetization of fiscal spending.  We have seen others talk about this as well; Jeremy Corbyn has proposed “QE for people” by directing funds to the public rather than through the financial system.  If there is a dearth of public investment, monetization of fiscal spending on roads, bridges, etc. is probably a better way to inject funds into the economy.  In a developed economy, the direct support of household spending might work better.  It should be noted that such activity does occasionally occur during periods of war; during WWII, the Fed capped interest rates despite massive government borrowing, which was a form of debt monetization.

Although helicopter money has the tone of something from Marx, it was actually proposed by one of the titans of conservative economics, Milton Friedman.  Would it be inflationary?  Eventually, although in a world awash in excess capacity it might take longer to create inflation than one would think.  If trade remained open, one would expect to see a flood of imports and a weaker currency result.  Although we are not at the point where such policy moves are imminent, we would not be surprised to see this policy deployed if rates are very low going into the next recession.

Finally, former President Bill Clinton got a bit off message yesterday with this quote:

If you believe we can all rise together, if you believe we’ve finally come to the point where we can put the awful legacy of the last eight years behind us and the seven years before that when we were practicing trickle-down economics…then you should vote for her.

This comment flies in the face of his wife’s campaign, who has been running on a platform similar to that of a sitting vice president, namely, honoring the legacy of the last president.  After all, George H.W. Bush didn’t run as a change candidate when he succeeded President Reagan.  Although the former president tried to walk back the quote, suggesting he was talking about obstructionism, it is hard to argue that Obama faced much obstruction in the first two years of his term when his party controlled both houses of Congress.  Either Mr. Clinton “has lost something off his fast ball” or he may have revealed his true feelings.

View the complete PDF

Weekly Geopolitical Report – The Russian Withdrawal (March 21, 2016)

by Bill O’Grady

On March 14th, Russian President Vladimir Putin surprised the world with an announcement of the withdrawal of Russian troops from Syria. The move was unexpected and has raised questions as to whether Russia will really pull its forces out of Syria, and if so, why? In this report, we will examine Russia’s initial decision to place forces in Syria and discuss if Putin really means to remove his troops from the country. We will examine what might have prompted the decision to announce the withdrawal and, as always, discuss the market implications of the decision.

View the full report

Daily Comment (March 21, 2016)

by Bill O’Grady and Kaisa Stucke

[Posted: 9:30 AM EDT] There wasn’t too much news over the weekend.  Perhaps the most interesting news came from the NYT, which carried a report that establishment Republicans are considering a third-party candidate if Donald Trump wins the nomination.  Although such actions are not seen often in the U.S., they are quite common in Europe.  In fact, this is how the European establishment has kept the populist parties from gaining power in the major Western European nations.  For example, in recent regional elections in France, the National Front did very well in the first round of elections.  In response, the Socialists, who represent the center-left establishment, pulled their candidates for the second round of voting, ensuring the center-right conservatives would carry the election.  Essentially, the establishment, which includes the center-left and center-right, will engage in a form of political suicide to ensure that a populist party fails to gain control.  By running a third-party conservative candidate, the GOP coalition would be split and guarantee that the presumptive Democratic Party nominee, Sen. Clinton, will be the next president.  Of course, this assumes that Sen. Sanders doesn’t make the same play by running as an extra-party candidate himself.  The fact that the GOP establishment is willing to consider a third-party candidate confirms our position that the establishment prefers a leader from the opposite party rather than a populist.

Meanwhile, in the U.K., PM Cameron’s position is becoming increasingly difficult.  Over the weekend, Pension Minister Iain Duncan Smith resigned after the Tory budget included cuts to the disabled.  Cameron is trying to prevent the U.K. from leaving the EU and budget turmoil is the last thing he needs; this will undermine the popularity of his administration and give Brexit supporters a chance to build support for their position.  As a side note, recent polls show that Labour leader Jeremy Corbyn is now as popular as the prime minister, suggesting that if Cameron faces a no-confidence vote, the British equivalent of Bernie Sanders will be running the country.[1]

View the complete PDF

____________________

[1] See WGR, 9/21/2015, Meet Jeremy Corbyn.

Daily Comment (March 18, 2016)

by Bill O’Grady and Kaisa Stucke

[Posted: 9:30 AM EDT] As noted below, we have a large number of Fed speakers today.  Perhaps we will get further insight into the FOMC’s thinking on policy.  It is becoming increasingly evident that the Taylor Rule models, which incorporate the Phillips Curve, are either out or being temporarily superseded.  As we noted yesterday, the steady decline in inflation expectations is likely playing a role in tightening delays.  However, the forex situation may be even more important.  Bloomberg[1] is reporting today on speculation that the G-20 has engineered a dollar decline.  We find this discussion incredulous.  If the major central banks were trying to weaken the dollar, why would several European banks, including the ECB, ease policy?  Yes, the BOJ didn’t take any steps to ease further, but PM Abe appears to be increasing pressure on the BOJ to lower rates more.  Instead, we think the WSJ has it right.[2]  It has an article today with the headline, “Global Currencies Soar, Defying Central Bankers.”

We are starting to think that this is more like a quiet currency war.

The chart above shows the JPM real effective dollar index, which adjusts for trade flows and inflation.  We are in the third major bull market in the dollar; as the chart below shows, it began in mid-2014.

Note last month’s decline.  We can assume further weakness this month, too (although we won’t know for sure until all the inflation data is recorded).  In terms of policy, the dollar’s strength acted as a form of tightening.  However, for the FOMC, this is a rather difficult problem because the Fed does not have the mandate for managing the currency; that mandate rests with the Treasury.  Nevertheless, these constant comments about “global risks” may simply be a thinly veiled signal that the Fed won’t raise rates until the dollar weakens.

This scenario pits central bank leaders against each other, much like what history recorded during the Great Depression.  When there is a dearth of global aggregate demand, capturing that demand becomes a zero sum game.  The transmission mechanism for capturing that demand is the exchange rate.

The chart above shows the ratio of U.S. to Eurozone industrial production and the JPM dollar index.  Note that when the dollar was weak, U.S. production outpaced Europe.  However, the relative performance reversed shortly after the dollar began to appreciate.  This occurred despite the fact that the Eurozone has been hit with numerous crises that have tended to dampen the region’s economic performance.

If the Fed is shifting to a de facto exchange rate policy, it means that our historical models won’t be all that informative as long as that policy is in place.  The other key to watch is the reaction of the other central banks.  If they hold policy steady, the aforementioned Bloomberg report may be correct.  In other words, G-20 monetary authorities are working in concert to boost the dollar.  We don’t believe it.  We think the BOJ and ECB, along with the remaining independent European central banks, will “do whatever it takes” to weaken their exchange rates.  We will have more on this topic in the coming weeks.

View the complete PDF

____________________

[1] http://www.bloomberg.com/news/articles/2016-03-17/shades-of-plaza-accord-seen-in-barrage-of-stimulus-after-g-20

[2] http://www.wsj.com/articles/global-currencies-soar-defying-central-bankers-1458258134 (paywall)

Daily Comment (March 17, 2016)

by Bill O’Grady and Kaisa Stucke

[Posted: 9:30 AM EDT] Before we dive into the Fed and oil prices this morning, there are a couple of geopolitical items worth noting.  First, Brazil is facing massive civil unrest this morning after wiretaps revealed that President Rousseff offered to appoint former President Luiz Inacio Lula de Silva as Chief of Staff in a bid to avoid his prosecution.  A minister is immune from prosecution.  Second, there was an outbreak of violence on the Sinai Peninsula today as insurgents attacked an Egyptian military base in Rafah and there were reports of other smaller attacks as well.  Egypt faces numerous insurgent groups in Sinai, including IS.

The FOMC came out with a dovish report.  As expected, the Fed left rates unchanged and KC FRB President George dissented from the decision.  From there, however, the FOMC changed its stance on policy as shown by the dovish dots chart projections.

(Source: Federal Reserve)

The bulk of the votes are around 0.875% for this year.  One voter is actually at 0.625%, putting only one hike on the agenda.  The average is 1.02%, meaning that two tightening moves are forecast.

This chart shows the progression of the dots average compared to the market’s projection for policy, derived from the Eurodollar futures market.  The progression shows that the FOMC is steadily reducing its expectations for the terminal rate.  In fact, the average dot for this meeting is dead on expectations of the Eurodollar futures market, meaning the FOMC has moved its forecast year-end rate to what has already been discounted by the financial markets.  The Fed is still looking to move rates higher in the more distant years but, as the dots progression shows, it is highly likely that these expectations will probably fall as well…at least, that’s been the trend over the past several years.

We were surprised by the dovish stance of the Fed.  As we noted yesterday, inflation is clearly picking up and any Phillips Curve-based model suggests that monetary policy is getting behind the curve.  As we discussed yesterday, we were worried that Yellen would “tee up” a tightening for June.  Not only did that not happen, but the Fed actually uncorked a dovish statement. What led to this decision?  We believe it is one of three factors:

The FOMC has decided the Phillips Curve is no longer relevant.  This has been the position of Governor Brainard and Chicago FRB President Evans.  Although this is possible, recent comments from Vice Chairman Fischer suggest that he has not been swayed by this argument.

The FOMC still believes in the Phillips Curve, but is worried about inflation expectations.  Expectations have been falling for some time, and lifting the policy rate into declining inflation expectations means that policy is being tightened even more than simply an increase in rates.

This chart shows the five-year forward implied inflation rate using the Treasury TIPS.  From 2003 through 2014, the average expected inflation rate was 2.42%.  Over the past two years, it has declined to an average of 1.94% and, as the chart shows, it is falling rapidly.  One implied goal of Fed policy is to “anchor” inflation expectations.  In the 1970s, as expectations ratcheted higher, it became harder to control inflation because the very act of expecting higher inflation induced behaviors that exacerbated it.  Thus, consumers would buy today fearing prices would be higher tomorrow, and businesses held more inventory because it rose in value with inflation and inventory accumulation acted to boost demand.  The Fed’s worry is that in an environment of falling expectations, you get the opposite behavior.  Households delay purchases because prices are not expected to rise appreciably or, perhaps, may even decline.  Businesses do everything they can to not hold stockpiles.  It appears that the FOMC will be reluctant to lift rates as long as inflation expectations are weakening.

The FOMC is reacting to foreign developments, especially actions recently taken over the past few weeks by the ECB and BOJ to engage in additional stimulus.  We were most struck by the market reaction in the dollar and gold, with the former plunging and the latter rising sharply.  Although there isn’t much history of the FOMC paying close attention to the dollar and international events except in extreme cases, it is starting to look like the Fed is viewing the behavior of foreign central banks as a form of easing.  Of course, that only occurs if the dollar strengthens, which it didn’t do yesterday.

There are some commentators arguing that some sort of deal to support the dollar came out of the last G-20 meeting.  We strongly doubt this was the case.  Instead, we believe both the BOJ and ECB eased policy with the aim of weakening their currencies.  The lack of reactions in the JPY and EUR and failures to weaken after they eased, and the reaction to the Fed, suggests to us that something more like a “currency war” is underway.  Negative interest rate policy’s (NIRP) primary stimulative effect comes from a weaker currency.  If the dollar continues to depreciate, it will be interesting to see how the BOJ and ECB will react.  If our narrative is correct, we can expect to see further aggressive easing by these central banks.

We note the Fed didn’t offer a “balance of risks” assessment, which avoided exposing the divisions on the committee.  Thus, we expect that the second and third points are probably the keys.  Inflation expectations are a concern.  Although labor markets are clearly improving, the lack of wage growth suggests something isn’t working right.  The annual wage-setting season in Japan has been very disappointing for PM Abe in that wage increases are almost non-existent and NIRP is being blamed for the lack of labor bargaining power.  There is probably some legitimate fear among the committee members that perhaps the lack of inflation expectations (see above) is bleeding into the wage-setting process in the U.S.  Foreign developments could be weighing on the committee as well.  The expected divergence in policy led to a much stronger dollar that clearly dampened Q4 economic growth.  By not raising rates and by lowering the trajectory of tightening, the retreat of the dollar is good news for the U.S. economy.  However, as we discussed above, the negative reaction of developed market equities to the Fed’s decision shows how sensitive these markets have become to currency values.

So, the big winners from yesterday are commodities, emerging markets, foreign currencies, domestic equities and U.S. fixed income.  Losers look like the dollar and developed market equities.

This discussion takes us to the oil market.  Oil prices jumped yesterday, in part due to a lower than expected build in crude oil inventories but also due to the aforementioned dovish Fed statement.

Inventories remain historically high.  Assuming the usual seasonal pattern continues, we should end up with stockpiles of around 555 mb by the end of next month.

As this chart shows, we have about another six weeks before inventories peak.  Based on current oil inventories and the euro, fair value for crude oil is $36.70 per barrel.  Thus, current prices are a bit overvalued.  Assuming we continue to see normal seasonal builds, fair value by the end of April will be $31.02.  To justify current oil prices with the expected peak in stockpiles, the euro will need to strengthen to $1.155, which isn’t out of the question in light of the Fed’s behavior.

View the complete PDF