Daily Comment (April 6, 2016)

by Bill O’Grady and Kaisa Stucke

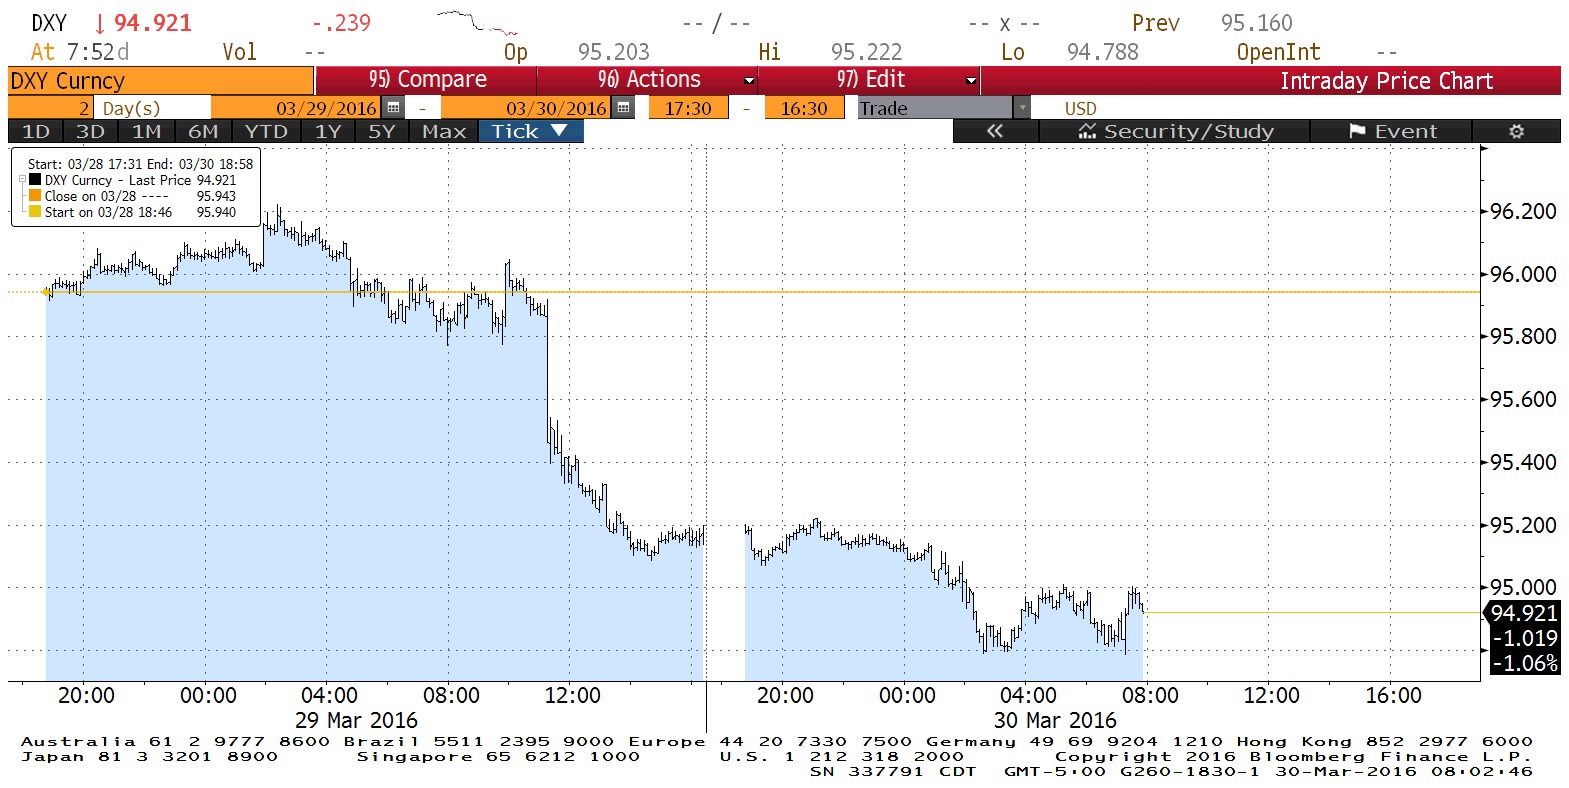
[Posted: 9:30 AM EDT] It was another quiet overnight session.  Oil prices jumped on reports from the American Petroleum Institute’s (API) weekly oil storage data, which showed an unexpected draw in stockpiles.  The API data can diverge from the official DOE data, which we receive at 10:30 EDT today.  A draw this time of year is unusual and, if confirmed by the government data, would be bullish for oil.  We are approaching the end of the inventory build season (more on this tomorrow); once seasonal stock draws begin, some of the pressure on oil prices will start to abate.  The other factor that has slipped under the radar screen on oil is that the dollar has weakened considerably in the past few weeks and the relationship of the dollar and oil has been virtually as tight as the one with inventory…so much so that they are statistically collinear.  If the dollar continues to weaken, oil prices (and, high yield bonds) will be a significant beneficiary.

The dollar has weakened because the Federal Reserve has backed away from its tightening path for this year.  Policy divergence has been a key element behind the dollar’s rally; as the Fed was tightening, the ECB and the BOJ have been easing.  Interestingly enough, we really never knew for sure which was more important—the relative hawkishness of the Fed or the dovishness of the ECB and BOJ.  Recent behavior seems to suggest that the most important factor is the Fed.  Today, the minutes of the most recent meeting will be released.  We would generally expect to see a report that is somewhat more hawkish than what the statement and press conference indicated.  This is because there is a constituency on the committee that adheres to the Phillips Curve and thus wants to see tightening accelerate.  Even dovish Boston FRB President Rosengren was quoted earlier this week warning that the markets have become too complacent about policy accommodation.  Thus, we would not be surprised to see a somewhat bearish surprise with the release.

One of the variables we closely monitor is the level of retail money market funds.  In general, rising levels of cash tend to be bearish for equity markets.

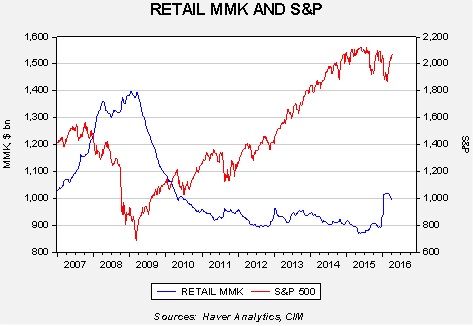
This chart shows the level of retail money market funds along with the S&P 500.  It appears that as investors liquidate equity positions, the funds are held in money markets, at least initially.  Equity market weakness in Q1 is reflected in the jump in money market funds held.  Note that we are starting to see money market fund levels decline and equities recover.  If the preferred level of funds is around $900 bn, there is a chance that equities will surprise to the upside.

View the complete PDF

Daily Comment (April 5, 2016)

by Bill O’Grady and Kaisa Stucke

[Posted: 9:30 AM EDT] We are seeing weaker equity markets this morning with little news flow.  The Treasury has announced new inversion rules that will likely discourage some of the merger activity.  The Panama papers are also sowing fear in the financial markets.  However, the most likely reason for the weakness is that equity markets are getting a bit frothy.

For several years we have noted that the S&P 500 has mostly tracked the size of the Fed’s balance sheet.  Whether this relationship is spurious isn’t completely clear, although we note that the balance sheet also tracks the Shiller CAPE since the bull market began in 2009.

Since 2009, the correlation of the CAPE and the Fed’s balance sheet is nearly 90%.  This would suggest that one of the positive factors from unconventional monetary policy was to lift investor sentiment.  Secular trends in stocks are usually measured around P/Es.  Secular bears usually have flat P/Es while secular bulls have rising P/Es.  The rise in P/Es has led some analysts to declare that a new secular bull began in 2009.  It might be true.  However, we disagree with this assessment because it seems that the expansion in P/Es hasn’t occurred because investors believe their world has improved markedly.  Instead, investors have gotten on board because they feel the FOMC has “got their back.”  Thus, to argue this is a new secular bull market means one believes that monetary policy will always be accommodative.  Simply put, the real test will be how P/Es behave when the balance sheet begins to contract.

So, let’s return to the model chart.  The model uses the Fed’s balance sheet and the St. Louis FRB financial stress index.  Currently, equity markets are “rich” to the model, running one standard error above forecast.  Fair value is 1990.51 based on current values for the balance sheet and financial stress (which is declining).  Overall, this suggests that the equity markets have gotten a bit ahead of themselves and, at a minimum, we should see a period of consolidation.

As equity markets have turned lower, the JPY has been on a tear.  The strength in the Japanese currency has led to a sharp drop in the Nikkei.  If the currency continues to appreciate, Abenomics will be in grave danger of failing (not that it has been a rousing success anyway).  Although BOJ Governor Kuroda has been downplaying the likelihood of further stimulus, the need is becoming rather obvious.  Thus, further negative rates might be possible.  However, the real goal is a weaker JPY; intervention may be the only effective tool left to the BOJ, but intervening in the current political environment in the U.S. could prompt a very negative reaction from the Obama government and will surely be a topic for future candidate debates.

Finally, the FT is reporting that Saudi Arabia is using its clout in the oil shipping business to disrupt Iran’s bid to boost oil exports.  Bahrain and Saudi Arabia have banned Iranian tankers from using their ports or traversing their territorial waters.  The Saudis, who are also part-owners of holding tanks in Egyptian ports, have denied Iranian vessel access.  These moves have slowed Iran’s return to global markets and are bound to increase tensions between the two nations.

View the complete PDF

Weekly Geopolitical Report – The Archetypes of American Foreign Policy: A Reprise (April 4, 2016)

by Bill O’Grady

We are currently experiencing one of the most contentious primary election seasons in at least 35 years.  Candidates have made numerous incendiary statements about foreign policy that offer insights into their thinking.  However, without a paradigm, it can be difficult for investors to determine what foreign policy decisions a candidate is likely to make.  By using these archetypes of American foreign policy, one can more easily anticipate how a candidate today might act if they were to occupy the Oval Office.  For this reason, I decided that our readers would benefit from a “refresh” of this study.

In 2012, we published a report titled “The Archetypes of American Foreign Policy.”  In that article, I borrowed heavily from Walter Russell Mead in his 2002 book, Special Providence.[1]  Mead took a unique approach in describing policy positions, using historical figures instead of abstract models.  Other policy analysts have used terms like “realists” or “idealists.”  Unfortunately, these broad generalizations fail to fully express the subtleties of American foreign policy.

Mead named four archetypes: Hamiltonian, Wilsonian, Jeffersonian and Jacksonian.  Each one of these archetypes has specific characteristics that describe the viewpoints and behavior of a policymaker of that certain type.  Mead does admit that other archetypes have existed throughout American history.  For example, the Davisonian was an archetype named after the President of the Confederate States of America.  Its goal was the preservation and expansion of slavery, and Davisonian foreign policy would be designed to support that institution.  Of course, this archetype ceased to exist after the South lost the Civil War.

By using a real historical figure as a representative of that archetype, it helps the reader to envision the position of that particular “school.”  As with all archetypes, these are considered model specimens for that particular type.  In real life, even these historical figures probably don’t fully capture the image that Mead projects for each type.  Actual policymakers tend to be a mix of these four types; rarely will a policymaker be of pure form.  However, the archetypes do offer a construct for an analyst to examine and predict the foreign policy behavior of elected officials.

In this report, we will briefly describe and discuss the four archetypes of American foreign policy.[2]  With presidential elections less than eight months away, I hope that this discussion will assist readers in examining the candidates and their potential foreign policy positions, using these archetypes as a guide.  This report will conclude with my characterization of the current leading candidates.

View the full report

____________________

[1] Mead, W. R. (2002). Special Providence: American Foreign Policy and How it Changed the World. New York, NY: Routledge.

[2] However, readers are urged to read Mead’s aforementioned book so as to better understand his position on the four major types of foreign policy.  My short report does not fully do justice to a 340-page book.

Daily Comment (April 4, 2016)

by Bill O’Grady and Kaisa Stucke

[Posted: 9:30 AM EDT] There wasn’t too much market news overnight as several Asian markets were closed for holiday.  However, there were several major news splashes from WikiLeaks, one of which published a massive database from the offshore law firm Mossack Fonseca.  A German newspaper, Süddeutsche Zeitung, obtained the data from anonymous sources and shared them with the International Consortium of Investigative Journalists (ICIJ).  The firm was involved in creating offshore tax shields; its base of operations is in Panama (which is why you are seeing these referred to as the “Panama Papers”), but it has 600 employees working in 42 countries.  The client list is quite impressive and includes the current president of Argentina, the PM of Iceland (who is facing a no-confidence vote due to the revelations), the King and the Crown Prince of Saudi Arabia, and the president of Ukraine, among others.  The list revealed that family members and friends of various leaders also used the firm’s services.  Azerbaijan’s first family were clients, as were some childhood friends of Vladmir Putin; even U.K. PM Cameron’s dad used the firm.[1]  This leak will cause some consternation in a number of countries and could undermine some governments.  The aforementioned Iceland appears to the first on the list but others are likely.

The other interesting WikiLeaks report is that it appears the IMF is putting strong pressure on Eurozone governments to give debt relief to Greece.  According to several reports, the IMF is pressing for a Greek default and is threatening to withdraw from negotiations.  Germany has insisted on IMF participation in part to offer an international imprimatur for enforcing austerity on Greece.  The negotiations on the last bailout are not complete and this news has raised anger in Athens that the IMF may use brinkmanship to force the EU to give Greece debt concessions.  The risk is that the EU refuses and Greece is faced with another financial crisis.  Given that Greece is the front line for the refugee crisis as well, the country is feeling a bit abandoned by the EU.  This leak won’t help.

With China’s growth peaking, one of the questions we are asked occasionally is, “Who is the next China?”  In the late 1980s, we were asked who the “next Japan” would be; it turned out to be, in fact, China.  Business Insider reports that India is likely the next low cost/high growth manufacturing giant on the horizon.  In terms of oil, India is now the third largest consumer, surpassing Japan recently (trailing the U.S. and China).   India has been frustrating to watch; shackled by the post-WWII British Labor Party socialist model, regulations have slowed development.  There was great hope that PM Modi would be the Thatcher/Reagan of India.  So far, he has been the Modi of India.  However, even without a “big bang” there has been steady improvement.  With India’s oil demand rising, the country is considering the creation of a strategic reserve, which would boost global demand and offer some support for prices.  According to reports, India is considering a 90 mb reserve.  It has also changed foreign investment rules to streamline investment into India’s energy sector.   Given the current low oil price environment, it would make good sense for India to consider building inventory capacity.  Although this decision, by itself, won’t fix the global oversupply problem, it is a good sign that demand is starting to react to low prices.

View the complete PDF

_______________________

[1]https://panamapapers.icij.org/the_power_players/?utm_source=Sailthru&utm_medium=email&utm_campaign=New%20Campaign&utm_term=%2AMideast%20Brief

Asset Allocation Weekly (April 1, 2016)

by Asset Allocation Committee

In the most recent GDP report, corporate profits plunged.

The overall decline in profits was $153 bn in Q4, although some of this drop was due to an $83 bn settlement that BP had with the government over the 2010 Gulf of Mexico oil spill.  We have been noting for some time that profit margins have been eroding.  This data tends to confirm that concern.

In our earnings forecast, we use a similar number from the National Income and Products Accounts (NIPA) that is similar to the above profits report except that it includes corporate taxes as well.

This chart shows the relationship between S&P 500 earnings as a percentage of GDP and the NIPA corporate profits after tax, depreciation and inventory adjustment.  We include this variable in a larger model that we use to project S&P earnings compared to GDP.  For the most part, the two series tend to track each other rather closely.  Periods when S&P earnings greatly exceed the NIPA numbers tend to signal that such divergences are not sustainable and they are resolved by a drop in S&P earnings.  Such divergences are evident in 1980, 2000 and 2007.  Fortunately, the two readings are not currently diverging.

Using the NIPA profits and GDP forecasts from the Philadelphia FRB, the relationship suggests that profits will recover in 2016.  In our latest update to our 2016 outlook, we reduced our earnings for the year mostly due to margin contraction.[1]  The most recent GDP data generally confirms this trend.  Overall, we are looking for a mostly flat year for the equity markets due to sluggish economic growth and mostly flat margins.  At the same time, we do not expect a recession this year, which should prevent a major pullback in equities.

View the PDF

_____________________

[1] See 2016: An Update.

Daily Comment (April 1, 2016)

by Bill O’Grady and Kaisa Stucke

[Posted: 9:30 AM EDT] Happy employment day!  We will go into much more detail below, but we are seeing solid improvement in the labor market.  Most importantly, the labor force is finally starting to expand; in fact, the unemployment rate rose this month in a good way as the labor force expanded faster than employment.  We have also seen a rise in wage growth, although it still remains soft.  The market is taking the data as hawkish, leading to higher interest rates today and a stronger dollar.

There were two overseas developments of note overnight.  First, China’s PMI data (see below) came in better than forecast, with the Caixin PMI number reaching 49.7, the highest report in 13 months.  The official report hit 50.2, above the 50 expansion line and a nine-month high.  Although some of this may be due to the timing of the New Year’s holiday, it does appear that stimulus measures are starting to have an impact, which is a good sign.  Second, Saudi Arabia’s Deputy Crown Prince Salman conducted a long interview with Bloomberg overnight.  The primary short run news is that the kingdom does not intend to freeze oil output unless Iran does as well.  This scotches hopes that OPEC + Russia were on the brink of a production deal; oil prices have fallen as a result.  Salman also suggested that the kingdom would only sell 5% or less of Saudi Aramco and would create a massive $2.0 trillion sovereign wealth fund to support the kingdom’s efforts.  Although the value of the wealth fund appears massive, in fact, it looks like Saudi Arabia will simply put Saudi Aramco in the fund which will become the bulk of its assets.  The most important takeaway from the interview is that Saudi Arabia is in no hurry to support an oil price recovery.

View the complete PDF

Daily Comment (March 31, 2016)

by Bill O’Grady and Kaisa Stucke

[Posted: 9:30 AM EDT] Standard & Poor’s lowered China’s credit rating outlook from stable to negative, citing a slower than expected economic rebalancing.  Although Chinese risk markets dropped initially, they have recovered since, indicating that the rating outlook cut is not likely to have a long-term effect.  We saw similar temporary weakness when Moody’s cut the nation’s rating outlook in the beginning of March, but equities were seemingly unaffected after the initial drop.  After all, it was already known that the rebalancing would be slower as the government attempts to maintain higher rates of growth through continued investment support.

Domestic wage growth, in general, has remained lackluster, with economists forecasting a 2.2% annual increase in hourly earnings for tomorrow’s employment report.  Yellen has cited disappointing wage growth as one of the reasons why she supports a cautious pace of monetary tightening.  The chart below shows a long-term history of growth in average hourly earnings.  Historically, and especially during the time that most of the Fed governors were completing their graduate degrees, the Phillips Curve was applicable, meaning that tighter labor markets led to higher wages which led to higher prices.  We note that this process is slow, with average inflation rising gradually as the labor market improves, but the closer we move to full employment the more likely it is that wage growth and inflation will accelerate.

The question of whether the Phillips Curve is still relevant is significant.  Although the unemployment rate has improved since the end of the recession, structural changes in the labor market mean that the participation rate has hardly moved from its recessionary lows and wages have remained stagnant.  We are seeing wage growth pick up in certain areas of the country as Minneapolis-St. Paul, Dallas and Seattle are all seeing strong yearly wage growth.  These “hot” wage growth regions could be the first signs of future general improvement in wages for the country.

View the complete PDF

Daily Comment (March 30, 2016)

by Bill O’Grady and Kaisa Stucke

[Posted: 9:30 AM EDT] Risk markets surged globally yesterday as Fed Chair Yellen re-confirmed the central bank’s intention to move rates up slowly, citing weak global growth.  This was exactly the kind of reconciliatory signal that the markets were looking for after several FRB presidents had voiced their support for moving rates higher, possibly as soon as next month’s meeting.  Clearly, the market likes a unified and clear message from the Fed’s leadership.

Risk markets jumped following her presentation, with the S&P 500 swinging to a positive change for the year.

(Source: Bloomberg)

Additionally, the dollar plunged almost the moment she started speaking.

(Source: Bloomberg)

Market expectations for a rate hike were dampened, with futures now showing a zero percent chance of a rate hike next month, a 28% chance of a hike by June, and a 54% likelihood of an increase by November.

View the complete PDF

Daily Comment (March 29, 2016)

by Bill O’Grady and Kaisa Stucke

[Posted: 9:30 AM EDT] European markets opened strongly higher after the long Easter holiday, but have given back some of the gains in early morning trading.  Asian equities were mixed, with Chinese markets trading lower.

All eyes will be turned to Fed Chairman Yellen’s address to the Economic Club of NY today.  Given the relatively sanguine tone from recent Fed speakers compared to the dovish tone of the most recent FOMC press conference, investors will be watching for indications of divergences within the FOMC.

Jon Hilsenrath, the “Fed whisperer” at the WSJ, recently penned an article suggesting that dissent has declined at the Fed.  He suggested that Dallas FRB President Kaplan, Philadelphia FRB President Harker and Minneapolis FRB President Kashkari are more moderate than their predecessors and we would concur with that assessment.  Kaplan and Harker replaced two very hawkish presidents, Fisher and Plosser, while Kashkari replaced Kocherlakota, who was very dovish.  On our 1-5 scale, which runs most hawkish to most dovish, the previous committee averaged 3.06 with a standard deviation of 1.5.  The current full committee averages 3.18 with a standard deviation of 1.2.  The good news is that the odds of dissent are lower, which means that Chairman Yellen will likely get her way.  At the same time, there is a lack of diversity of views, meaning that there are fewer members who would be likely to oppose the chairman if the FOMC goes in a bad direction.  If the two governor positions are filled this year, the board will likely become even more centrist.

In the wake of relatively soft Q4 GDP, the outlook for Q1 GDP is rapidly deteriorating.

This chart shows the latest data from the Atlanta’s FRB GDPNow model, which projects the current quarter’s GDP based on the flow of economic data.  With the downward revision to January personal consumption expenditures and the weak trade data, the current forecast is now 0.6%.  Although the employment data on Friday might give these numbers a boost, this data should scotch talk of Fed tightening in April.

This data shows the contributions to GDP based on the Atlanta FRB’s model.  Note that yesterday’s report cut growth by 80 bps and, since March 11, the GDP forecast has been cut by 170 bps.  All categories are down, which is a disturbing sign.

View the complete PDF