by Bill O’Grady and Kaisa Stucke
[Posted: 9:30 AM EDT] It was a news-heavy weekend with numerous major stories and cross currents. Let’s dive in:
Doha was an epic bust: Expectations for the oil producers meeting were rather low going in. Freezing already high production levels wasn’t going to lower the current supply overhang. Nevertheless, the meeting offered two items of support for oil prices. First, it suggested that OPEC+Russia could at least meet and talk, meaning that communication portals are being established. Second, an agreement would imply that as non-OPEC production declines later this year and in 2017, Saudi Arabia and others would not try to fill that void but would allow the supply overhang to be reduced. The failure to agree to a freeze was due to Saudi Arabia’s position that Iran needs to be party to any freeze, a clear non-starter for Tehran. Iran had already signaled last week that it would not freeze output by refusing to send its oil minister to the meeting. However, just before the meetings began, Iran said it would not send anyone to the meeting. Saudi Arabia is clearly not going to cede market share to Iran as non-OPEC production declines and so the supply overhang will remain in place a while longer.
It should be remembered that most OPEC producers’ output is at full capacity and only the Saudis have significant excess capacity to tap. If the Saudis keep production around the 10.0 mbpd level, another major decline in prices is unlikely. In addition, we are nearing the U.S. summer driving season and the seasonal decline in oil inventories. This factor will be bullish for oil almost regardless of what OPEC does. The U.S. is nearing the long-awaited slowdown in production which should also buoy prices. Finally, the FOMC’s dovish policy turn is dollar-bearish and commodity bullish (see below); if the Fed continues on this policy course, oil prices should continue to recover in the coming months.
We did see a strong opening drop in prices yesterday evening but prices recovered somewhat on reports of a Kuwaiti oil workers’ strike, which will take about 1.0 mbpd of production offline for the duration of the walkout. We would not expect this strike to last long but it has helped this morning. Overall, a decline in WTI to around $35 is probable but we would not expect to see much of a decline beyond that level.
Decaying U.S./Saudi relations: Since 1945, when Ibn Saud and President Roosevelt met on the U.S.S. Quincy in the Suez Canal, the two nations have been unusual allies. One nation is the world’s leading democracy and the other a theocratic kingdom. However, due to geopolitics and oil, the two parties have forged a relationship. That relationship is fraying. This week, President Obama is meeting King Salman in Riyadh to try to improve relations. This meeting comes as Congress is debating a bill that will allow the survivors of 9/11 to sue the kingdom for its citizens’ roles in the attack. The Saudis have indicated they might dump their $750 bn of Treasuries if the bill passes.
Saudi Arabia has disapproved of the foreign policies of the last two presidents. The kingdom viewed Saddam Hussein as a buffer against Iran. Removing the dictator without a workable plan to replace that government has led to a Saudi nightmare, a Shiite and Iranian-dominated government in Baghdad and chaos in the Sunni regions of Iraq. President Obama’s nuclear deal with Iran is seen as the first step toward normalizing relations with that country, which puts Saudi Arabia at risk. Comments in Jeffery Goldberg’s long interview with the president put the states in the region in a harsh light, suggesting they are “free riding” on the U.S. The problem is that if U.S./Saudi relations are completely ruptured we will not be able to control the kingdom and the odds of regional conflicts rise, which will put the security of oil supplies at risk.
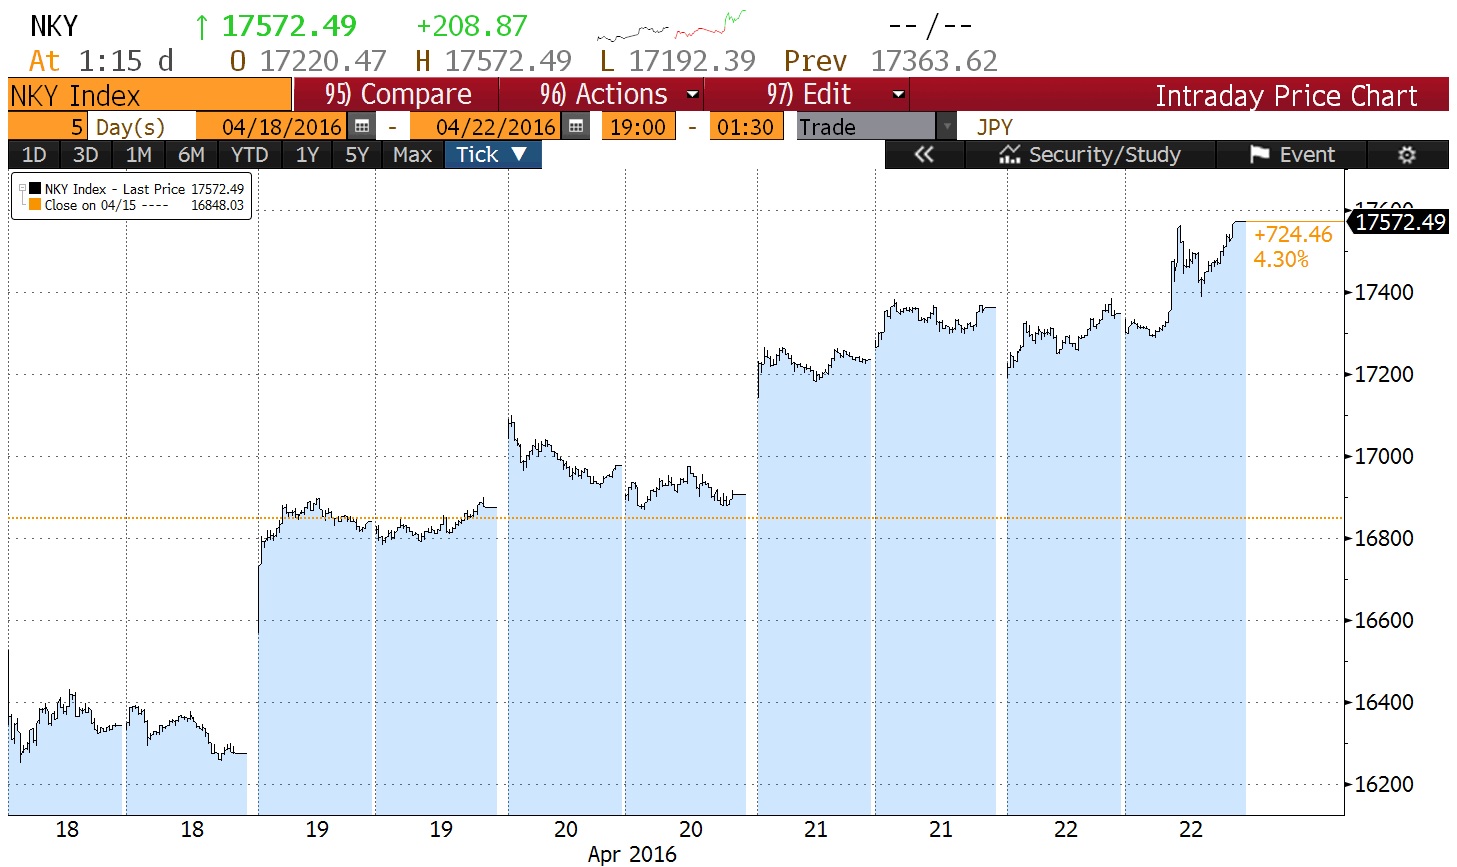
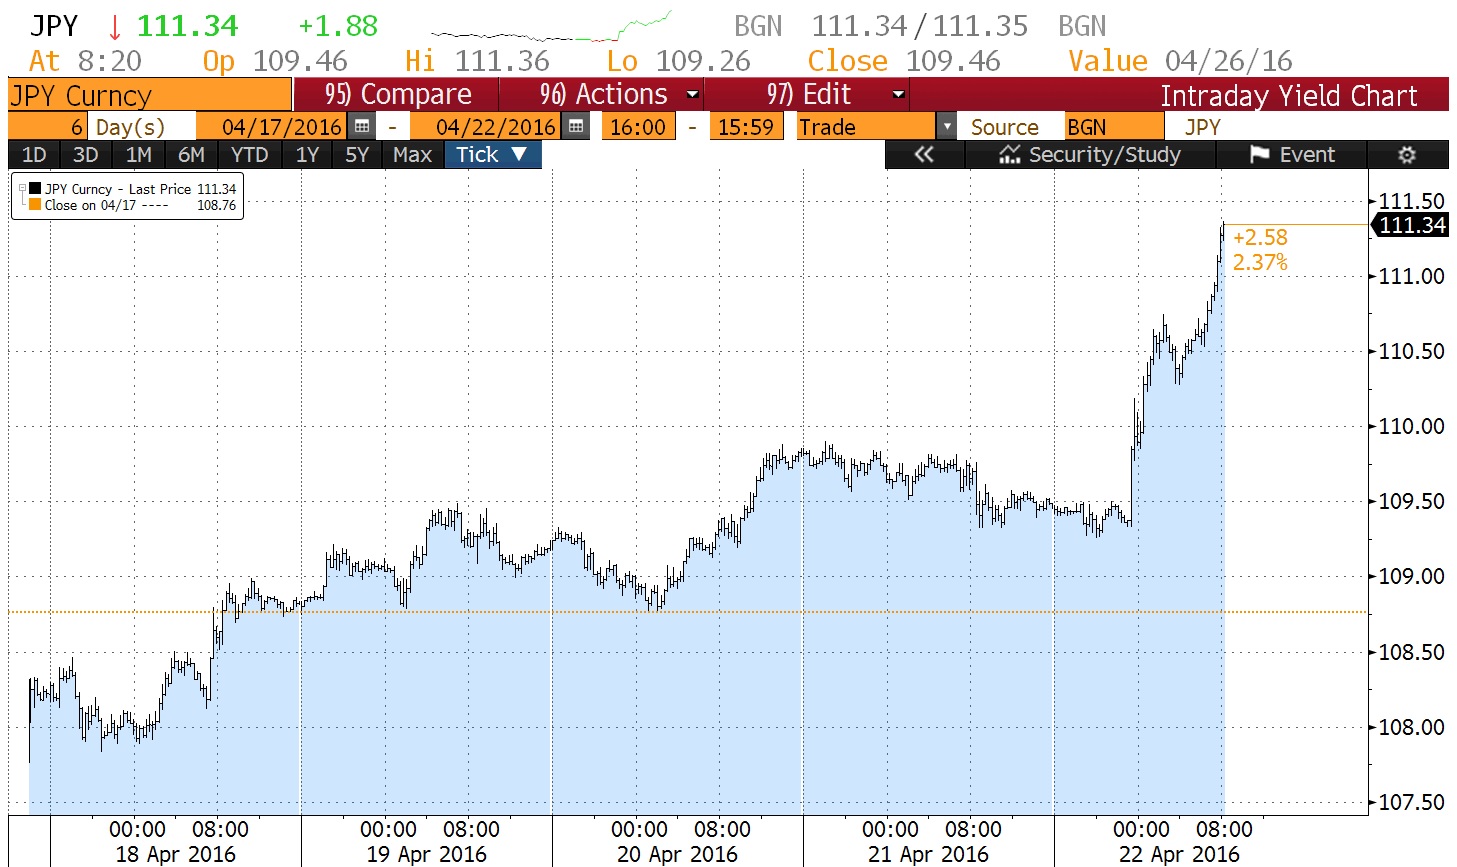
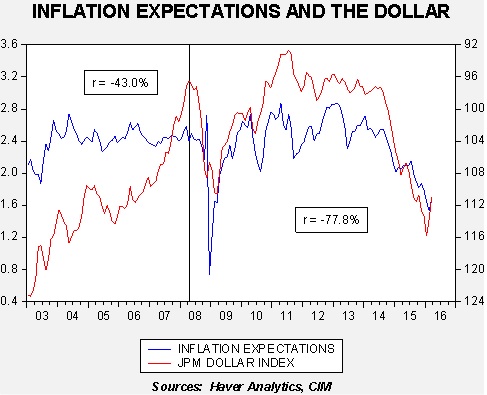
Japan loses support: In an unusual turn, U.S. Treasury Secretary Lew indicated that Japan had no justification for intervening to weaken the JPY. The Japanese currency has been weakening since it became clear that Abe was going to win the prime minister’s job in 2012. It was generally believed the U.S. had given tacit approval for the weakness. However, after nearly four years of weakness, the JPY has strengthened recently despite the BOJ’s foray into NIRP. Japan came to this weekend’s F-20 finance ministers’ meeting with hopes of securing approval for currency weakening policies. Instead, it was rebuffed. We believe we are seeing a quiet currency war; as we note in the current Asset Allocation Weekly (see below, page 6), if the FOMC has any belief in the Phillips Curve then there is no justification for not raising rates. As we discuss, there is a tight fit between the trade-weighted dollar and inflation expectations, and since the Fed seems to be using those expectations to defend steady policy, the Fed is engaging in a de facto currency signal for monetary policy. The next step is up to Japan and the BOJ. Will Japan move to further ease monetary policy with an eye toward weakening the JPY? Will the U.S. and the Fed tolerate such action or will the Fed signal that “low for long” has become “low for longer”? Up until recently, G-7 monetary authorities have been able to deny the currency war theory, but that position is becoming increasingly difficult to defend.
Rousseff is in trouble: Brazil’s President Rousseff lost her impeachment battle in the lower house 367-137, with seven abstaining. The measure needed a two-thirds majority to pass, which was 342 votes. The drama now moves to the upper house of the Chamber of Deputies. The upper house has 81 members; if 54 vote to impeach, she is removed from office immediately. If the majority but less than 54 approve impeachment, she steps down for 90 days while the Senate decides her fate. The vote will occur sometime in the next month. Despite the turmoil, Brazil’s equity markets have been on a tear, up 35.2% YTD for a USD based investor. Even with the vote, the Ibovespa is up 1.6% today. The hope is that impeachment will bring a market-friendly government to Brazil. We suspect this is far too optimistic. The left wing in Brazil is framing Rousseff’s impeachment as a coup, an unpleasant reminder of the country’s long history with military takeovers. An impeachment could lead to widespread civil unrest.
So, what does this all mean? The tight correlation between oil and U.S. equity markets is continuing, so a drop in oil prices due to the Doha disappointment makes sense. Japan losing support will likely keep the JPY strong, which is bad news for Japan’s economy and equity markets. Finally, the impeachment euphoria in Brazil may not have legs as the next leader of the country faces an economy in recession and a deeply divided electorate.
View the complete PDF