Daily Comment (June 7, 2016)

by Bill O’Grady and Kaisa Stucke

[Posted: 9:30 AM EDT] Chair Yellen’s speech yesterday was about as we expected; she didn’t say too much and did work hard to give her and the FOMC ample space to raise or not raise rates.  She did paint a view of the economy that was reasonably upbeat but also noted a series of concerns that she was watching.  Overall, the tone really hasn’t changed—the Fed wants to move rates higher but is being very cautious.   The good news is that the financial markets took the comments in stride and we are seeing stronger equity markets again this morning.

Of course, part of the reason the financial markets are better this morning is that we have seen a dovish shift in the fed funds futures.  There is now a 0% chance of a rate hike later this month and the markets don’t have the odds of a hike exceeding 50% until the December meeting.  We are not sure this degree of dovishness is reasonable in light of yesterday’s talk.  On the other hand, given how volatile this year’s election season could be, it is really hard to fathom the Fed injecting itself into that mess by changing policy in autumn.  Thus, we tend to agree that, barring some inflation shock, July is probably the last chance to change policy before the election cycle goes into full swing.  And, we doubt the data will improve that much in such a short amount of time to trigger a rate change.

China’s foreign reserves dipped by $28 bn to $3.19 trillion last month.  That was near expectations.  The stronger dollar weighed on China’s reserves, in that any reserves held in JPY or EUR reduced the dollar level of reserves.  The key takeaway is that China has managed to stabilize its currency without spending a lot out of reserves to stabilize it.  Thus, this is good news for China.

The U.S. and China are holding semiannual talks at the U.S.-China Strategic and Economic Dialogue meetings this week.  Treasury Secretary Lew suggested yesterday that China needed to reduce its industrial capacity because its production of industrial metals was overwhelming global markets.  China pushed back today, suggesting that the U.S. and the world cheered China’s expansion of capacity after the 2008 downturn as a way to boost global growth.  We suspect that the leaders of both nations are posturing.  China knows it needs to reduce its capacity; it doesn’t know how do to that without causing unemployment.  One trip through the U.S. rust belt makes it evident just how painful reducing capacity is in real life.  Chinese officials are grappling with the political and social fallout from cutting capacity and certainly don’t want it to look like the U.S. is pressing China to make such painful moves.  On the other hand, China’s pattern has been to talk about doing the right things but avoiding the pain once the policy change starts.  The U.S.  fear is that China is more likely to maintain the capacity and keep dumping goods on global markets, leading to global deflation.  We tend to expect that dumping is the more likely outcome and trade barriers are the most likely response.

With last week’s employment data, we can tentatively update our versions of the Mankiw rule model.  This model attempts to determine the neutral rate for fed funds, which is a rate that is neither accommodative nor stimulative.  Mankiw’s model is a variation of the Taylor Rule.  The latter measures the neutral rate by core CPI and the difference between GDP and potential GDP, which is an estimate of slack in the economy.  The latter number cannot be directly observed, only estimated.  To overcome the problem of potential GDP, Mankiw used the unemployment rate as a proxy for economic slack.  We have created three versions of the rule, one that follows the original construction by using the unemployment rate, a second that uses the employment/population ratio and a third using involuntary part-time workers as a percent of the total labor force as a measure of slack.

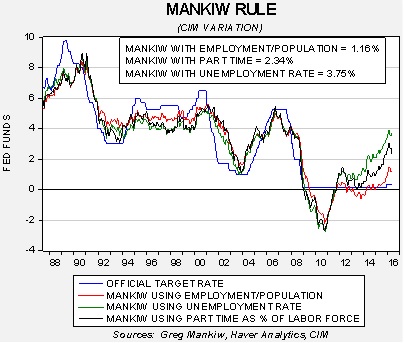
Using the unemployment rate, the neutral rate is now up to 3.75%, suggesting the FOMC is well behind the curve.  Using the employment/population ratio, the neutral rate is 1.16%, indicating that, even using the most dovish variation, the FOMC needs at least a 75 to 100 bps rate hike to achieve neutral policy. And finally, using involuntary part-time employment, the neutral rate is 2.34%.   Although these neutral rate estimates are well above the current target, it is important to note that two of the three have declined in this most recent calculation.

View the complete PDF

Weekly Geopolitical Report – The Tragedy of Venezuela (June 6, 2016)

by Bill O’Grady

The decline in oil prices has been a major problem for oil-exporting nations.  In general, the degree of disruption is mostly based on how well the country was run before oil prices plunged.

Venezuela has arguably been the worst run of the major oil producers.  The late President Hugo Chavez built an economy that was distorted by subsidies, price freezes and an arcane tiered exchange rate system.  His economic program only worked because of revenue generated by high oil prices.  Once oil prices declined, the Chavez economic system began to unravel.

Conditions have deteriorated to a critical point where it seems unlikely that the country can continue on its current path.  Barring an unexpected rally in oil prices, the economy appears to be on the brink of collapse.

In this report, we will explain how the distortions in the economy have led to the current crisis, discuss the future of President Madero and explore the possibility that Venezuela will become the first major oil producer to collapse and lead to an unexpected supply shock.  As always, we will conclude with market ramifications.

View the full report

Daily Comment (June 6, 2016)

by Bill O’Grady and Kaisa Stucke

[Posted: 9:30 AM EDT] The big news for today is Chair Yellen’s speech at 12:30 EDT today in Philadelphia.  This talk has been widely anticipated but will get even more attention following the much weaker than expected employment report for May, which was released last Friday.  Jon Hilsenrath of the WSJ is reporting that officials will likely not move rates this month but that July is still likely.  We expect Yellen to downplay a hike this month as well, but don’t be surprised if she tries to argue that July is still a possibility.  A good central banker always wants to keep her options open and this usually means being as non-committal as possible.  Thus, we would be very surprised if Yellen is clear on anything.

In Friday’s market action, the initial shock of the data led to a major drop in interest rates and weaker equities.  However, the latter rallied as the day wore on.  The most pronounced move though was in the dollar, which weakened considerably.  The weaker dollar led to a smart rally in commodities which continues this morning although weather is helping.  Summer is clearly coming to the Midwest, with rising temperatures forecast; this is boosting grain prices this morning.  And, TS Colin is making its way through the Gulf of Mexico, which could disrupt oil imports and offshore oil and gas production.

The other concern this morning is that the most recent polls suggest that the “leave” voters are gaining momentum in the U.K.  The GBP declined on the news.  We are viewing the Brexit vote as a potential reflection of the November presidential elections.  It is likely that the same voting sentiment that would prompt the exit from the EU would also support the policy stance of Donald Trump.  Although Trump has been sliding in the polls recently, we still expect this to be a tight race and that other surprises may be in the offing this year.

Because Friday’s employment report was such a shocker, we wanted to offer a few reflections on the data.  First, the decline in the non-farm payroll number and the labor force was probably exaggerated by seasonal factors.  The chart below shows the monthly change in the non-farm payroll numbers, with the series in red showing the seasonally adjusted change and the lower dots showing the raw data without seasonal adjustments.  Note that the seasonally adjusted data show a mere rise of 38k; however the non-seasonally adjusted data is up 651k.  This recent non-seasonally adjusted number is well below the past four years, which have averaged 891k.  So, this year’s change is well below previous years.

Some of the drop in May could be due to a rather strong March.

Over the past four years, March non-seasonally adjusted payrolls rose 854k; this year they rose 903k, most likely due to mild weather.

Something similar occurred with the labor force.

The actual data showed a 312k rise in the labor force; however, for the past four years, the labor force has increased by 1.062 mm, leading the seasonal adjustment process to signal a major contraction in the labor force.  It is worth noting, though, that the data in the last decade tended to see smaller increases in the labor force than seen post-recession.

Some observations…the weakness seen in May is real; it isn’t solely due to seasonal factors.  But seasonal factors did contribute to the weakness.  It is also important to note that the raw data show long term shifts over time.  For example, the May and March non-farm payroll data show a steady increase over time.  Some of this may be due to population expansion but it may also signal less seasonality overall.  The May labor force data, unadjusted, is remarkably volatile and thus the real question may be whether the past four years reflect a “normal” increase in the labor force in May or if the data in the last decade are more “normal” and the last four years are unusual.  If the latter is the case, the Bureau of Labor Statistics probably overstated the degree of contraction in the labor force.  What can we expect for June?  For the past four years, the non-seasonally adjusted change averaged 455k, meaning that for June we have a somewhat smaller hurdle to overcome.

We want to close the discussion with this chart.

It shows the rolling 12-month sum of the changes in non-farm payrolls along with the effective fed funds rate.  Since the early 1980s, most tightening cycles occur when the 12-month payrolls are rising by 2.5 mm.  About the only exception was the 2004-06 tightening cycle, which began with yearly payrolls growing below this level but on their way to the 2.5 mm growth area.  The fact that this cycle rose “early” suggests that Greenspan probably believed that the 1% fed funds target of that era was artificially low.  To a great extent, this relationship suggests the Fed waited too long to raise rates and missed its opportunity.  On the other hand, if tightening began in December 2014 as tapering began (which we would argue is probably the case), then the tightening occurred in line with historical patterns.  At the same time, this pattern would suggest the tightening cycle should probably be ending, not beginning.  Finally, on a side note, a drop below 1.5 mm usually signals recession.  We are above that level.

View the complete PDF

Daily Comment (June 3, 2016)

by Bill O’Grady and Kaisa Stucke

[Posted: 9:30 AM EDT] The employment data came in with a very negative surprise (see charts below for details).  Here are some of the highlights.  Non-farm payrolls rose by a mere 38k compared to estimates calling for a 160k rise.  The previous month’s numbers were also revised down by 59k; thus, taking the revisions into account, the payroll numbers were negative in May.  The telecommunication workers’ strike may have cut payrolls by around 35k, but the weak employment data cannot be blamed solely on the strike.  Services jobs rose 61k, while goods-producing jobs dropped 36k, with the total private jobs rising a mere 25k.

In the household survey, a 458k drop in the labor force, coupled with a 26k rise in employment, led to a drop in the unemployment rate of 0.3% to 4.7%.  Obviously, this isn’t the way one wants to see the unemployment rate decline.  The participation rate fell to 62.6% from 62.8%.  Those Americans not in the labor force rose by 664k, to 94.708 mm.  Over the past two months, the “not in the labor force” number is up 1.226 mm.  And, with all this, wage growth held steady at 2.5%, on forecast, and hours worked was unchanged at 34.4 hours, a bit below the 34.5 hours forecast.

Market action is fairly predictable.  The dollar is plunging, the EUR and JPY are appreciating, gold is up over $20 per ounce, equities are weakening and interest rates are falling.  The yield curve is steepening.  This data almost certainly takes June off the table for a rate hike and, barring some sort of major revision in the June report, July is probably not likely either.  Fed funds futures for a June hike were around 35% before the data; it has fallen to 6%.  For July, the same data is similar, from 45% to 30%.  In fact, you don’t get to a 50% odds of a hike now until November.

There is always an element of caution with the employment report.  Revisions do occur and other indicators of labor markets, like the ADP report and initial claims, gave no warning that a number this bad was in the offing.  Thus, it’s important not to over-react to the clearly negative tone of this report.  However, if the data doesn’t improve quickly, this is a very worrisome factor which will raise concerns about a downturn in the economy.

View the complete PDF

Asset Allocation Weekly (June 3, 2016)

by Asset Allocation Committee

The prolonged weakness seen in capital spending is a concern for the economy and equity markets.

This chart shows the yearly change in the three-month smoothed non-defense capital goods orders excluding aircraft.  The Census Bureau changed how it calculates this series in 1992; we have overlapped the yearly change in the earlier series.  In general, a negative reading is a concern.  It isn’t a certain signal of recession, and in some downturns it becomes weak late in the cycle, but, in any case, a persistent negative reading does suggest economic weakness.  The only other time the yearly change in this number was this negative without being associated with a recession was in 1987.

Taking this data from 1992 and regressing it against the S&P 500 suggests an overvalued equity market.

This chart shows the results of regressing non-defense capital goods orders, excluding aircraft, against the S&P 500.  The orders data closely fit this equity index until around 2012.  Based on this study, fair value is around 1383.

So, what is causing this divergence?  We suspect monetary policy, the dollar and corporate behavior are affecting the equity market.  Adding a proxy for buybacks and monetary policy, along with the yen’s exchange rate, reduces the degree of overvaluation.

Adding these proxies increases fair value to 1811, significantly reducing the degree of overvaluation.  This is still well below the current market, but it does show how equity markets have become dependent on accommodative monetary policy, dollar strength and share buybacks.  Without stronger corporate economic growth—which will boost the demand for investment goods—monetary policy tightening, regulation to reduce buybacks or a stronger yen could put pressure on equity markets.  We remain supportive of equity markets, although we are only looking for single-digit gains, at best, due to current valuation levels.

View the PDF

Daily Comment (June 2, 2016)

by Bill O’Grady and Kaisa Stucke

[Posted: 9:30 AM EDT] At the time of this writing, ECB President Mario Draghi is holding his press conference.  The ECB did give the markets a modest surprise by announcing it will begin buying corporate bonds almost immediately.  Policy will remain easy.  The EUR has weakened during his comments.

At the Geneva OPEC meeting, Saudi Arabia has apparently offered a cartel-wide production target.  This proposal is seen as an attempt by the kingdom to improve relations with the rest of the cartel.  Iran has flatly rejected the offer, wanting individual quotas to return.  Iran’s plan is not going to happen; we expect that Saudi Arabia wants to fill any gaps that develop from civil disorder in various cartel nations.  Individual quotas would make grabbing this market share more difficult.  According to most recent comments, OPEC was unable to agree on an output target.  The other item on the cartel’s agenda is to appoint a new general secretary.  The odds-on favorite is Mohammed Barkindo, the former head of Nigeria’s state oil company.  If a general secretary isn’t appointed, it will be taken as further evidence that the OPEC cartel is dysfunctional and would be modestly bearish for crude oil prices.

Finally, we look for a fairly quiet trade today in front of tomorrow’s employment data.  The current Bloomberg consensus calls for a 160k rise in non-farm payrolls and a 4.9% unemployment rate, which would be down 0.1%.  Wage growth is expected to rise 2.5% over the past year.  One key uncertainty surrounding the data is the telecommunications strike, which probably reduced payrolls by 30k.  These workers have returned to work but were still on strike during mid-May when the surveys were conducted.  If we get a 160k number despite the strike, it would suggest that the June data will be significantly stronger.  Simply put, a weak number does not necessarily mean the FOMC won’t move in June, but a strong number will almost certainly dictate a rate hike.  The ADP data (see below) suggests a good number but it isn’t clear how ADP handled the strike.

View the complete PDF

Daily Comment (June 1, 2016)

by Bill O’Grady and Kaisa Stucke

[Posted: 9:30 AM EDT] Domestic and European equities are trading lower, following gains in May.  While investors are increasingly looking for the Fed to hike rates this summer, domestic equities traded higher over the past month even with a rate hike more likely.  Today’s market weakness is likely driven by profit-taking as investors look forward to Friday’s payroll data and Yellen’s speech next week.

(Source: Bloomberg)

The chart above shows the S&P 500 since the beginning of the year.  The index is up 14.7% from the February low.

Global manufacturing PMIs were mostly close to forecast.  Chinese manufacturing numbers hovered right around 50, with the official manufacturing PMI reading at 50.1, a bit better than the 50.0 level forecast (shown in the chart below), and the Caixin manufacturing PMI at 49.2, on forecast.

(Source: Bloomberg)

Eurozone manufacturing also came in on forecast at 51.5 (shown in the chart below).  Germany, Italy and the U.K. all had PMIs above the growth line of 50, while France’s manufacturing contracted with a reading below 50.

(Source: Bloomberg)

Japanese PM Abe announced that his government will delay the implementation of a planned tax hike.  Although the move was highly anticipated, the yen fell in response.

(Source: Bloomberg)

View the complete PDF

Daily Comment (May 31, 2016)

by Bill O’Grady and Kaisa Stucke

[Posted: 9:30 AM EDT] Chinese equities rose sharply overnight as MSCI takes another look at adding this country’s equities to its emerging market indices.  In one sense, the exclusion of China’s equities in these key equity indices is hard to justify.  After all, China is an important country; its GDP is the second largest in the world and it has provided the bulk of global growth for most of this century.  However, index officials are concerned about the degree of government intervention in China’s securities markets.  China has put obstacles in the way of short selling.  Currently, companies can, nearly without notice, suspend trading of their shares.  According to media reports, MSCI is worried about this practice.  It should be noted that Bloomberg is reporting a surge in short selling against the FTSE China A50 index, which trades in Hong Kong and has fewer short selling restrictions.  We suspect the Xi government would like to see MSCI add Chinese equities to its indices as a sign the country is becoming developed.  At the same time, the Chinese government has become increasingly uncomfortable with allowing financial markets to set prices.  Although such sentiments are part of every Chinese policy plan, in practice, China seems to like market pricing until prices do something the government doesn’t like.  Then, it reverts back to intervention.  The recent behavior of the CNY is a clear example of China’s policy toward markets.  The PBOC supported letting the CNY float in a wider range until it looked like a weaker currency was triggering capital flight.  Since then, the PBOC has simply set the exchange rate.  We expect MSCI to add China to its indices; after all, the company makes money from licensing, and excluding China from its indices makes those products less attractive.  Unfortunately, if China is added, the indices will become affected by Chinese government’s actions.

Another trend we are noting is that the bitcoin exchange rate is steadily rising and the uptrend is accelerating.

(Source: Bloomberg)

This chart shows the level of bitcoin in USD.  After the 2013 spike, the cryptocurrency’s value steadily dropped into early 2015 and was mostly range bound until last autumn when prices began to rise.  Over the past couple of days, we have seen a surge in value.  Bloomberg, quoting the website bitcoincharts.com, notes that 90% of bitcoin trading is coming from China.  We suspect Chinese investors are using the currency as one avenue for capital flight.  Given the cryptocurrency’s anonymous structure, it is attractive to investors and others trying to keep their assets invisible to governments.  The recent spike in bitcoin may be a signal of growing financial system problems in China.

Yesterday, the JPY weakened considerably and it is steady this morning.  Now that the G-7 meeting is out of the way, we look for Japan to take steps to strengthen its economy via fiscal and monetary expansion.  We expect a fiscal stimulus package of at least 1% of GDP.  It will likely include actual spending and a delay of a VAT increase.  On monetary policy, about the only avenue left would be to expand QE as NIRP hasn’t worked as expected.

View the complete PDF

Daily Comment (May 27, 2016)

by Bill O’Grady and Kaisa Stucke

[Posted: 9:30 AM EDT] As noted below, Chair Yellen speaks later this morning.  This talk has been long awaited; however, we don’t expect too much.  In our opinion, Yellen remains dovish and would likely prefer not to move rates this year.  However, she does need to maintain control of the FOMC and so she occasionally has to acquiesce to rate hikes.  We look for a move of 25 bps in either June or July, which will probably be the last one for the year.  The market’s reaction to the anticipated hike has been quite controlled so far.  There has been an uptick in the two-year T-note yield, but not as high as we saw in December, and the dollar has rallied, but we haven’t revisited the recent highs.  Those reactions suggest that the markets are not projecting a summer move to trigger a series of future rate hikes.  To some extent, this is what the Fed has been trying to communicate; policy would only tighten gradually.  While this is good news in the short term, the policy seems strikingly similar to what the Fed tried to accomplish with its tightening cycle that ran from 2004 to 2006.  That cycle, on its face, didn’t cause the major market disruption that it needed to cause.  By not causing significant pain, risky leveraging behavior continued which culminated in the 2008 Great Financial Crisis.  So, bottom line, we don’t expect Yellen to say much and she will likely not dispel rate hike expectations for this summer.  Since this outcome is probably discounted, if we are correct, market action should be minor (especially in front of a long holiday weekend in the U.S.).

The G-7 communiqué probably disappointed the host nation, Japan.  PM Abe was trying to suggest that the world economy faces similar risk issues as seen in 2008.  The other six members of the group clearly disagreed.  We suspect Abe will use his outlook expressed at this meeting to deploy fiscal stimulation with the hope that the action will depreciate the JPY.  He would have likely preferred G-7 support but we expect him to move without it.

For those calling for a rate hike, the Atlanta FRB GDPNow forecast suggests strong support.

The current forecast is up to 2.9% compared to the consensus forecast of 2.4% and the initial forecast of 1.8%.  The contributions to GDP are clearly coming from consumption, which accounts for 2.46% of the 2.90%.  Residential investment is adding 28 bps (up from 8 bps in late April) and net exports is actually a positive contributor.  The primary drags on growth are inventory liquidation and commercial building.

5-27-16 daily2

Overall, this forecast will increase the odds of a summer rate increase by the FOMC.

View the complete PDF