

Daily Comment (June 6, 2016)
by Bill O’Grady and Kaisa Stucke
[Posted: 9:30 AM EDT] The big news for today is Chair Yellen’s speech at 12:30 EDT today in Philadelphia. This talk has been widely anticipated but will get even more attention following the much weaker than expected employment report for May, which was released last Friday. Jon Hilsenrath of the WSJ is reporting that officials will likely not move rates this month but that July is still likely. We expect Yellen to downplay a hike this month as well, but don’t be surprised if she tries to argue that July is still a possibility. A good central banker always wants to keep her options open and this usually means being as non-committal as possible. Thus, we would be very surprised if Yellen is clear on anything.
In Friday’s market action, the initial shock of the data led to a major drop in interest rates and weaker equities. However, the latter rallied as the day wore on. The most pronounced move though was in the dollar, which weakened considerably. The weaker dollar led to a smart rally in commodities which continues this morning although weather is helping. Summer is clearly coming to the Midwest, with rising temperatures forecast; this is boosting grain prices this morning. And, TS Colin is making its way through the Gulf of Mexico, which could disrupt oil imports and offshore oil and gas production.
The other concern this morning is that the most recent polls suggest that the “leave” voters are gaining momentum in the U.K. The GBP declined on the news. We are viewing the Brexit vote as a potential reflection of the November presidential elections. It is likely that the same voting sentiment that would prompt the exit from the EU would also support the policy stance of Donald Trump. Although Trump has been sliding in the polls recently, we still expect this to be a tight race and that other surprises may be in the offing this year.
Because Friday’s employment report was such a shocker, we wanted to offer a few reflections on the data. First, the decline in the non-farm payroll number and the labor force was probably exaggerated by seasonal factors. The chart below shows the monthly change in the non-farm payroll numbers, with the series in red showing the seasonally adjusted change and the lower dots showing the raw data without seasonal adjustments. Note that the seasonally adjusted data show a mere rise of 38k; however the non-seasonally adjusted data is up 651k. This recent non-seasonally adjusted number is well below the past four years, which have averaged 891k. So, this year’s change is well below previous years.
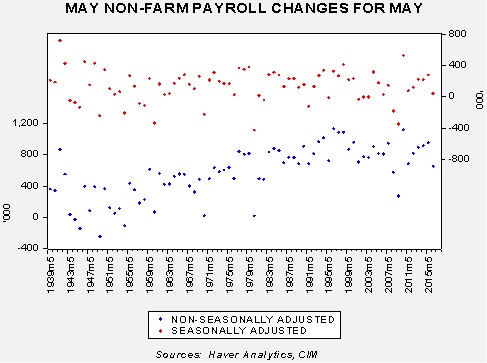
Some of the drop in May could be due to a rather strong March.
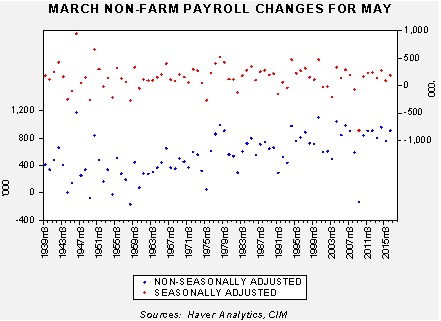
Over the past four years, March non-seasonally adjusted payrolls rose 854k; this year they rose 903k, most likely due to mild weather.
Something similar occurred with the labor force.
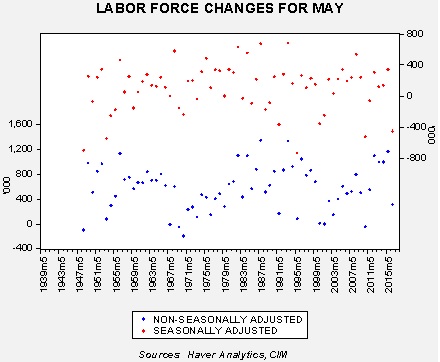
The actual data showed a 312k rise in the labor force; however, for the past four years, the labor force has increased by 1.062 mm, leading the seasonal adjustment process to signal a major contraction in the labor force. It is worth noting, though, that the data in the last decade tended to see smaller increases in the labor force than seen post-recession.
Some observations…the weakness seen in May is real; it isn’t solely due to seasonal factors. But seasonal factors did contribute to the weakness. It is also important to note that the raw data show long term shifts over time. For example, the May and March non-farm payroll data show a steady increase over time. Some of this may be due to population expansion but it may also signal less seasonality overall. The May labor force data, unadjusted, is remarkably volatile and thus the real question may be whether the past four years reflect a “normal” increase in the labor force in May or if the data in the last decade are more “normal” and the last four years are unusual. If the latter is the case, the Bureau of Labor Statistics probably overstated the degree of contraction in the labor force. What can we expect for June? For the past four years, the non-seasonally adjusted change averaged 455k, meaning that for June we have a somewhat smaller hurdle to overcome.
We want to close the discussion with this chart.
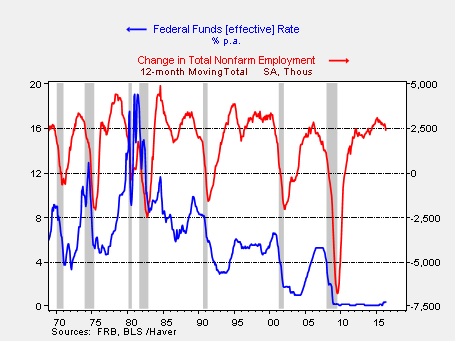
It shows the rolling 12-month sum of the changes in non-farm payrolls along with the effective fed funds rate. Since the early 1980s, most tightening cycles occur when the 12-month payrolls are rising by 2.5 mm. About the only exception was the 2004-06 tightening cycle, which began with yearly payrolls growing below this level but on their way to the 2.5 mm growth area. The fact that this cycle rose “early” suggests that Greenspan probably believed that the 1% fed funds target of that era was artificially low. To a great extent, this relationship suggests the Fed waited too long to raise rates and missed its opportunity. On the other hand, if tightening began in December 2014 as tapering began (which we would argue is probably the case), then the tightening occurred in line with historical patterns. At the same time, this pattern would suggest the tightening cycle should probably be ending, not beginning. Finally, on a side note, a drop below 1.5 mm usually signals recession. We are above that level.