by Bill O’Grady and Kaisa Stucke
[Posted: 9:30 AM EDT] The last eight years have been full of unusual events. We have seen ZIRP, NIRP, QE of all stripes, massive increases in central bank balance sheets, collapses in monetary multipliers, low inflation, consistently wrong forecasts of higher interest rates, massive borrowing in China, flash crashes, commodity volatility and so on. Through it all, there has been an underlying expectation that, someday, conditions will return to normal. Instead, oddities persist.
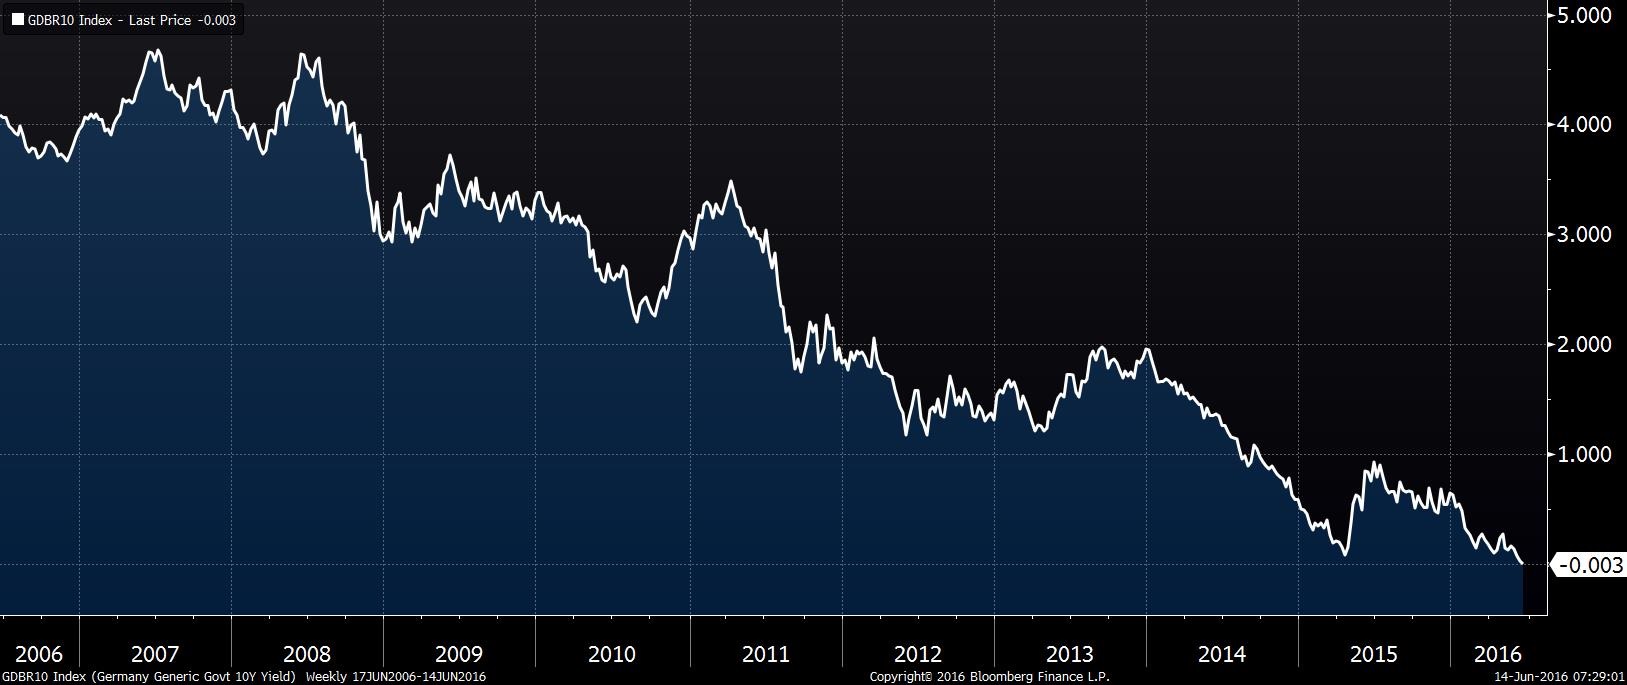
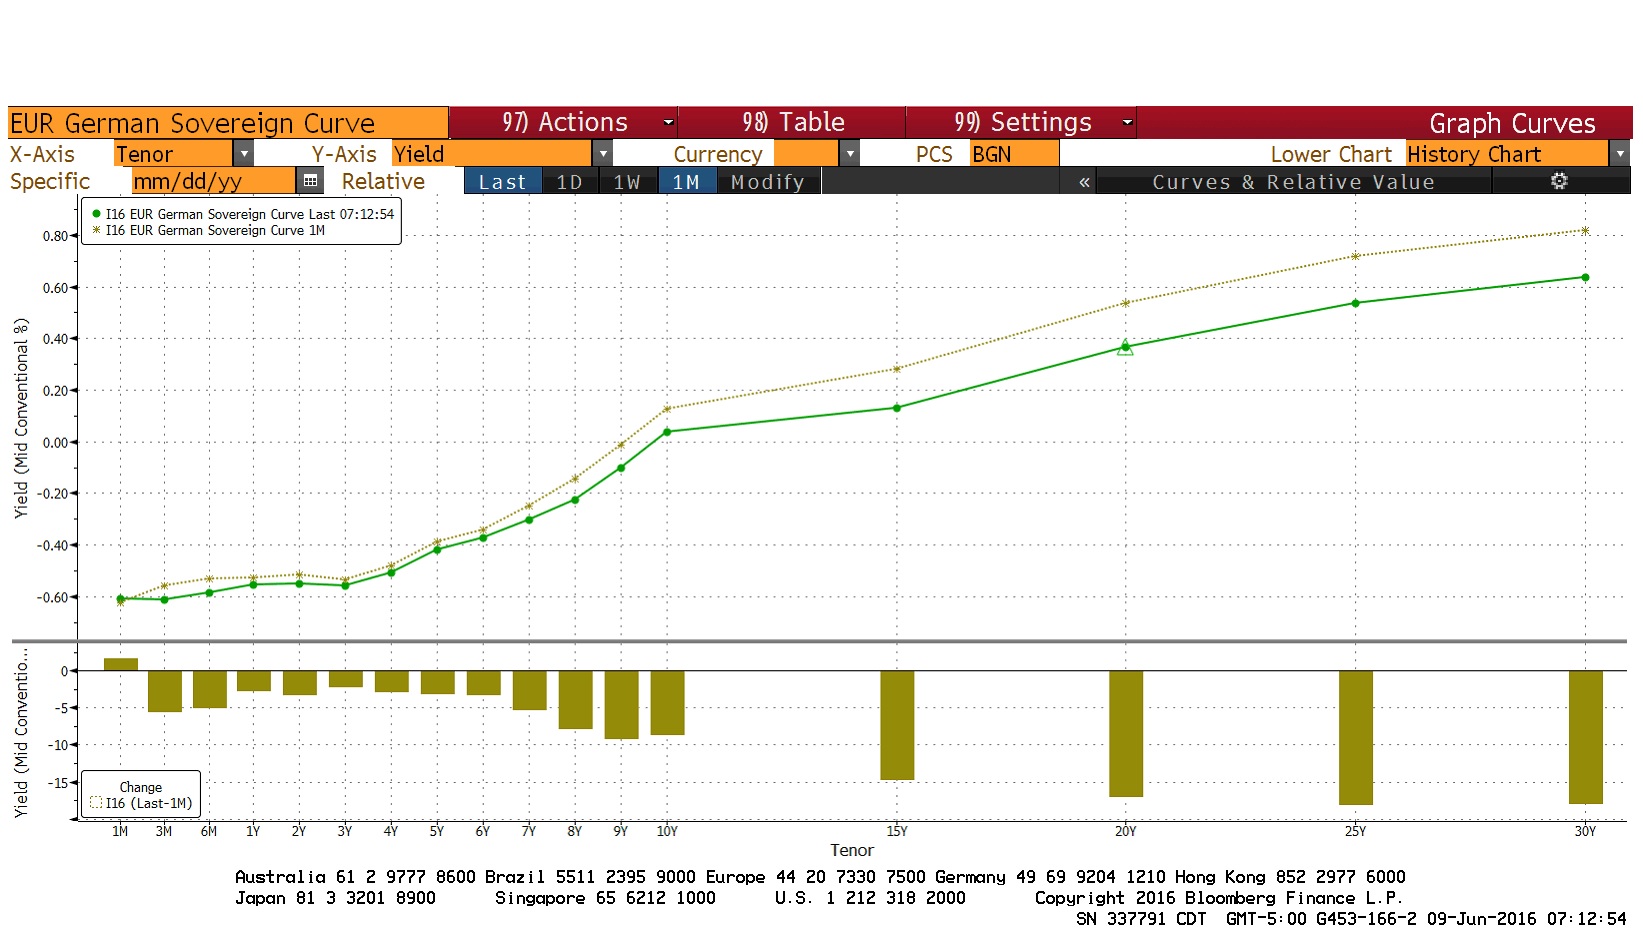
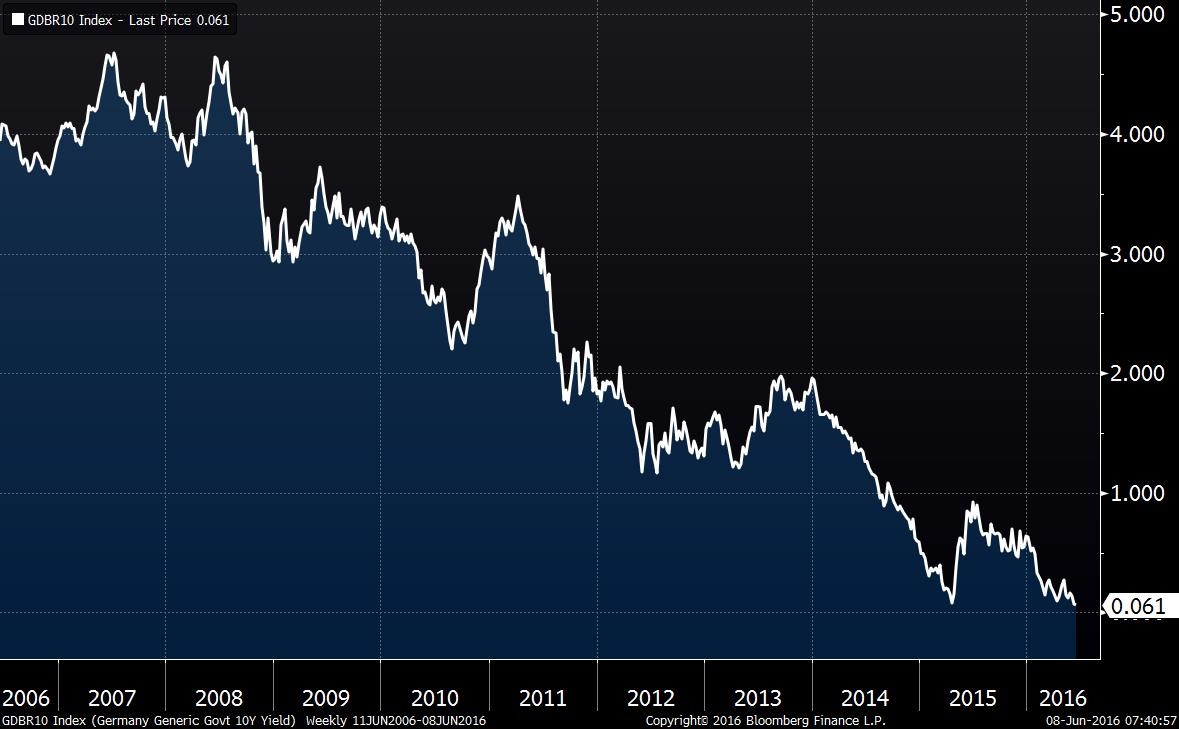
Today’s new “never thought I would ever see that” is the Swiss 30-year sovereign reaching a negative yield. Although it has popped back up above zero, it is amazing that nearly all of a nation’s yield curve is under zero.
 (Source: Bloomberg)
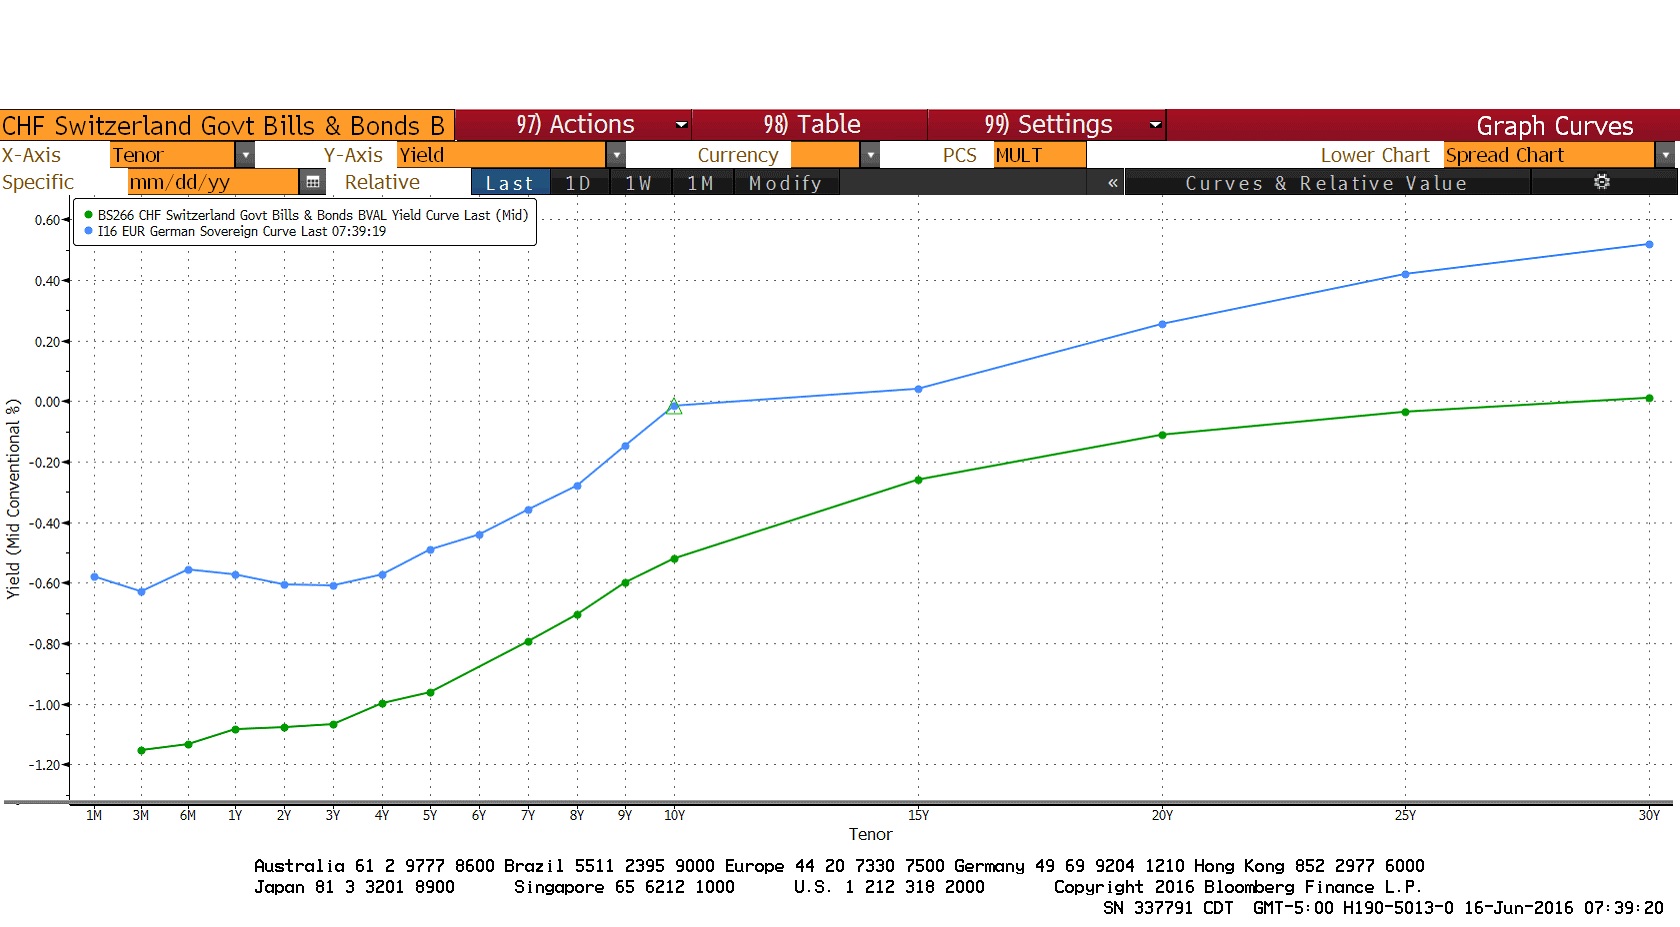
The blue line is the German sovereign yield curve and the green line is the Swiss sovereign yield curve. Germany can borrow at a negative rate for 10 years; as noted, the Swiss can now do this for three decades. Clearly, Brexit worries are part of this trend.
The BOJ also met this morning and as expected, did nothing, although it did warn against Brexit. We are seeing massive flight-to-safety activity with the JPY soaring this morning. Of course, part of the Japanese currency strength is due to the BOJ standing pat at today’s policy meeting. Although most economists didn’t expect anything, it is hard to imagine that Japanese officials will continue to allow the JPY to strengthen without reacting at some point.
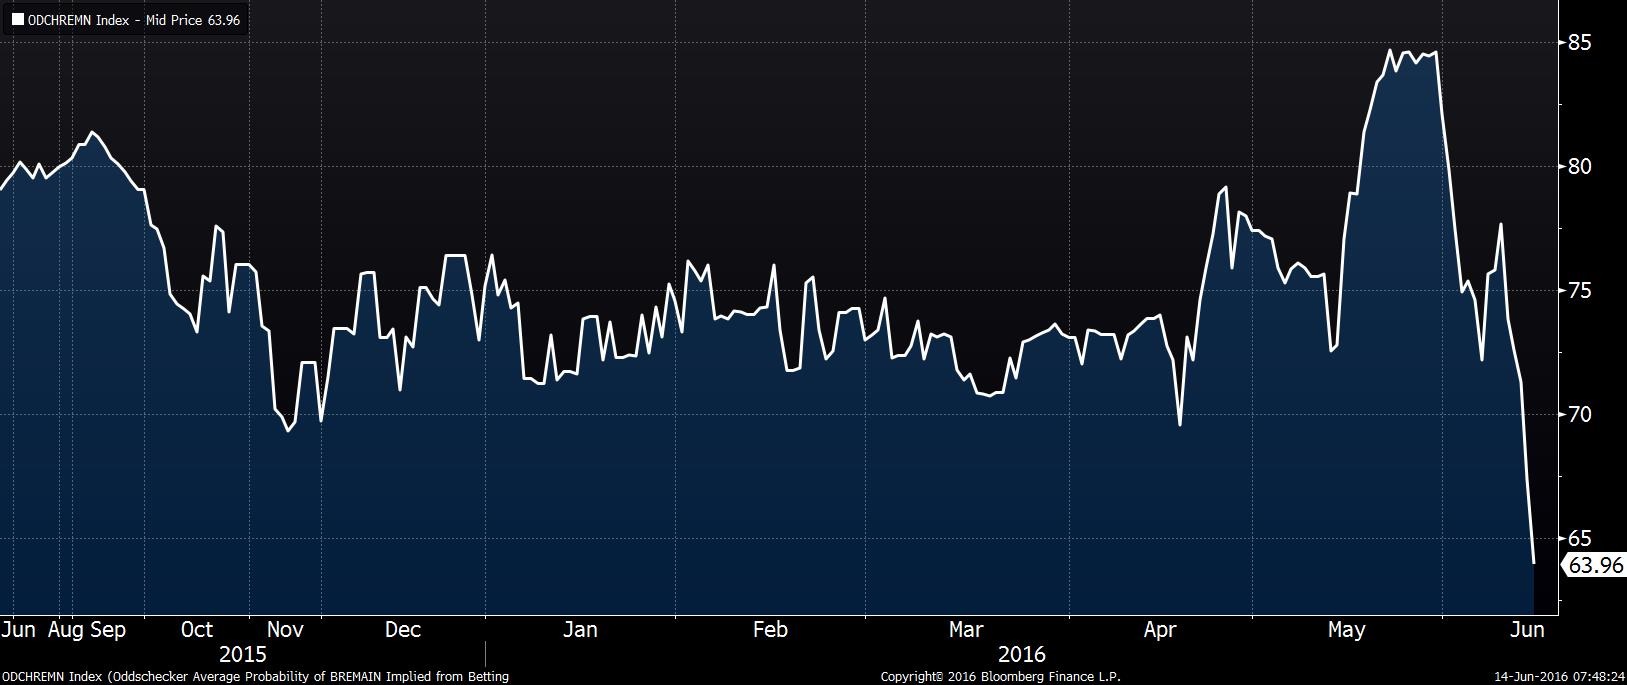
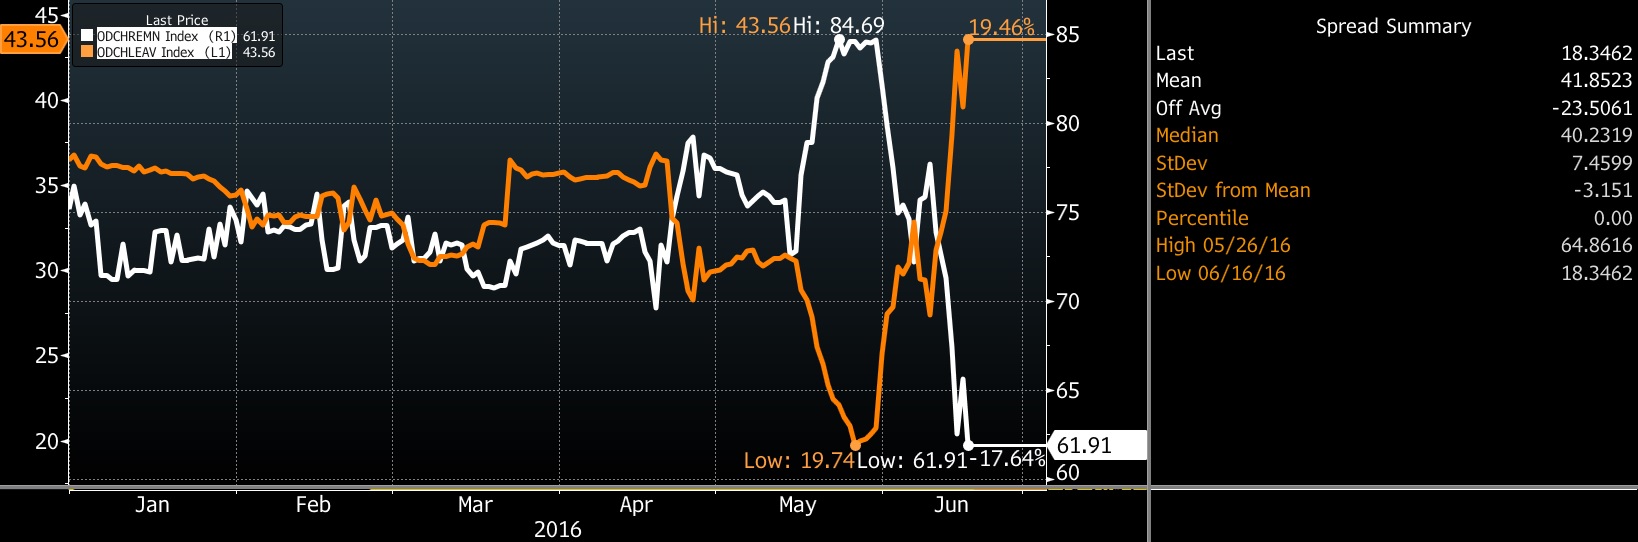
Although worries are high, we note that the betting pools are still signaling that the U.K. will stay in the EU.
 (Source: Bloomberg)
This chart shows the average from the wagering sites, with the white line representing the “remain” bet, the orange line the “exit” bet. The white line is read off the right scale, the orange on the left scale. The remain bet stands at nearly 62% a week before the vote, but clearly, the trend is worrisome.
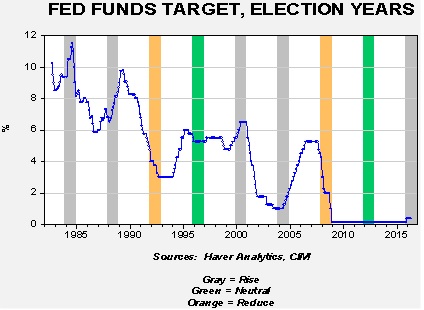
The June Fed meeting occurred yesterday and although expectations for a change in policy were virtually nil, the FOMC managed to give the meeting a dovish tone. The statement was mixed; the committee acknowledged that the labor markets have softened but did note the overall economy is doing fairly well, citing the housing market and net exports as improving, but showing concern about business investment. About the most important note was that KC FRB President George, a constant dissenter, agreed with the majority this time. It really isn’t clear why she decided not to call for higher rates; perhaps international issues played a role, or the weak labor market data.
The dots chart was decidedly dovish.
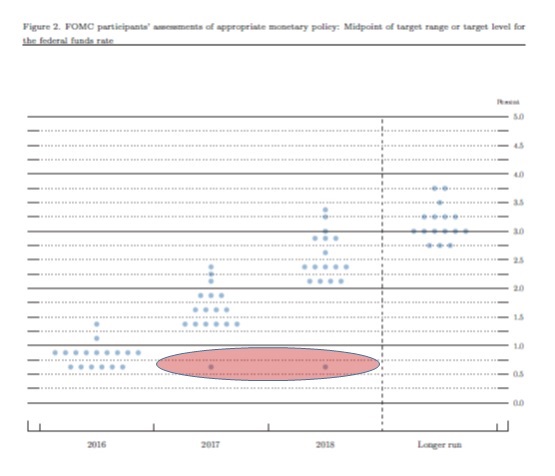
The newest parlor game among strategists is “who thinks rates should stay at 0.875% for the next two years?” The most common guess is Governor Lael Brainard, although it could be Boston FRB president Rosengren or Chicago FRB President Evans. In any case, those outliers are clearly catching everyone’s attention. It is also worth noting that six members are projecting a single rate hike this year and only two expect more than two hikes. In March, only one member called for one hike, nine voted for two hikes, and seven wanted three or more.
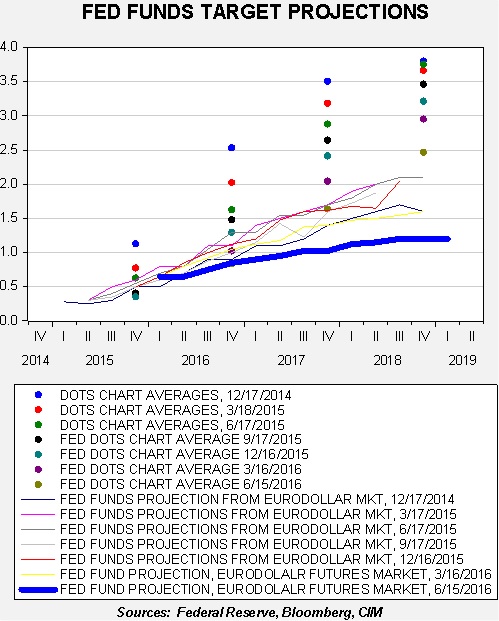
The dots average continues to decline toward the Eurodollar futures market projections. Inflation projections remain steady, so it does appear that the FOMC will tolerate a bit higher than target inflation at some point.
There are two takeaways from the Fed meeting. First, the dollar weakened after the statement and this will put pressure on other central bankers to ease further and prevent their currencies from strengthening. Second, it looks like the Fed may only raise rates once this year, if at all. There were no measures taken to signal a July hike meaning that if the employment data for June, released in early July, show that the May data was a fluke, the FOMC has not prepared the market for a move. This would suggest they FOMC does not expect the data to be revised or reversed. Overall, the statement was clearly bearish for the dollar, bullish for Treasuries while equities failed to respond positively to the decision. Overall, we do view a steady Fed as supportive for equities but it’s likely that stocks have already discounted that outcome.
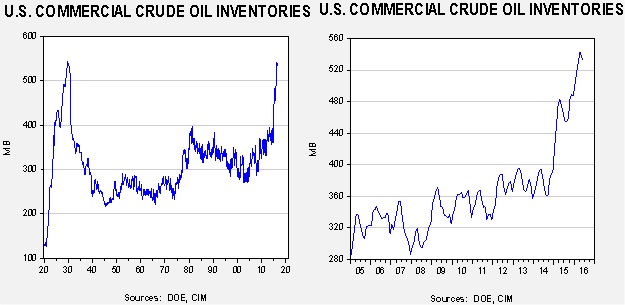
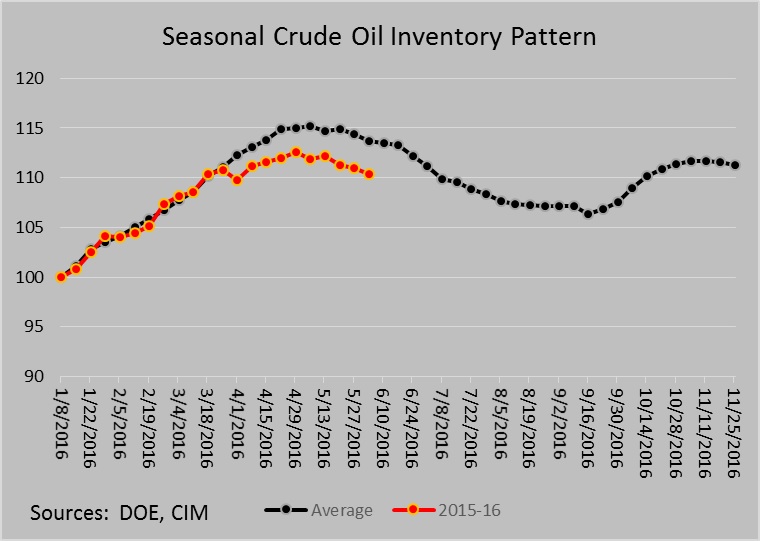
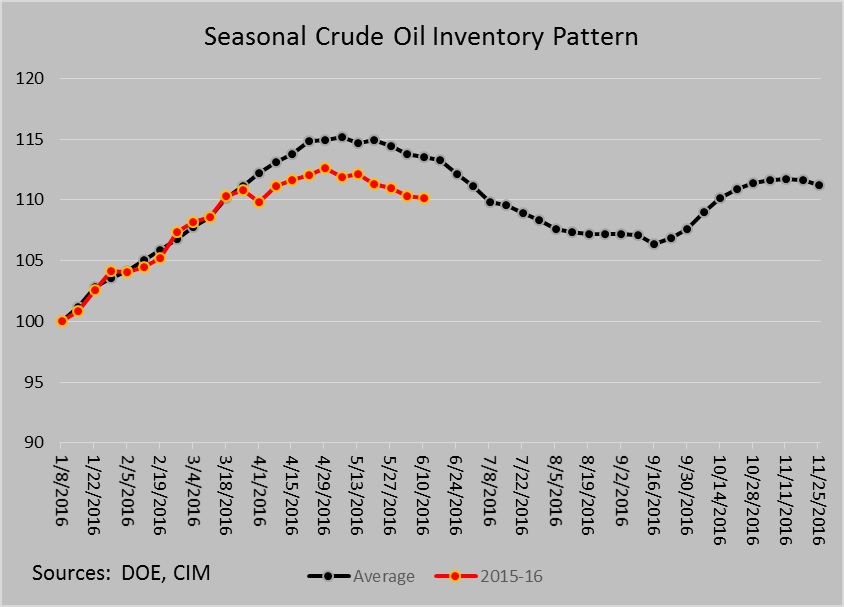
The U.S. crude oil inventories fell mostly in line with expectations; stockpiles fell 0.9 mb to 531.5 mb compared to estimates of a 2.6 mb decline.
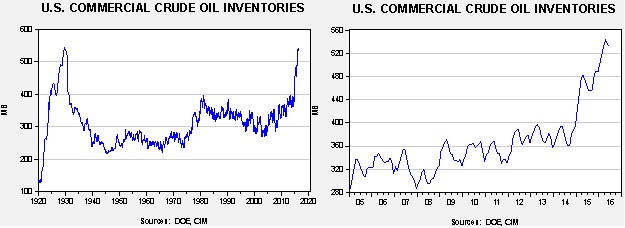
This chart shows current crude oil inventories over the long-term and over the last decade. We are starting to see inventories decline but normal levels would be below 400 mb, some 130 mb lower than now.
So obviously, inventories remain elevated. But, inventories are clearly lagging the usual seasonal pattern and we are on a declining path. We are running about a month ahead of the normal seasonal decline.
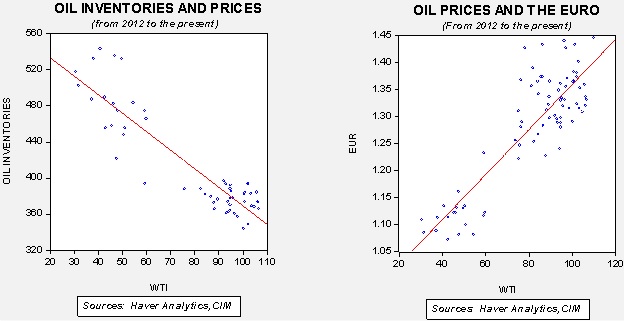
It is important to remember that the dollar is playing a bigger role in determining oil prices.
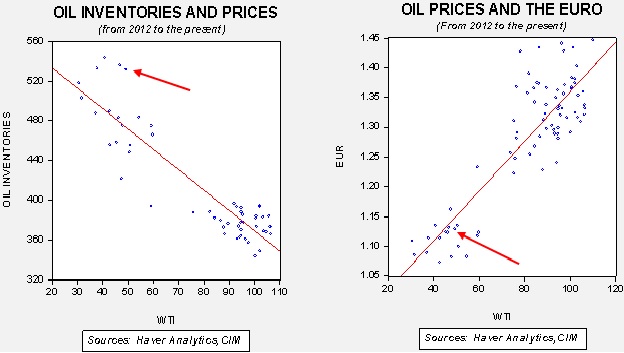
Based on inventories alone, oil prices are profoundly overvalued with the fair value price of $31.32. Meanwhile, the EUR/WTI model generates a fair value of $51.21. Together (which is a more sound methodology) fair value is $42.08, meaning that current prices are a bit rich. The dovish Fed meeting, discussed above, should be considered bullish for the EUR and thus supportive for oil prices.