Daily Comment (August 18, 2016)

by Bill O’Grady and Kaisa Stucke

[Posted: 9:30 AM EDT] The FOMC minutes offered a short period of market volatility; the initial reaction was hawkish but that faded rather quickly.  After reading the full report, it appears that the majority of members believe that:

  1. International events will continue to act as a drag on inflation and economic growth;
  2. Inflation will eventually reach target, while a notable minority believe that it won’t reach its target for the foreseeable future. This is important because there isn’t a reported hawkish faction pressing for tightening.  The lack of reported inflation-fearing members suggests that the single dissenter, KC FRB President George, isn’t worried enough about future inflation to warrant a rate move;
  3. They will have ample time to react to a rise in inflation and seem to be taking the position of Chicago FRB President Evans that the FOMC should wait until it sees the “whites of the eyes” of inflation before moving.

Overall, despite recent comments that September is “live,” the fact is that the risks of raising rates are thought to be greater than the risks of keeping policy accommodative.  Thus, the minutes suggest policy will remain steady for the foreseeable future.  Neil Irwin of the NYT suggests in an article today that the FOMC lacks the framework for monetary policy.  We also suspect that is the case.  Recently, St. Louis FRB President Bullard suggested the Fed should base policy on “regimes,” which seem to be medium-term conditions, and adjust when regimes change.  San Francisco FRB President Williams appears to be focusing on the steady drop in the term premium and is calling for a higher inflation target.  As we have noted before, by any measure of the Phillips Curve, the Fed should be raising rates aggressively.  The fact that it is not moving rates suggests the Fed really doesn’t have an idea what is presently driving policy.

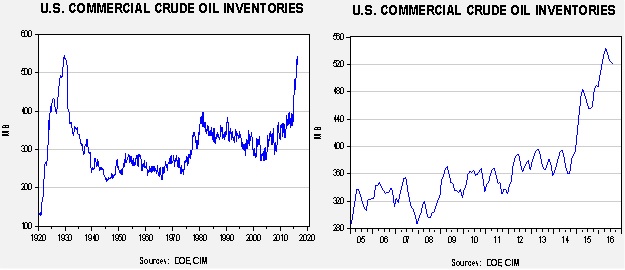
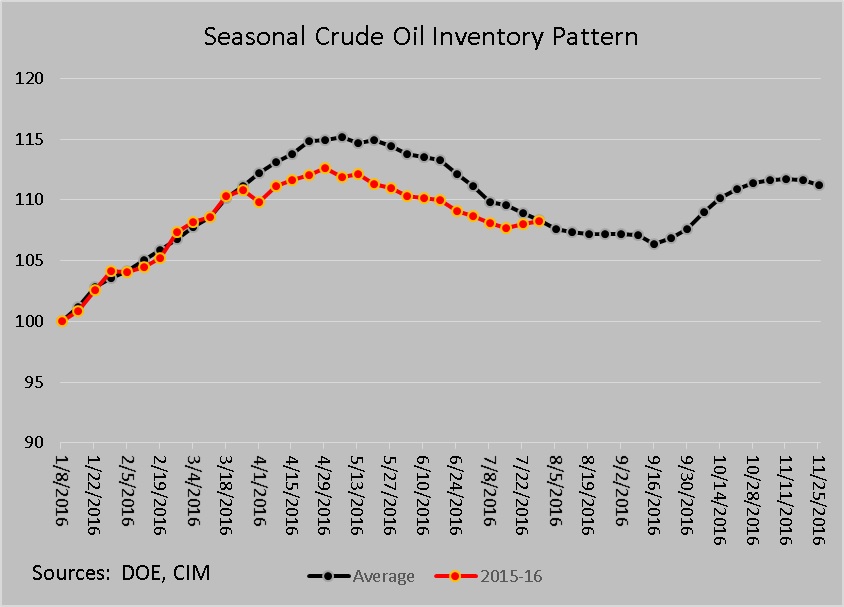
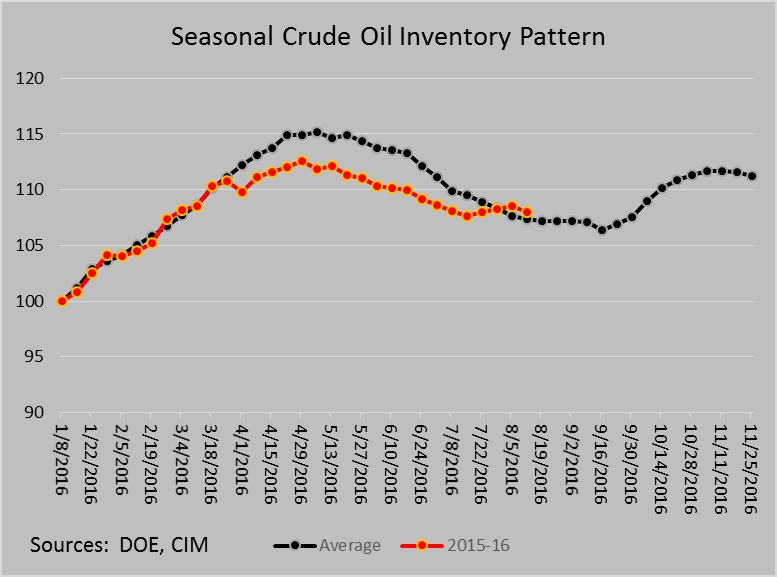
U.S. crude oil inventories fell 2.5 mb compared to market expectations for a 0.3 mb build.  This chart shows current crude oil inventories, both over the long term and the last decade.  The usual seasonal inventory draws, which are more evident in the chart below, are starting to slow.  So, inventories remain elevated.  Inventory levels have been running below seasonal norms, although the divergence has been narrowing.  It narrowed significantly this week.  We are in a period of the year when crude oil stockpiles tend to fall at a slowing pace; in fact, this month, declines slowed markedly.  Oil prices rose due to a surprise 3.3 mb draw in gasoline stocks.  Although this was clearly bullish for gasoline, the “clock” is running on this product because the summer driving season is rapidly coming to a close.  Still, for an oversold market, it was the catalyst for an impressive rally.

In early July, inventories rose contra-seasonally; this week’s decline puts us back on the normal seasonal path.  This situation is concerning and does suggest we will end this draw season with crude stocks in excess of 500 mb.

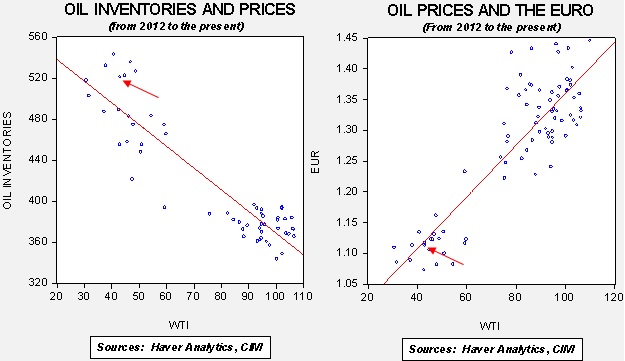
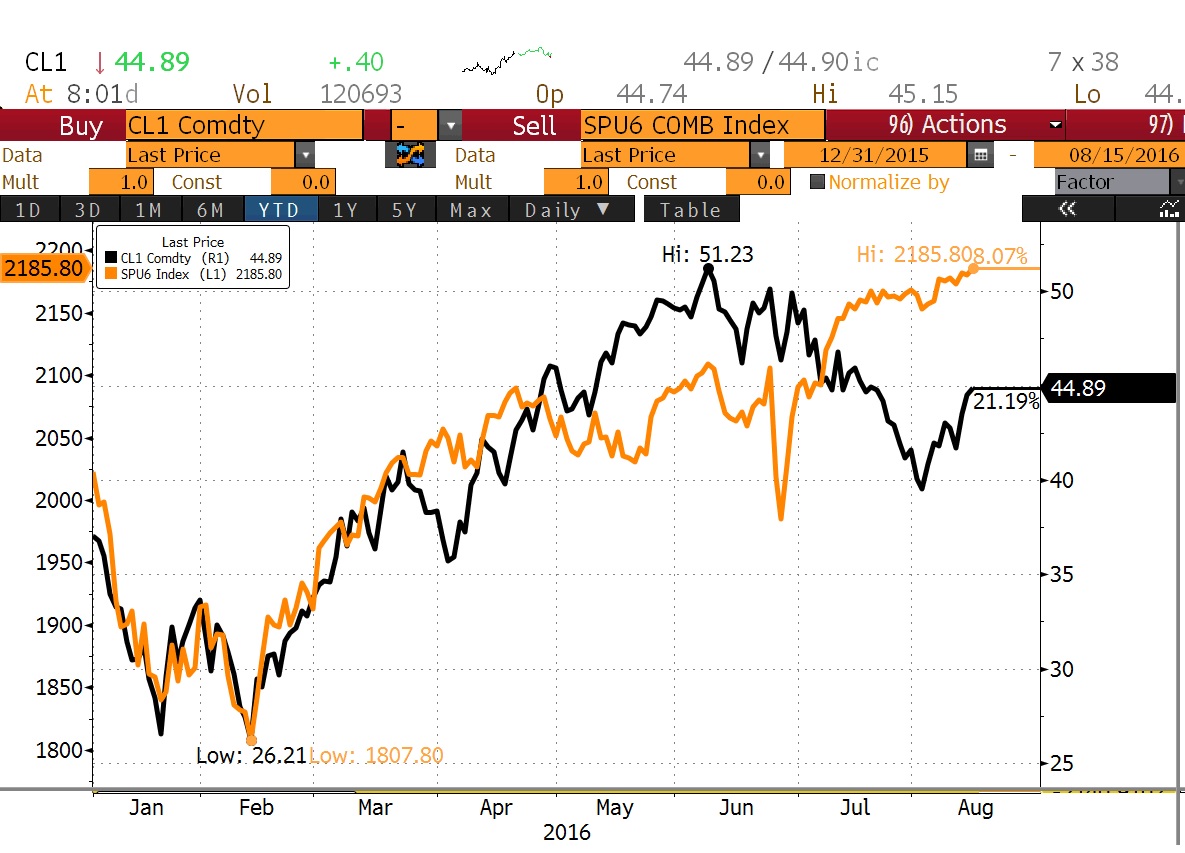
Based on inventories alone, oil prices are profoundly overvalued with the fair value price of $36.52.  Meanwhile, the EUR/WTI model generates a fair value of $48.21.  Together (which is a more sound methodology), fair value is $42.16, meaning that current prices are a bit rich.  Given that we don’t expect significant declines in inventory over the coming weeks, the key to oil prices continues to rest with the dollar.

Although OPEC jawboning is probably to blame for the recent rally, we would be surprised to see any significant action to lift prices much beyond the recent rally.  Reuters reports this morning that it is planning to expand production again this month to a new record level.  If so, the kingdom’s output would exceed Russia’s, making Saudi Arabia the world’s largest producer.  The Saudis appear to be lifting production in front of a proposed output freeze, which would tend to undermine the effectiveness of a freeze to reduce the level of supply overhang in crude oil.

View the complete PDF

Daily Comment (August 17, 2016)

by Bill O’Grady and Kaisa Stucke

[Posted: 9:30 AM EDT] It was another quiet night for news, typical of summer.  The most interesting information came from NY FRB President Dudley and Atlanta FRB President Lockhart, who both suggested that the September Fed meeting (9/20-21) is “live” and the markets are underestimating the odds of a rate hike.  So far, the markets are unimpressed.  The dollar is a bit higher this morning but has been weak lately; if a rate hike were imminent, we would be seeing the dollar doing much better.

One factor that could be spurring this rate move talk is evidence of improving economic conditions.  The Atlanta FRB GDPNow tracker is showing that Q3 could be very strong.

The current “nowcast” from the Atlanta FRB is 3.6% GDP, at the upper end of the Blue Chip consensus.

As we saw in Q2, consumption remains robust; based on the available data, it is adding 242 bps to the 3.6% rise in GDP.  Also note that inventory rebuilding, which cut GDP last quarter by 116 bps, is lifting GDP by 75 bps this quarter.  Government, which reduced Q2 GDP by 16 bps in Q2, is expected to add 32 bps to Q3 growth.  Also, a lift in equipment investment, which reduced GDP by 21 bps in Q2, is expected to lift growth by 43 bps in Q3.  Net exports are the largest drag on growth, cutting GDP by 45 bps so far.

If GDP comes in this strong, the argument for raising rates will be on solid ground.  On the other hand, raising rates into an election year, though not unprecedented, would be institutionally difficult in this election cycle where populist sentiment is strong.  If the Fed is going to move rates higher before the election, September may be the only live meeting; the next opportunity may not present itself until December.  This morning, fed funds futures have the odds of a rate hike exceeding 50% at the February 1, 2017 meeting.

Oil prices have rallied strongly over the past few days on comments from Saudi Arabia and others suggesting an output freeze may be coming.  We view this as mostly jawboning the market.  Saudi Arabian production is elevated and so freezing output at current levels would be acceptable to the kingdom.  However, we doubt it would participate in a freeze and allow Iran to capture market share.  Nevertheless, the oral intervention does indicate that Saudi Arabia is probably trying to establish a trading range with $40 (basis WTI) at the low.  The problem is that the overhang of crude supplies remains high and we are heading into a weak seasonal period for oil as the end of the vacation season comes on Labor Day.  The vigorous nature of the bounce has all the characteristics of short covering; if that buying is exhausted and the traders return their focus to inventory levels and the end of summer driving demand, a retest of the $40 level would not be a surprise.  We will have more on oil tomorrow when we recap the inventory data.

View the complete PDF

Daily Comment (August 16, 2016)

by Bill O’Grady and Kaisa Stucke

[Posted: 9:30 AM EDT] Risk markets are mixed today in the midst of relatively thin global trading volumes.  The dollar continued to slide lower amidst lower expectations for a Fed hike.  The chart below shows the year-to-date move in the dollar, which has given back the gains it made due to uncertainty from the Brexit vote.  Minutes from the FOMC’s most recent meeting in July will be released tomorrow and will provide more color on the Fed’s view of the strength of the economy.

(Source: Bloomberg)

At the same time, emerging market currencies have moved higher as milder expectations for a Fed hike support emerging market equities.  The chart below shows the MSCI Emerging Market Currency Index since the beginning of the year.

(Source: Bloomberg)

Yesterday, the June TIC portfolio flows data was released.  The long-term flows, which mostly mean Treasuries, declined $3.6 bn, much weaker than the $42.0 bn forecast.  Including short-term securities such as stock swaps, foreigners sold a net of $202.8 bn compared with net selling of $11.0 bn the previous month.  The data signals that global investing uncertainty has diminished somewhat as fewer investors sought the safety of U.S. stocks.

View the complete PDF

Weekly Geopolitical Report – Thinking about Thinking: Part I (August 15, 2016)

by Bill O’Grady

We are in the “dog days” of summer.  The world is in turmoil.  The U.S. presidential elections offer us a stark choice between a traditional establishment candidate and a populist alternative.  Populism is on the rise in Europe, exhibited by the Brexit vote.  Lone wolf terrorist attacks seem to occur with frightening regularity.  China is threatening the U.S.-dominated maritime order of the past seven decades.

Perhaps most disconcerting is that there seems to be a steady dissonance of viewpoints.  I often hear comments like, “how can a person think like that?”  The internet, for all its power, has been creating virtual thought islands.  Essentially, people can tailor their reading and information sources to fit their biases and rarely confront other viewpoints.  And, when confronted with other viewpoints, people seem to be at a loss on how to hold a civil discussion on these differences or have the tools to understand positions that vary from their own.

Last spring, my youngest son took his first philosophy course.  He was exposed to the classic thinkers in the Western canon, including Plato, Descartes, Kant, Nietzsche and others.  We had long discussions about these thinkers, harkening me back to my Jesuit philosophical training of more than 30 years ago.  Our talks forced me to revisit these philosophic issues with three decades of additional experiences.  As I thought about these issues, I was absorbed by the relevance of these philosophic questions to our current economic, social, political and geopolitical conditions.

In this week’s report, we will take a detour from our usual analysis of specific global events to a broader analysis of knowledge.  Part 1 of this report will offer a short course on the basics of knowledge, focusing on an examination of the three types of knowledge statements.  We will then discuss the strengths and weaknesses of all three and how philosophers have tried to resolve the dilemmas that they posed.  Next week, in Part II, we will discuss how one uses this information, concentrating on the idea that it is important to match appropriate ways of knowing to the areas we are examining.

These reports will be a bit more personal and academic than most, but given the divergence of opinion in the world now, I believe this analysis can be useful to investors approaching information and positions that differ from their own.

View the full report

Daily Comment (August 15, 2016)

by Bill O’Grady and Kaisa Stucke

[Posted: 9:30 AM EDT] Equities are moving higher alongside oil as the outlook for a Fed rate hike has become more dovish.  The market-implied likelihood of a September hike fell to 18.0% this morning.  However, despite very short-term expectations falling, the probability of a hike has risen for next year.  The likelihood moved to over 50% by March 2017, up from a 50% likelihood in May before last Friday’s retail sales and PPI data.

The chart below shows the year-to-date prices of the S&P index and WTI crude.  In the first four months of the year, the moves in equities and oil were highly correlated.  However, the high correlation has broken down since June as attention turns to central bank policies and political uncertainty.

(Source: Bloomberg)

Japanese GDP came in lower than forecast (see below).  The details of the report revealed declining net exports and a drop in business investment.  However, consumption was stronger than anticipated.  The chart below shows the country’s year-over-year GDP growth.  Growth has trended lower, but market expectations are still calling for the BOJ to keep monetary stimulus unchanged when they meet next month.

View the complete PDF

Asset Allocation Weekly (August 12, 2016)

by Asset Allocation Committee

We originally published the comments below in our Daily Comment on July 27.  However, we have received a number of questions on the widening of the TED spread and the rise in LIBOR to warrant updating the report for this week’s Asset Allocation Weekly.

There has been some curious behavior in the LIBOR markets recently.  Although expectations of Fed tightening are benign, LIBOR rates have been ticking up.

(Source: Bloomberg)

This chart shows three-month USD LIBOR.  Note that over the past month, the rate has moved up around nearly 20 bps.  Usually, such moves occur for one of the following reasons: (a) the Fed is raising rates, or (b) there is a systematic financial system problem developing, leading investors to flee the LIBOR market for sovereigns.  The second case is one of the reasons for monitoring the TED (T-bills vs. Eurodollar) spreads.

The TED spread has been rising and is near levels seen during the last Eurozone crisis.  Although this increase warrants watching, putting the recent rise in context does suggest that this move, thus far, isn’t a signal of a major problem brewing.

(Source: Bloomberg)

Just compare the above chart to the long-term TED.

(Source: Bloomberg)

Note how LIBOR rates spiked in 2008 and were “spikey” from mid-2007 through 2008.  That is a more classic example of the flight to safety element of the TED spread.  We are not seeing that now.

So, why the rise in rates?  It’s entirely due to regulations on money market funds (MMFs).  On October 14, prime money market funds will see their statutory maximum weighted average maturity fall from 90 to 60 days.  In addition, institutional MMFs will be forced to institute a floating NAV and can put up “gates” to slow withdrawals during crises.  We are already seeing the impact.

Assets in prime MMFs have declined about $500 bn and government funds have risen by about the same amount since December.  Prime MMFs now represent 35% of total MMFs, down from 53% last October.  The total assets in MMFs are about the same but the allocation has shifted from prime to government MMFs, which don’t face the same restrictions.  We expect further shifts as investors begin to realize that a prime MMF isn’t “cash.”

Here are some potential market effects:

The dollar could rise.  The rise in USD LIBOR hasn’t been matched by a similar rise in EUR LIBOR.  All else held equal, the higher yield should support dollar buying.

Commercial paper markets will be adversely affected.  Prime MMFs buy commercial paper.  As funds shift to government funds, the money available to buy commercial paper will decline, boosting funding costs to commercial paper issuers.

A secular change in the TED spread is likely.  In general, investors discount the odds of a problem in the financial markets when they buy LIBOR-based paper.  With the rules on prime MMFs changing, the risk calculation will change, which should permanently shift the spread wider.  It is important for investors to realize that the TED isn’t necessarily signaling a financial system problem during this reset.

The rise in LIBOR and the dollar could be a bearish factor for commodities.  If the regulatory change acts as a de facto monetary policy tightening and isn’t offset by the Fed, we may see some weakness develop in commodities.  The primary driver of this will be the dollar.

Overall, investors will need to consult with their MMF providers and their financial advisors to determine which MMF is appropriate for them.  The issue really is what the function of the MMF is in the portfolio; if it is truly cash, then the government funds might be preferred.  If it is for yield, then one needs to realize that a prime MMF will likely lose its cash-like characteristics during financial crises and one could find that there will be a delay in tapping a prime MMF if financial conditions deteriorate.  Although retail investors in prime MMFs should not “break the buck,” that may not provide much comfort as the potential restrictions on withdrawals remain in place.

View the PDF

Daily Comment (August 12, 2016)

by Bill O’Grady and Kaisa Stucke

[Posted: 9:30 AM EDT] Eurozone economic growth came in on forecast, rising 1.6% annually.  While growth remains subdued, Q2 marked the 13th consecutive quarter of expansion.  German GDP came in better than expected, rising 3.1% annually compared to the 2.8% forecast.  At the same time, Italy’s growth disappointed, coming in below expectations (see below).  The chart below shows the Eurozone’s annual GDP growth.  The trend has been positive recently on strengthening consumption and robust trade numbers.  However, going forward, the uncertainty stemming from Brexit is expected to weigh on industrial production and exports.

The British pound has declined further over the past two weeks, reclaiming its position as the worst performing global currency in 2016 (yes, weaker year-to-date than the Argentine peso!).  The chart below shows the pound’s performance since the beginning of the year.  The currency plunged immediately following the Brexit vote and has continued to trend lower ever since, as the Bank of England restarted its stimulus program.

(Source: Bloomberg)

The chart below shows the GBP/USD exchange rate over the past three decades.  We have highlighted two major depreciations, the 1992 exit from the European Monetary System and the Great Financial Crisis.  Both events caused about a 30% decline in the currency.  So far, we are down 12.9% following the Brexit vote.  If history is any guide, the currency could trend lower from here.

(Source: Bloomberg)

View the complete PDF

Daily Comment (August 11, 2016)

by Bill O’Grady and Kaisa Stucke

[Posted: 9:30 AM EDT] European stocks advanced this morning alongside oil after the International Energy Agency (IEA) said it expects the global oil market to improve.  In its monthly report, the agency said it expects increasing refining to draw down the ample crude stockpiles, despite some large OPEC producers pumping oil at a record rate this summer.  However, the agency expects global production to decline to levels below demand as we head into autumn, which would eventually lead to a more balanced oil market.  The report comes a day after OPEC announced that the group’s largest producers had failed to agree on production cuts.  Production is unlikely to fall until this happens.  Additionally, the IEA’s projections rely on improving product demand, which is also seasonally unlikely as we exit the summer driving season.  Moreover, refining margins have declined over the past month and refiners are likely to wait for improving margins before their demand for crude picks up.  Thus, given the current circumstances, we would not expect short-term demand improvements.

Yesterday, the JOLTS report showed a rise in job openings in June.  Openings rose to 5,624 from 5,514 the month before, but fell short of the 5,675 level expected.  The largest percentage of job opening increases occurred in health care and social services, followed closely by professional and business services.  The chart below shows the total level of private job openings.

Hiring rose, which is good news for the labor market.  The chart below shows total private hires, which improved after two months of declines.

Although hires improved in June, hiring has remained well below job openings, with the ratio of hires to openings steadily trending lower as shown by the chart below.  The difference between the number of openings and hiring may simply be due to the lack of wage growth, although we suspect it is a combination of skills mismatch and lack of mobility that is probably causing most of the problem.

View the complete PDF

Daily Comment (August 10, 2016)

by Bill O’Grady and Kaisa Stucke

[Posted: 9:30 AM EDT] The dollar fell overnight as the market adjusted its expectations lower for a rate hike.  The market-implied probability of a Fed rate hike in September is 22%, and the likelihood reaches 52% in May 2017.  The yields on 10- and 30-year U.K. bonds fell to record lows after the Bank of England indicated it will continue with its uncovered QE operations as planned.

According to reports, Saudi Arabia pumped oil at a record level of 10.67 mmbpd in July.  Production surpassed the previous record monthly production of 10.56 mmbpd in June 2015.  The rise in production was said to stem from increased domestic demand.  At the same time, major OPEC producers met in Doha on Monday to discuss options for stabilizing the market, mostly by imposing caps on output.  Saudi Arabia’s position has been that the country will not agree to production caps unless Iran also imposes caps on its production.  However, Iran has refused to cap production as it recovers its exports after sanctions were lifted.

In a separate monthly report, OPEC warned that weakness in the oil markets is likely to persist as supplies remain high and the end of the summer driving season comes to an end, leading to a possible downward correction in prices.  The chart below shows domestic crude inventory patterns.  Although domestic stockpiles did not see the usual accumulation “hump” during the summer, we are now at seasonally average levels.

Refining margins have been squeezed recently due to a high level of product inventories, which means that refiners’ demand for crude could fall.

Palladium prices reached their year high on the back of strong Chinese car sales and supply concerns from Russia and South Africa.  The metal is up 37% since its most recent low in June.  The chart below shows the metal’s price over the past year.  Palladium’s gains are also supporting the rest of the precious metals complex, especially platinum.

(Source: Bloomberg)

View the complete PDF