Asset Allocation Weekly (October 21, 2016)

by Asset Allocation Committee

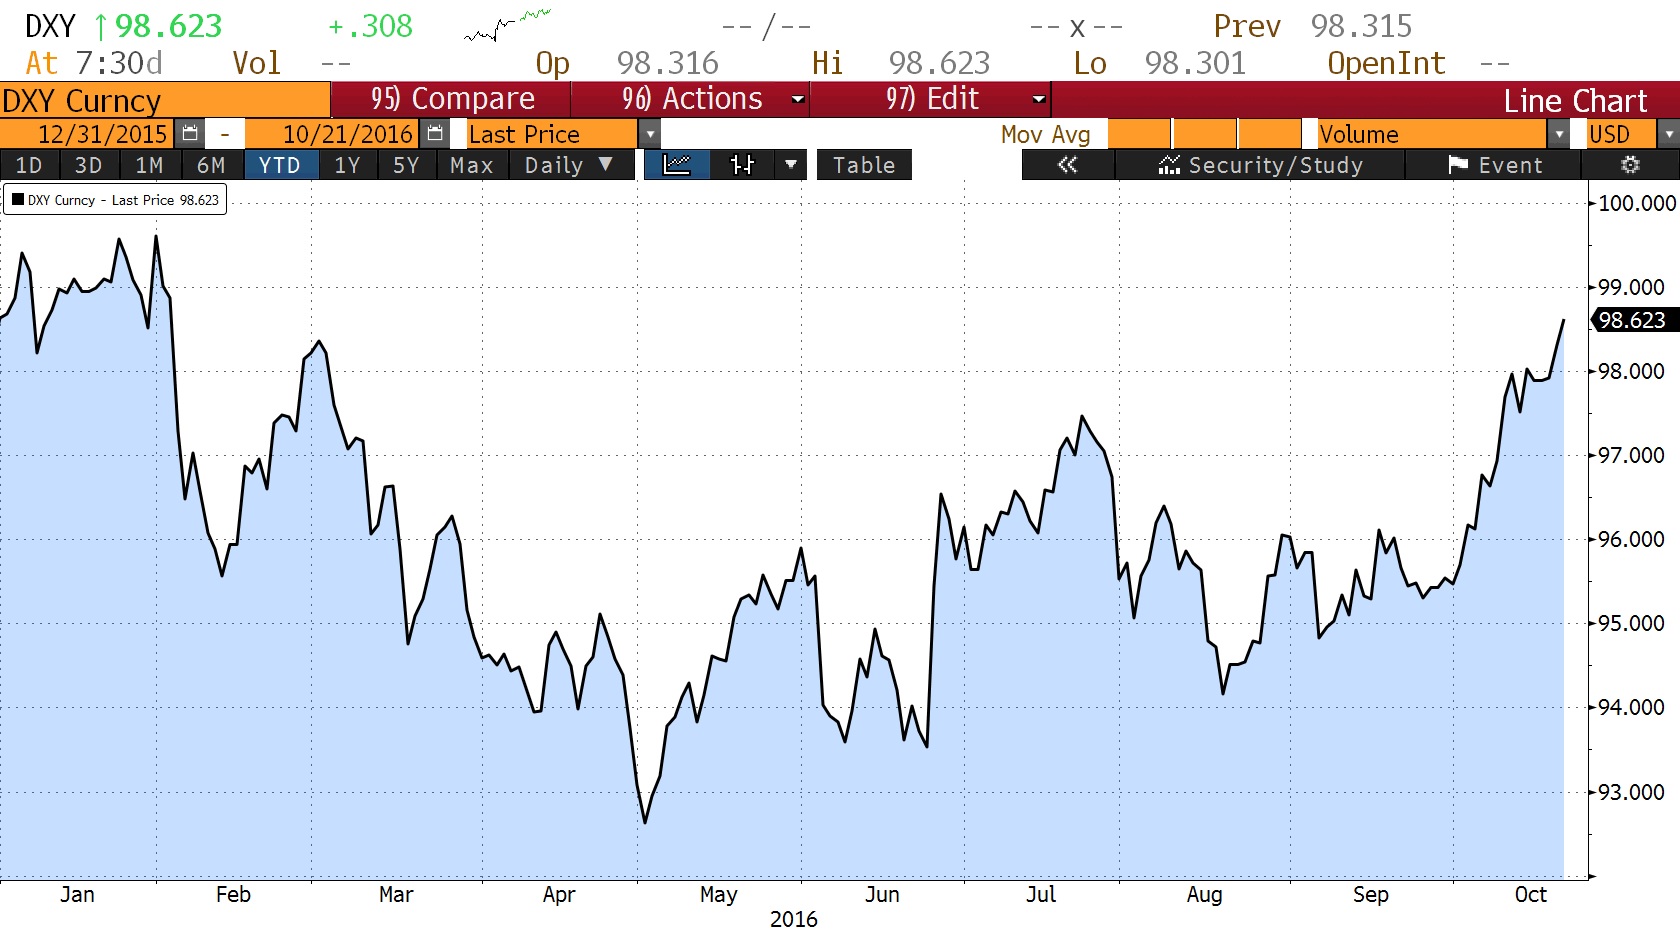
The dollar has been strengthening over the past few weeks; we believe much of this appreciation is due to expectations of tighter monetary policy.  Fed funds futures suggest that there is a 60+% chance of a rate hike at the December FOMC meeting.  Although the FOMC is divided and there are prominent doves that oppose any tightening, the consensus on the committee seems to be leaning toward a 25 bps increase.  However, we also suspect that the next hike (following December) will be delayed for several months.  In other words, to placate the doves on the FOMC, Chair Yellen will need to promise a very slow path; to satisfy the hawks, she will need to raise rates in December.

There are at least four different ways to value currencies—relative inflation, relative interest rates, trade performance and relative productivity.  As a general rule, if any of the four performed consistently, the other three wouldn’t exist.  Of the four, relative inflation, so-called “purchasing power parity,” is the oldest.  Although most of the time it doesn’t give strong signals, it does tend to indicate when a currency pair is at an extreme.

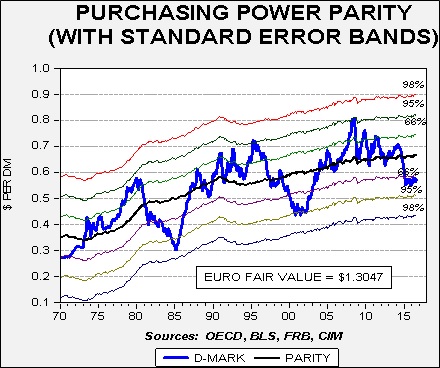
This chart shows the purchasing power parity relationship between the dollar and the D-mark.  We use the legacy German currency and calculate its currency value based on its conversion rate at the time the euro was introduced.  We do this for two reasons; first, we have a consistent inflation history with Germany, and second, Germany is the dominant economy in the Eurozone, meaning the comparison with Germany is likely representative for the leading nations in the Eurozone.  In our opinion, parity models are only useful at extremes.  When the relationship becomes more than one standard error from parity, it tends to signal a problem with valuation.  Currently, the dollar is overvalued by more than one standard error.  There have only been two other periods when the dollar was stronger based on this measure.  And, we note that this degree of overvaluation has been in place since January 2015, indicating it has been overvalued for a rather long time.

It appears that this deviation from fair value is due to divergent monetary policy.  The spread between German and U.S. three-month LIBOR rates has widened in favor of the U.S.

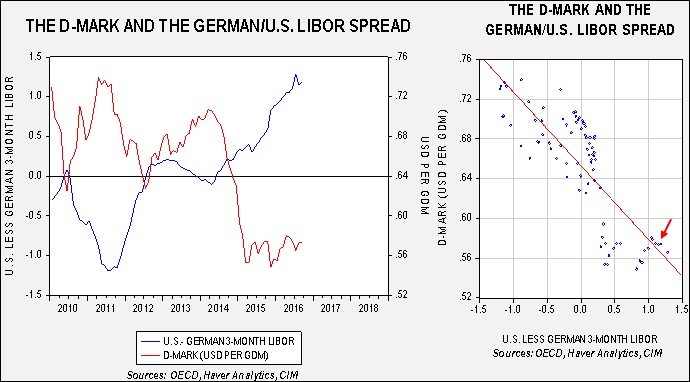
These charts show the same data in two forms, a simple line graph and a scatter plot.  In 2014, as the markets began to discount future FOMC tightening, the LIBOR rate began to rise modestly.  At the same time, German rates fell sharply as the ECB tried to address deflation and weak economic growth; in fact, German three-month LIBOR remains in negative territory.

Although interest rate differentials are favoring the U.S., it is interesting to note that the explanatory power of interest rate differentials in the purchasing power parity model is modest at best.  In other words, in relation to the past 36 years, the current spread in interest rates should not be having this degree of impact.  The current spread is having an expanded impact mostly due to the current level of low rates.[1]

Complicating matters is that the U.S. three-month LIBOR rate has been rising due to changes in U.S. money market regulation.  There has been a sustained exodus of liquidity out of institutional prime money market funds and this has led to higher three-month LIBOR rates.  We doubt this level of LIBOR will be sustained over time, and so the U.S. side of the interest rate spread should ease.  In addition, German LIBOR rates have been negative for the past few months.  We doubt the ECB will maintain negative rates much longer and instead use QE for monetary stimulus.  Thus, we would expect the spread to narrow in the coming weeks.

In addition, there has been a marked change in market expectations toward FOMC monetary policy.

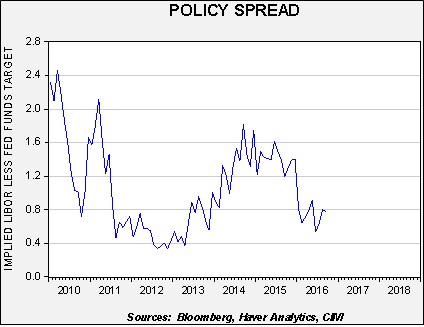
This chart shows the spread between the fed funds target and the two-year deferred Eurodollar futures contract.  The latter shows the market’s projection for future three-month LIBOR rates.  For much of the past two years, Eurodollar futures were projecting a terminal rate for fed funds of 1.50%; that has now declined to around 75 bps.  Simply put, the financial markets expect perhaps one or two more rate hikes over the next two years.  If this is all we get, we would expect the rate differentials between Germany and the U.S. to steadily contract.

It is worth noting that the current strength of the dollar appears based on the policy spread in 2014-15.  If so, once the market adjusts to a lower terminal fed funds target, we would expect some dollar weakness to develop.  In the second half of next year, a USD/EUR of 1.25 (a USD/DMK of 0.6410) would be likely.  A weaker dollar would be supportive for equities and commodities and bearish for debt and foreign equity markets, although this weakness would be partially offset by stronger foreign currencies.  In addition, emerging equities usually strengthen relative to developed markets when the dollar weakens.  Thus, in our asset allocation models, we have been slowly adding commodities and emerging equities to portfolios.  If the dollar weakens in 2017, we would likely build on these initial positions.

View the PDF

______________________

[1] Since 1970, the average spread between the U.S. and Germany is 69 bps, suggesting the current spread of 119 bps is rather wide.  However the standard deviation is 235 bps, meaning the current spread is within the normal range.

Daily Comment (October 21, 2016)

by Bill O’Grady and Kaisa Stucke

[Posted: 9:30 AM EDT] The dollar is higher this morning on speculation that the Fed interest rate policy will diverge from the easy monetary policies implemented in Europe and Asia.  The dollar rose yesterday and the euro fell as investors interpreted ECB President Draghi’s comments as an indication that stimulus policies will continue.  The dollar rose to its highest level against the euro since March.  As the chart below indicates, the dollar index, in general, has been rising since reaching its most recent low in the beginning of May.  Central bank policy divergence alongside relatively strong domestic economic growth have squeezed the dollar higher.  In turn, the higher dollar will likely dampen domestic exports.

(Source: Bloomberg)

The currency also reached a six-year high against the yuan after the PBOC weakened its daily reference rate by the most since August.  The chart below shows the onshore yuan rate (the chart is in yuan per dollar, so a higher reading means a weaker yuan).

(Source: Bloomberg)

We would like to take a closer look at yesterday’s Philadelphia Fed business outlook index.  The overall level weakened to 9.7 in October from 12.8 the month before, beating estimates of 5.0.  Details of the report reveal a generally improving picture, with new orders and shipments improving for October.  Additionally, the six-month forecast indicates an expansion of almost all measures.  The chart below shows the six-month average of the index, a more stable measure of manufacturing health.  The average continued improving in October, coming in at +4.1.

View the complete PDF

Daily Comment (October 20, 2016)

by Bill O’Grady and Kaisa Stucke

[Posted: 9:30 AM EDT] ECB President Mario Draghi is giving his press conference as we write this.  The ECB maintained its benchmark lending rate at zero, the deposit rate at -0.4% and the asset purchases at €80 bn a month.  Draghi said that the central bank expects interest rates to remain at presently low rates or lower.  He was asked if the committee would consider lowering rates in December, which Draghi deemed to be possible if the data calls for it, especially the strength of the economy and inflation.  Updated economic projections are also due for the ECB’s December meeting, thus providing more color on the effect of the current interest rate and stimulus policies.

The current ECB QE program is slated to end in March 2017, and what’s interesting is that Draghi indicated that there was no discussion during this week’s meetings of continuing or extending the stimulus program.  At the same time, Draghi said that he would not expect an abrupt end to the QE program, but that a tapering is more likely when the Governing Council decides to withdraw stimulus.  The stimulus package will be maintained until there is “a sustained adjustment in the path of inflation” consistent with the ECB’s inflation aim.  Inflation has remained mild in the Eurozone, having remained below the central bank’s target rate of 2.0% since 2013.  The chart below shows the annual change in the headline CPI and the ECB’s target rate.  Although CPI has picked up modestly recently, it still remains below the target rate.

The bank expects inflation to move close to the target rate by early 2019.  Given the lack of inflationary pressures and the ECB’s own inflation expectations, we would expect the QE program to remain in place until at least 2019.

Markets were expecting these outcomes; despite an initial drop in European equities, risk markets have bounced back.  The chart below shows the intraday chart of the euro, which spiked initially when the press conference started but has moved lower since.

(Source: Bloomberg)

Additionally, the chart below shows the EuroStoxx 50, which fell after comments from Draghi that the future of the stimulus package was not even discussed, but equities have rebounded since.

(Source: Bloomberg)

Regarding the U.S. presidential race, the third and final debate was held last night.  The debate focused on immigration, the Supreme Court and the Second Amendment.  It is unclear whether either candidate was able to persuade the undecided voters.

View the complete PDF

Daily Comment (October 19, 2016)

by Bill O’Grady and Kaisa Stucke

[Posted: 9:30 AM EDT] It’s a relatively quiet morning on the macro front.  Chinese data came in on forecast to slightly weaker than expected.  While GDP rose 6.7% annually, as expected, industrial production rose 6.1% annually, weaker than expected.

Yesterday afternoon, the Treasury International Capital (TIC) net monthly flows report was released.  The TIC report shows almost all international capital flows in and out of the country, including Treasury, bond, equity and other financial instrument flows.  Total net TIC inflows rose $73.8 bn in August compared to the $118.0 bn purchases seen in July.  At the same time, net long-term TIC flows, which mostly include Treasuries, rose $48.3 bn compared to the $102.8 bn.  Historically, long-term TIC flows increase alongside market volatility and falling international equity sentiment.  August’s moderating inflows indicate that international sentiment is improving as fewer investors are seeking the safety of Treasuries.

September domestic housing data disappointed this morning, with multi-family housing starts falling 40.8% annually (see below).  Despite continued strength in single-family starts, housing in general is shaping up to be a drag on economic growth.  The chart below shows the Atlanta Fed GDPNow series.  It does not yet include this morning’s housing data.  We would expect the weak housing data to add to the lower-trending GDPNow forecast.

The chart below shows the revisions and contributions to the forecast.  Before the starts data, residential investment was the second largest drag on the economy after net exports.

View the complete PDF

Daily Comment (October 18, 2016)

by Bill O’Grady and Kaisa Stucke

[Posted: 9:30 AM EDT] Equity markets are enjoying a strong morning as financial markets prepare for a modest credit tightening in December.  Chair Yellen’s recent comments about allowing the economy to run hot were somewhat offset by Vice Chair Fischer yesterday when he cautioned against letting the economy and inflation move too far above target.  Overall, our take is that we will get a hike in December and maybe one move next year.  If our outlook is correct, it would be supportive for U.S. equities as it would probably lead to a weakening dollar.  That probably isn’t the path in the short run, but should emerge later in 2017.

With the release of CPI data, we can update our versions of the Mankiw rule model.  This model attempts to determine the neutral rate for fed funds, which is a rate that is neither accommodative nor stimulative.  Mankiw’s model is a variation of the Taylor Rule.  The latter measures the neutral rate by core CPI and the difference between GDP and potential GDP, which is an estimate of slack in the economy.  Potential GDP cannot be directly observed, only estimated.  To overcome this problem, Mankiw used the unemployment rate as a proxy for economic slack.  We have created three versions of the rule, one that follows the original construction by using the unemployment rate as a measure of slack, a second that uses the employment/population ratio and a third using involuntary part-time workers as a percentage of the total labor force.

Using the unemployment rate, the neutral rate is now 3.55%.  Although this rate is well above fair value, it has dropped 27 bps over the past month as unemployment rises and the core CPI dips.  Using the employment/population ratio, the neutral rate is 1.31%, down 10 bps.  Finally, using involuntary part-time employment, the neutral rate is 2.87%, down 9 bps.  To some extent, the Mankiw models, based off the Phillips Curve, do suggest the FOMC is behind the curve but the degree of stimulus has actually eased over the past month.  Thus, the case for a rate hike has somewhat weakened, to an extent.  However, we don’t expect this will change expectations for a December hike.

Saudi Arabia is pricing its bond issuance this morning.  Although a successful bond issuance is neutral for oil prices, a case could be made that the kingdom is selling bonds to offset the loss of revenue that would come from cutting output, assuming prices don’t rise.  Of course, if the demand curve is more elastic than expected, we could see the revenue loss reduced.  We do note that, historically, commodity demand curves are price inelastic in the short run, meaning that a price cut leads to a loss of revenue.

As noted below, China’s borrowing is increasing at a rather fast clip.  There is a lot of commentary emerging on China’s debt growth and its sustainability.  We have deep reservations about China’s ability to grow at 6% without expanding debt to dangerous levels.  Perhaps the one saving grace for China is that the government can more easily assign potential losses because it’s a dictatorship.  Debt growth of this magnitude is bullish for global growth in the short run, but not in the long run.

View the complete PDF

Weekly Geopolitical Report – The TTIP and the TPP: An Update (October 17, 2016)

by Bill O’Grady

In January 2014, we first discussed the Transatlantic Trade and Investment Partnership (TTIP) and the Trans-Pacific Partnership (TPP).[1]  Both pacts have moved from obscure trade proposals to highly controversial political issues.  In this report, we will begin by discussing the nations involved.  We will examine overall details of the proposals, focusing on how they are different from traditional trade agreements.  From there, we will present an analysis of the controversy surrounding these proposals.  A look at the geopolitical aims of the agreements will follow and the likelihood that these treaties will be enacted.  As always, we will conclude with potential market ramifications.

The TTIP and the TPP
The TTIP will include the U.S. and all the nations of the EU.[2]  The TPP, which initially started with four nations, Brunei, Chile, New Zealand and Singapore, has expanded to 12 nations.[3]  Taiwan expressed interest in the TPP last year, but it is unclear whether the current configuration is comfortable with engaging in the age-old dispute over Chinese sovereignty.  South Korea has also decided to hold talks about joining the TPP group.  Conspicuous in its absence is China.

View the full report

____________________________

[1] See WGR, The TTIP and the TPP, 1/27/2014.

[2] Austria, Belgium, Bulgaria, Croatia, Czech Republic, Denmark, Estonia, Finland, France, Germany, Greece, Hungary, Ireland, Italy, Latvia, Lithuania, Luxembourg, Malta, Netherlands, Poland, Portugal, Romania, Slovakia, Slovenia, Spain, Sweden and the U.K.

[3] Australia, Canada, Japan, Malaysia, Mexico, Peru, U.S., Vietnam, Chile, Brunei, Singapore and New Zealand.

Asset Allocation Quarterly (Fourth Quarter 2016)

  • Although presidential elections gather a lot of attention from investors, we believe the specific person or party getting elected in this cycle may be less important than the forces driving the elections.
  • The Fed is likely to raise rates gradually and we don’t expect the tighter policy to create a recession.
  • Our equity allocations remain primarily domestic, although we believe emerging markets present an attractive return/risk opportunity for risk-tolerant investors.
  • We include a range of maturities in our fixed income allocations.
  • Our commodities allocation remains focused on gold to help address certain geopolitical and currency risks.
  • Our style guidance remains modestly in favor of growth over value at 60/40.

ECONOMIC VIEWPOINTS

For over 16 years, including many prior to forming Confluence, we’ve worked together providing quarterly reports about our asset allocation models. And every four years we face a presidential election that often attracts an outsized amount of attention from investors. We frame it as outsized because the outcome of most presidential elections alone is generally not of great consequence to the markets. Elections certainly do have broad consequences, but the financial markets usually adjust pretty quickly.

This isn’t to say presidential elections are insignificant. But right now, the specifics of who occupies the White House is perhaps less important than understanding the changing force voters are exerting on the U.S. political system. So, regardless of which party takes the helm, both are going to have to deal with this force, which we expect to continue and grow well beyond this election cycle. What does this force look like? It’s complex and multifaceted, but we think it’s essentially a transition. We believe our economic philosophy is shifting away from an emphasis on efficiency, and more toward one of equality. We expect this shift to take years, and last for perhaps decades. If we are near the beginning of the transition, as we believe we are, there a few things for an investor to monitor.

To begin, let’s consider what we mean by “efficiency” in the economy. With efficiency, tax rates and regulation are lower, fostering greater competition and innovation. Patent applications rise, along with technological developments that drive new products and processes. Business efficiency and profitability rise, while those building better mousetraps earn and keep significant wealth. Global trade rises as businesses seek to shift production to areas of lower cost, while simultaneously growing into new markets. Technology and globalization create obsolescence in the labor force, along with the creative destruction of existing plants, equipment and processes. Innovation and competition lower inflation, which benefits the broad population, but high returns on capital accrue disproportionately to those who have capital. In a nutshell, you get the Internet, iPhone and low prices, while workers are displaced and the wealthy become wealthier. We’ve been in the efficiency cycle for almost 40 years.

In contrast, with an “equality”-focused economy, tax rates and regulations rise, lowering incentives to innovate. Competition declines as a more rigid regulatory framework gains prominence. New product development declines, employment becomes more predictable and there’s less obsolescence. Global trade slows, creating more inflation. The income gap narrows between the wealthy and the poor. Here we see much longer cycles between the new iPhones, and they’re even more expensive with fewer meaningful upgrades. The retail industry is less threatened by Amazonian forces and participation in the labor market can stabilize and even grow. We may be heading into this environment. The chart on the next page illustrates the efficiency/equality transition.

A transition from efficiency to equality will take time and transcend several election cycles. The speed and depth of the transition are difficult to predict, but we feel the political parties are likely to feel ongoing pressure to change the established system of efficiency. Too many voters feel as though the current environment is unacceptable. Politicians and parties will adjust or lose their positions of governance.

Although we may be at the beginning of a transition, we don’t believe it’s likely to create a recession over our projected forecast period of three years.  On that front, we believe Fed policy is more immediately relevant.  Although the Fed has telegraphed a moderate pace of raising rates, forward interest rates indicate a broad expectation that the Fed will go even slower.  In this instance, our expectations are more aligned with the market, and we believe the economy is likely to continue along its path of slow growth for quite a while.

STOCK MARKET OUTLOOK

Although the aforementioned transition to equality may lower growth in corporate profits and increase inflation, we expect a gradual pace of change, allowing equities to perform reasonably well. Looking forward, we believe the return/risk profile of stocks is generally constructive and we continue to diversify across capitalization sizes. This quarter we trim the small cap exposure in some portfolios, recognizing its recent strong performance. We are also beginning to utilize emerging market equities across more portfolios as we see potential upside from favorable currency trends and low valuations.  Still, emerging market equities are highly volatile, so we utilize only a limited allocation, except where risk tolerance is high.

With regard to our large cap sector weights, we remain overweight energy but pare back the exposure after the sector’s very strong performance. We are also overweight the technology, industrial and consumer discretionary sectors, while being underweight financials, utilities and telecom. (We continue to allocate to real estate as a separate asset class; see comments in the Other Markets section below.) These sector views are formed from our work on valuations and industry fundamentals. Our growth/value posture remains at 60/40.

BOND MARKET OUTLOOK

As the economy shifts from efficiency to equality, we will be keeping close tabs on inflation, which tends to create significant risks for bond investors. However, we do not anticipate inflation to emerge quickly or without a measure of warning. Excess global supply capacity remains high for many industries and inflation is unlikely to build unless global trade is dialed down. Such a trend is possible but not yet in place. Accordingly, we continue to believe bond investors can utilize a combination of short, intermediate and long maturities in their portfolios. Bonds continue to provide excellent diversification and can help to address market volatility when combined with other asset classes.

At this point we do not anticipate a recession and do not expect large increases in bond defaults. Therefore, we continue to believe corporate bonds are relatively attractive. Still, our focus remains on investment grade corporate bonds, which we prefer over speculative grade bonds.

OTHER MARKETS

We expect real estate fundamentals to remain generally strong and believe this asset class can benefit from ongoing low interest rates. Still, this asset class has performed very well and we trim the exposure in some portfolios this quarter. Looking forward, the return/risk remains attractive, particularly where income is an objective.

Commodities continue to provide diversification and we focus our commodities allocation on gold. Gold helps to address some of the risks emerging from global central bank policies aimed at depreciating currencies. This precious metal can also help address certain geopolitical risks and can perform well in the event the U.S. dollar weakens relative to other major currencies.

View the complete PDF

Daily Comment (October 17, 2016)

by Bill O’Grady and Kaisa Stucke

[Posted: 9:30 AM EDT] The weekend was full of political news and some policy news as well.  On the political front, the Trump campaign is pressing its point that the elections could be “rigged” but has widened the definition beyond mere poll manipulation, suggesting the mainstream media is aligned against him.[1]  Polls are leaning toward Sen. Clinton but we are somewhat skeptical of the data.  Overall, we think there is likely a higher degree of preference falsification in this election cycle and it probably means the polls are underestimating the degree of support for Trump.  There was even some violence as a GOP office was firebombed in North Carolina.  Both sides have blamed the other; Mr. Trump has already accused the Democrats of the attack, while some Democratic Party supporters have suggested it was a “false flag” operation.  We don’t know who did it but it does suggest the potential for civil disorder is rising in the post-election environment.

The NYT had some long reads about Sen. Clinton over the weekend.  There were reports on further Wikileaks of Clinton’s speeches to financial firms, which make it clear why she refused to release the transcripts during the primaries.  Her comments were supportive of financial services, not favorable to Dodd-Frank and suggested she was on the bankers’ side.  This is a concern of the Left-Wing Populists (Senators Sanders and Warren).  We expect that if Clinton is elected president she will face a constant barrage of advice from the Left-Wing Populists about who should serve in regulatory positions in the administration.  Although much commentary has been made about the breakup of the GOP, the Democratic Party is facing its own disunion similar to what the Republicans are facing.  Our take is that we are in the early stages of a resetting of political coalitions.  The last one we saw was in the 1960s, when the Roosevelt Coalition of the Center-Left Establishment and the Right-Wing Populists began to crumble.  We don’t know how this one will evolve but it is something we are watching closely.

On the policy front, Chair Yellen indicated that she will be willing to allow the economy to “run hot” and overshoot the 2% inflation target.  This isn’t really a shocking insight but it does suggest that the FOMC will lean dovish.  What this means in terms of actual policy is that we will likely see a hike in December to placate the hawks but we would not expect another hike until H2 2017, and would only expect one move next year.  Meanwhile, at this week’s ECB meeting, expectations call for the central bank to signal that it will extend QE at its meeting in December.  These twin expectations should be dollar supportive in the short run but will likely lead to a weaker dollar next year as the market begins to anticipate ECB tapering and also discount very little tightening from the FOMC.

On the geopolitical front, Iraqi forces and allies are beginning the liberation of Mosul from IS.  We expect this operation to take weeks.  NBC is reporting that the CIA is preparing a package of cyber attacks on Russia in retaliation for hacks affecting the political process in the U.S.  Simply preparing attacks isn’t the same thing as executing them.  We would be surprised to see anything too aggressive result from these threats.

View the complete PDF

______________________________

[1] This was the point of Matt Taibbi of Rolling Stone in a piece from August.  See:  http://www.rollingstone.com/politics/matt-taibbi-on-the-summer-of-the-media-shill-w434484.

Asset Allocation Weekly (October 14, 2016)

by Asset Allocation Committee

Given continued sluggish economic growth and fears that monetary policy has reached the point where it can no longer stimulate growth, a renewed attention has been brought to discretionary fiscal policy.  In the 1970s, discretionary fiscal policy fell out of favor due to a number of shortcomings:

  1. Public investment, if needed, should not be timed to offset recessions. In other words, if the Navy needs an aircraft carrier, one should be built without waiting for a recession.  Thus, public investment should be based on need, not designed as a countercyclical policy.
  2. Discretionary policy must pass through the legislative process. This tends to slow the outcome to the point that the recession may have passed by the time Congress allocates spending.
  3. Fiscal spending, especially fixed asset spending, can “crowd out” private spending. In functioning investment markets, investment spending should be generated by cutting interest rates rather than by directing public investment by government fiat.  In addition, private investment is forced to pass through the test of profitability, reducing the likelihood of malinvestment.

From the late 1970s, economists generally concluded that discretionary fiscal spending was unnecessary and that countercyclical monetary policy was sufficient to guide the economy through recessions.  Although there were occasional extraordinary fiscal measures taken during some downturns, such as tax rebates and extended unemployment insurance payments, for the most part, monetary policy was the measure of choice in terms of countercyclical policy.

However, the developed world now finds itself in a situation where monetary policy may have reached its point of diminishing returns.  The Bank of Japan (BOJ), the Swiss National Bank and the European Central Bank (ECB) have tried to implement negative interest rates.  In these cases, it appears that the damage to the banking system is offsetting any gains from lower rates.  Balance sheet expansions (QE) have been deployed by the aforementioned central banks and the Federal Reserve.  In general, balance sheet expansion has become less effective; a common complaint is that asset values have been extended in many markets without generating much economic growth.  Central banks are also struggling to find assets to purchase.  The BOJ has been buying equity ETFs and the ECB has added corporate bonds to its balance sheet, causing further financial market distortions.

This isn’t to say that the central banks have exhausted all their options, but the ones that remain cannot be implemented without help.  For example, central banks could implement quantitative easing by purchasing foreign bonds; this would likely lead to currency depreciation that would boost exports.  However, such “beggar thy neighbor” policies would likely bring retaliation and further reduce global trade.  The other option is “helicopter money,” which is the direct central bank financing of government spending.  Although this policy would be effective, it does require the participation of fiscal authorities.   In addition, central bank independence would almost certainly be compromised.

So, if fiscal policy is expanded, would we face the problems outlined above?  Generally speaking, the biggest risk would be point #2 above.  Getting spending plans through a divided Congress would be difficult.  In addition, avoiding malinvestment, regardless of whether it’s public or private, is always hard.  But in the current partisan environment, coming up with public investment that would foster future growth will be problematic.  However, there is evidence to suggest that public spending has been neglected for some time and that private investment is currently weak, reducing the problem of “crowding out”; in other words, concerns about points #1 and #3 are reduced.

This chart shows the net stock of fixed assets for both the public and private sectors.  We have log transformed the data and de-trended both series.  In general, a reading over zero indicates the net stock of fixed assets is above its long-term trend and vice versa.  Note that public sector assets were above trend from 1940 into the mid-1990s.  This was mostly due to elevated Cold War defense spending.  During this period, private sector fixed asset levels tended to remain under trend, although a surge that began in the mid-1960s did eventually lead to a rise above trend.  Note that the surge of both public and private spending on fixed assets in the 1970s probably led to crowding out and higher inflation.

Current conditions suggest that both private and public sector investment are well below trend.  In general, private sector investment tends to have a greater impact on future growth and would thus be preferred.  However, given an environment of weak asset formation from both sectors, the economy would likely benefit from increased investment in either sector.  Thus, promises of increased spending on infrastructure and defense would likely have a positive effect on the economy and be positive for equity markets.

View the PDF