Asset Allocation Weekly (October 28, 2016)

by Asset Allocation Committee

My weekend exercise is to take my dogs on long walks.  Both dogs seem to enjoy these walks and I use the time to listen to podcasts.  I recently listened to a long podcast that interviewed Sebastian Mallaby, a British journalist and senior fellow at the Council on Foreign Relations.  He has recently written a biography on Alan Greenspan, titled The Man Who Knew.  The FT Alphachat podcast[1] was an interview about that book.

Although I haven’t read the book yet (it’s on the list), a key takeaway from the podcast was that one of Greenspan’s attributes was that he was a savvy political operative.  He understood that the Federal Reserve operates in a political environment and that one of the Chair’s jobs is to manage the political system to maintain the central bank’s independence.  Mallaby suggested in the podcast that Greenspan was truly a “maestro” in managing the political situation.  However, as I listened, I wondered if managing the political situation meant that monetary policy was being framed to please the politically powerful.

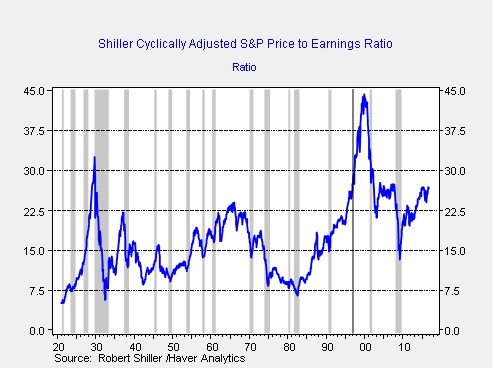
This chart shows the Shiller Cyclically Adjusted Price Earnings ratio (CAPE).  We have placed a vertical line at December 1996 when Greenspan gave his famous “irrational exuberance” speech, raising questions about equity market valuations.  As the chart shows, the CAPE was approaching levels near the peak of the 1929 stock market bubble that was soon followed with a massive market crash.  Although Greenspan didn’t suggest that the Fed was about to change monetary policy to curb asset prices, equity markets around the world fell sharply on fears that Greenspan was about to use monetary policy to lower the stock market.  Greenspan faced heavy criticism for the speech.[2]  Being the consummate political operator, Greenspan’s Fed policy seemed to evolve into a form where asset market bubbles cannot be established in advance and the job of the central bank was to use monetary policy to repair the damage wrought to the real economy once the bubble collapses.

This chart overlays the Chicago FRB National Financial Conditions Index and the fed funds rate.  The index measures stress in the financial system.  The higher the reading, the greater the stress in the system.

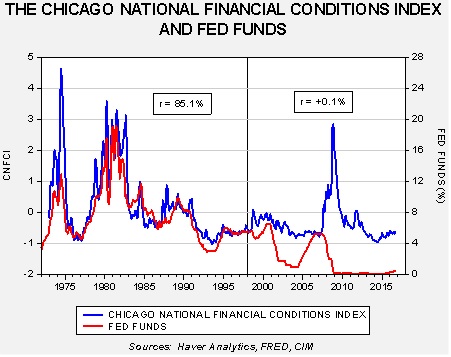
The two series were closely correlated (85.1%) from 1973 through 1997, until the financial conditions index was created in 1998.  When fed funds rates rose, financial conditions deteriorated.  In some respects, financial conditions acted as a “force multiplier” for policy.  But, from 1998 to the present, the two series have become virtually independent.  After hearing Mallaby’s podcast, we suspect the FOMC may be trying to keep financial conditions calm, which could be construed as a reading under zero on the above chart.

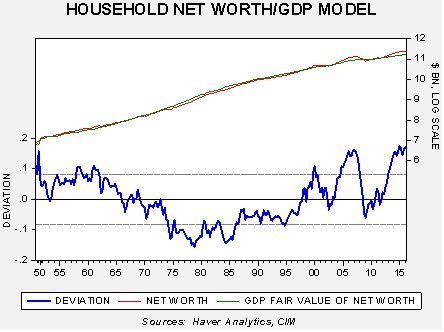
This chart shows a model of household net worth regressed against nominal GDP.  Both series have been log-transformed.  Net worth was elevated into the early 1960s but steadily declined into the late 1970s.  It began to rise in 1995.  Note that since 1998, net worth has generally outpaced GDP except during recessions.

Currently, net worth relative to GDP is elevated.  It does appear that these increases in net worth that outpace the overall growth of the economy could be a function of monetary policy.  As investors become confident that the Federal Reserve will continue to suppress financial stress, it appears there is a tendency for asset prices to rise to lofty levels.  When valuations become unsustainable, often at the turn of the business cycle, it appears that sharp declines in net worth, caused by price declines in real and financial assets, leads to a fall in household net worth.

Mallaby’s research of Greenspan suggests he was inclined to allow asset prices to rise while striving to contain price inflation.  It is arguable that Greenspan’s policies with regard to financial system stress have been adopted by his successors.  If so, monetary policy is probably (although perhaps inadvertently) designed to aid asset prices.  As the last chart shows, net worth is elevated again at levels that have been difficult to sustain in the past.  We still believe that recessions are the primary triggers of market corrections and we closely monitor the economy for such events.  The current level of valuation makes this exercise even more critical.

View the PDF

______________________

[1] http://ftalphaville.ft.com/2016/10/21/2177678/podcast-our-chat-with-sebastian-mallaby-on-alan-greenspan/

[2] http://www.wsj.com/articles/SB95774078783030219

Daily Comment (October 28, 2016)

by Bill O’Grady, Kaisa Stucke, and Thomas Wash

[Posted: 9:30 AM EDT] As we discuss below in detail, Q3 GDP rose 2.9%, exceeding estimates of 2.6%.  The quick analysis of the data shows that two components were key to the report.  First, investment rebounded but mostly due to a rebuild in inventories.  The other major surprise was a bounce in net exports, which added 83 bps to growth.  Looking at the data on a trend basis, the stall in the dollar’s rally supported trade.

This chart looks at the JPM inflation and trade-adjusted dollar index and the three-year average of net exports’ contribution to growth.  On a trend basis, net exports are still a drag on growth but we are seeing a modest improvement in trade as the dollar’s rally has cooled.  Recently, the dollar has staged a modest rally on expectations of FOMC tightening.

Tomorrow, Iceland’s voters go to the polls for parliamentary elections.  Normally, we don’t track Iceland’s political situation.  It’s a small country[1] and an equally small economy, although it was a “canary in the coal mine” for the financial crisis in 2008.  What is notable about this election is that the Pirate Party, whom the FT refers to as “a ragtag bunch of internet activists,” could either be the leading or second largest party in the legislature after the vote.  The Pirate Party was polling near 40% support in H1 of this year, but its lack of policy prescriptions and inexperience has diminished its support to around 20%.  One characteristic of the party is that it intends to use the internet to conduct snap referendums, which will probably not be binding but could evolve into a form of direct democracy.

Why is this important?  First, it shows another emerging element of populism.  By not having a well-defined platform and planning to simply ask voters what they think, it will open the potential for more direct democracy.  In a small and, at least for now, mostly homogeneous society, Iceland might be able to allow voters to directly signal their intentions in an orderly fashion.  In other words, this could be a step away from representative democracy.  Second, it shows that a growing disregard for political elites has clearly developed in Iceland, reflecting similar movements across the West.  A recent paper from Barclays[2] suggests that the two most powerful and common features of populists are the perceived loss of sovereignty and the belief that they are not represented.  The Pirate Party movement is another element of this issue.

View the complete PDF

_______________________________

[1] Though, apparently, a lovely country.  Mrs. O’Grady has pined for a trip to this island nation for some time.

[2] Barth, Marvin. “The Politics of Rage.”

Daily Comment (October 27, 2016)

by Bill O’Grady, Kaisa Stucke, and Thomas Wash

[Posted: 9:30 AM EDT] Belgian political leaders were able to overcome Walloon’s opposition to the free trade deal with Canada and so, at the deadline, it looks like the agreement will be approved, assuming none of the other 27 nations decide to oppose the deal, too.  Most of the opposition to the agreement with Canada is due to the creation of an arbitration body that would adjudicate regulatory differences between trading partners.  For example, if a Canadian farmer wanted to sell GMO grain to a buyer in the EU in a nation that banned GMO grain, in theory, this panel could overrule the local law.  The possibility that local regulations could be nullified by a foreign nation has become a major problem for not only this deal, but TPP and TTIP as well.  We would not be surprised to see another member of the EU oppose this trade deal before it is signed.  If it does pass, it may be the last one for a while unless President Obama is able to push TPP through during the lame duck session after the November elections.

On a side note, there have been reports that a Russian naval battle group, which includes Russia’s lone aircraft carrier, the decrepit RFS Admiral Kuznetsov, was denied a port of call at the Spanish Port of Ceuta.  The Russian Navy wanted to use the port for refueling; NATO pressured Spain to deny access and Russia has apparently decided to withdraw its request.  This move by Spain and Europe is a bit of a surprise as it shows an unexpected degree of unanimity for NATO against Russia.  We will see if the Russian battle group can actually make it to Syria where it is expected that the RFS Kuznetsov will conduct air sorties against Syrian rebels.

U.S. crude oil inventories fell 0.6 mb compared to market expectations which called for a 1.3 mb build.

This chart shows current crude oil inventories, both over the long term and the last decade.  We have added the estimated level of lease stocks to maintain the consistency of the data.  As the chart below shows, seasonally, we should see inventories rise as refineries undergo maintenance.  But, even with the drop in refinery operations, inventories have steadily declined.

As the chart below shows, imports have declined sharply.  Some of this is probably due to tropical storms which have affected shipping into the Gulf of Mexico.  It is notable that Mexican and Venezuelan exports were down sharply last week.  If this is the case, we may see a rebound as the tropical season comes to a close (the official end of hurricane season is Halloween).

(Source: DOE, CIM)

As the chart below shows, the drop in imports has led to a contra-seasonal draw in oil inventories.  If stocks don’t rise in the coming weeks, it would be supportive for crude oil prices.  However, if the drop in imports is due to hurricane season, we should see a rebound in inventories over the next few weeks.

Based on inventories alone, oil prices are overvalued with the fair value price of $45.72.  Meanwhile, the EUR/WTI model generates a fair value of $45.24.  Together (which is a more sound methodology), fair value is $43.62, meaning that current prices are above fair value.[1]  Most likely, the divergence from fair value is due to hopes of an OPEC deal that would boost prices.  We are surprised to see oil hold its gains in the face of a rising dollar.  The best explanation is that OPEC has engineered this price strength.  However, this means that the oil market is quite vulnerable to any disappointment from the cartel.

View the complete PDF

_______________________________

[1] It also suggests some collinearity issues, in that the two independent variables applied together yield a lower price than what each generates separately.  In fact, oil inventories and the euro are inversely correlated at -72.0% since 2012.  Thus, the dollar’s recent strength usually occurs with rising oil inventories.  However, so far, this hasn’t occurred, likely for the reasons noted above.

Daily Comment (October 26, 2016)

by Bill O’Grady, Kaisa Stucke, and Thomas Wash

[Posted: 9:30 AM EDT] Global equity markets are weaker this morning off some disappointing earnings reports.  This shift in sentiment is routine during earnings season.  It does appear that the EU-Canadian free trade deal may be back on track as the Walloons are reportedly moderating their opposition.[1]  Still, with the deadline looming tomorrow, it will take an eleventh hour negotiation to prevent the deal from collapse.

With stagnant economic growth and high margins, companies have had the “urge to merge” in order to acquire market share and revenue.  A NYT article today suggests that regulators are beginning to rethink current policy.  At present, regulators have been open to “vertical” mergers, where a company buys a supplier or a distributor.  They have been less sanguine about “horizontal” mergers, where a company buys a competitor.  The economics of generally approving vertical mergers is fairly straightforward; it is more difficult for a firm to gain market power in a vertical merger.  As long as the upstream or downstream entity can still sell to competitors, the government has generally not opposed such combinations.

However, the NYT report suggests that some legal scholars are suggesting that economics may not be sufficient to analyze vertical mergers.  Instead, they argue that such combined firms may acquire political power due to their size.  In other words, although the public may not be directly harmed, they aren’t necessarily helped, either.  Given the evolving tone of the political situation, we may see greater opposition to vertical mergers based on size alone.

There is another element of mergers gaining attention as well.  The Council of Economic Advisors published a paper[2] this month suggesting that part of the reason workers’ wages are not growing very fast is due to increasing industry concentration.  The term for this is either “monopsony” or “oligopsony,” which means “one buyer” or “few buyers,” respectively.  When there is only one employer in an industry or an area, one sees the “company town” phenomenon emerge.  If there is little competition for workers, these few firms can pay lower wages.  Although industry concentration is just one element of monopsony, it is one that regulators could lean against via anti-trust policy.  What this means for investors is that the windfalls that sometimes occur when an equity in a portfolio is acquired may become less frequent.

View the complete PDF

______________________________

[1] For background on Belgium and the divisions between Wallonia and Flanders, see WGR, Wallonia versus Flanders, 11/19/2007.

[2] https://www.whitehouse.gov/sites/default/files/page/files/20161025_monopsony_labor_mrkt_cea.pdf

Keller Quarterly (October 2016)

Letter to Investors

In our July letter we wrote about the “is-ought problem,” the tendency to confuse the world we have with the world we wish we had.  As we noted then, this problem represents a major danger around election time for investors (and others).  The danger is that investors may be so consumed with the world that ought to be (i.e., one in which all their candidates win) that they fail to account for the world that is.  The world that is is usually a messy world, with divided governments and unsatisfying compromises.  This is the world in which we have to invest, regardless of who is president.  We at Confluence are concerned only with the world that is; that’s the world we have to wrestle with as investors.  We’ll leave the world that ought to be for political theorists and utopians.

It’s rare that all or most sides of a political debate agree on what ought to be regarding an issue; however, when it occurs, we must sit up and take notice.  We have actually seen that happen in this most contentious of political seasons.  The issue in question is trade; specifically (for the first time in my memory), both presidential candidates of the two major political parties stand in opposition to a major international trade treaty, the Trans-Pacific Partnership (TPP).  Trade pact news is usually buried on page A17 of most newspapers and is rarely the sort of issue that gets the political blood rushing.  While most voters are focused on other issues, here is one issue that both candidates seem to agree on, and that gets our attention.

Trade particularly gets our attention because the globalization of trade that has prevailed since the late 1970s has been, in our opinion, one of the major factors in reducing inflation, not just in the U.S., but around the world.  We don’t have time in this short letter to go into the reasons this is so or why the candidates have come out against the TPP.  (Our chief market strategist, Bill O’Grady, has written extensively on this in our Weekly Geopolitical Reports.) Suffice it to say that after blowing in the same direction for about 40 years, the trade winds have shifted.  The Brexit vote, wherein the British people voted to separate the United Kingdom from the European Union, is a comparable event and illustrates that this trend is not a U.S.-only phenomenon.  If this political trend in opposition to unfettered trade between nations becomes a consensus, then we may be looking at rising inflationary expectations (for the first time in 35 years).  Rising inflation would probably pressure interest rates up and stock valuation metrics down.

We don’t raise this issue to scare you, but to provide an example of what we look for as we analyze the political theater before us.  Agreement between candidates is rare, but when they agree on an issue that affects the portfolios of all investors, we must take notice.  There are powerful influences in both government and business that greatly favor the TPP and other trade pacts.  It’s not at all certain that either candidate could easily unwind the pro-trade consensus.  But we want you to know that we are paying close attention to this and possible implications of the political process, even if they’re on the back pages.

We appreciate your confidence in us.


Gratefully,

Mark A. Keller, CFA
CEO and Chief Investment Officer

View the PDF

Daily Comment (October 25, 2016)

by Bill O’Grady, Kaisa Stucke, and Thomas Wash

[Posted: 9:30 AM EDT] Overnight news flow was unusually low.  Earnings are generally coming in favorably as energy companies recover.  Equity markets remain relatively firm.

The new money market rules officially went into effect on Oct. 14th and, now that they are in place, the short-term money markets appear to be stabilizing.

(Source: Bloomberg)

Over the past year, the three-month LIBOR rate has increased by over 50 bps.  This is a significant tightening of credit which occurred due to changes in regulation.  As we have noted before, there were two notable changes to money market (MMK) rules.  First, for institutional prime money market funds, the net asset value (NAV) will no longer be fixed at $1.00 per share (meaning a money market fund could “break the buck”).  Second, prime and municipal money market funds can now temporarily halt withdrawals during periods of market turmoil, denying investors access to their cash for up to 10 days.

The new rules have led to a massive shift in money market fund allocation; over the past year, more than $1.0 trillion has exited prime money market funds and shifted to government funds, which do not have a floating NAV or any restrictions on access to cash.

We suspect that the flows away from prime MMK and into government MMK are probably close to ending.  What bears watching next will be the impact of projected FOMC tightening in December.

The chart above shows the spread between three-month cash deposit rates and the effective fed funds rate.  Currently, the spread is over 47 bps, the widest since the financial crisis.  If the FOMC raises rates and this spread is maintained, the market impact will be much stronger than the Fed probably expects.  In other words, the rate hike will be larger than it would have been prior to the change in regulation.  If, on the other hand, the spread narrows after the Fed raises rates, the market impact from Fed tightening will be less of an issue.  This is one of the factors we will be tracking after the next policy tightening.  Our expectation is that this spread is a permanent change due to the regulatory adjustments and so borrowing rates have already increased by 30 bps from a year ago.

View the complete PDF

Weekly Geopolitical Report – The Geopolitics of the Reserve Currency: Part 1 (October 24, 2016)

by Bill O’Grady

One of the more interesting developments in this presidential political cycle has been the near total abandonment of free trade.  Neither presidential candidate supports the Trans-Pacific Partnership (TTP) or the Transatlantic Trade and Investment Partnership (TTIP), the topic of last week’s report.  The primary reason for this backlash against free trade is the fear that U.S. employment is adversely affected by trade.

Some of the earliest work in economics was on trade.  For example, the trade theory of comparative advantage was developed by David Ricardo in 1817.  With perhaps the exception of Marxism,[1] most economists assume that trade is positive for economies.  Most polls seem to suggest Americans still support free trade, but clearly the political class has concluded that supporting free trade is a risky stance.  So, how did we get here?

We believe that the general misunderstanding of the U.S. superpower role is behind the backlash against free trade.  In pure theory, it’s hard to argue against free trade.  Most economists adhere to the position that efficiency is an undisputable good.  However, the way trade works in the real world isn’t exactly how it works in the classroom.  Often, political pundits will contend that the growing rejection of free trade is due to the fact that the benefits are broad but the costs fall disproportionately on workers who are adversely affected directly by import competition.  Although this is a partial explanation, it is critical to understand that the global hegemon faces specific costs that are generally unappreciated.

In this report, we will begin with a narrative describing the use of the reserve currency in trade.  Next, we will offer a short history of the dollar’s evolution as a reserve currency.  In the next section, we will examine the reserve currency as a global public good, provided by the superpower.  Next week, we will discuss the economics and geopolitics of the reserve currency and, as is our usual fashion, we will conclude with potential market ramifications.

View the full report

___________________________

[1] Some Marxists hold that trade is a form of imperialism and is another tool for capital to subjugate labor.

Daily Comment (October 24, 2016)

by Bill O’Grady and Kaisa Stucke

[Posted: 9:30 AM EDT] Good ISM data from Europe (see below) lifted global equity markets.  Mergers are another factor affecting financial markets, with the biggest being Time Warner (89.48, +6.84) and ATT (37.49, -1.15).  This one is getting lots of political attention.  Donald Trump has already indicated that his administration would kill the deal.  Sen. Clinton’s campaign issued a statement calling for caution and scrutiny.  And, Sen. Sanders has come out saying “no way” would he approve the merger.  The persistent theme of populism v. establishment appears to be playing out in this merger.

On the election front, it is becoming a foregone conclusion that Donald Trump will lose in historical fashion.  We remain unconvinced.  Although we still expect Sen. Clinton to win, we suspect the vote will be much closer than current polls suggest.  However, we also warn that focusing solely on the presidential race runs the danger of missing major cultural, social and political shifts.  The country is dividing along populist and establishment lines.  Further evidence of this split comes from reports suggesting that House Majority Leader Ryan (R-WI) is facing a leadership challenge from the Freedom Caucus, the populist GOP House faction.  According to Forbes,[1] it is doubtful that the Freedom Caucus can muster enough votes to actually oust Ryan.  However, Ryan was never all that keen on the job anyway and has presidential ambitions.  Ryan, like his predecessor, will probably be forced to cobble together a voting bloc of establishment Democrats and Republicans to pass any legislation, and such moves will make him unpopular.  If the Freedom Caucus makes conditions difficult enough for Ryan, he may just resign, throwing the House into disorder during the lame duck session.

A couple of interesting trends appear to be developing in China.  First, the weekend NYT reported that the anti-corruption campaign is evolving into a loyalty policing campaign instead.  The CPC Central committee begins meetings today and part of Chairman Xi’s agenda is tighter control and management of the party.  Displays of loyalty are now being demanded.  Another element that appears to be emerging is that Xi is pressing for an end to mandatory retirement rules, which would allow his most trusted advisor, Wang Qishan, who runs the anti-corruption office, to remain in power.  Second, there are hints that Xi is also pressing for a third term as leader of China, breaking the tradition established by Deng.  The post-Mao rulers did not want to create another dynastic leadership structure and thus implemented an informal two-term limit.  Xi has not indicated who will succeed him, something that would be required over the next year if he does not intend to run for a third term.  Loyalty oaths would likely support the process of grabbing a third term.

Finally, Iraq is indicating that it will not participate in OPEC output cuts, citing the fact that it is engaged in a war with IS and needs all the revenue it can muster to defeat this foe.  With Iran refusing to participate as well, and Russian compliance doubtful, Saudi Arabia is facing the unpleasant prospect of returning to the role of swing producer which will effectively force it to lose market share.  If OPEC is unable to negotiate a deal, oil prices are vulnerable to a break into the $40 to $45 per barrel range.

View the complete PDF

_______________________________

[1] http://www.forbes.com/sites/stancollender/2016/10/23/paul-ryan-could-be-ousted-in-3-weeks-throw-the-lame-duck-into-chaos/#6b6022c77bba

Asset Allocation Weekly (October 21, 2016)

by Asset Allocation Committee

The dollar has been strengthening over the past few weeks; we believe much of this appreciation is due to expectations of tighter monetary policy.  Fed funds futures suggest that there is a 60+% chance of a rate hike at the December FOMC meeting.  Although the FOMC is divided and there are prominent doves that oppose any tightening, the consensus on the committee seems to be leaning toward a 25 bps increase.  However, we also suspect that the next hike (following December) will be delayed for several months.  In other words, to placate the doves on the FOMC, Chair Yellen will need to promise a very slow path; to satisfy the hawks, she will need to raise rates in December.

There are at least four different ways to value currencies—relative inflation, relative interest rates, trade performance and relative productivity.  As a general rule, if any of the four performed consistently, the other three wouldn’t exist.  Of the four, relative inflation, so-called “purchasing power parity,” is the oldest.  Although most of the time it doesn’t give strong signals, it does tend to indicate when a currency pair is at an extreme.

This chart shows the purchasing power parity relationship between the dollar and the D-mark.  We use the legacy German currency and calculate its currency value based on its conversion rate at the time the euro was introduced.  We do this for two reasons; first, we have a consistent inflation history with Germany, and second, Germany is the dominant economy in the Eurozone, meaning the comparison with Germany is likely representative for the leading nations in the Eurozone.  In our opinion, parity models are only useful at extremes.  When the relationship becomes more than one standard error from parity, it tends to signal a problem with valuation.  Currently, the dollar is overvalued by more than one standard error.  There have only been two other periods when the dollar was stronger based on this measure.  And, we note that this degree of overvaluation has been in place since January 2015, indicating it has been overvalued for a rather long time.

It appears that this deviation from fair value is due to divergent monetary policy.  The spread between German and U.S. three-month LIBOR rates has widened in favor of the U.S.

These charts show the same data in two forms, a simple line graph and a scatter plot.  In 2014, as the markets began to discount future FOMC tightening, the LIBOR rate began to rise modestly.  At the same time, German rates fell sharply as the ECB tried to address deflation and weak economic growth; in fact, German three-month LIBOR remains in negative territory.

Although interest rate differentials are favoring the U.S., it is interesting to note that the explanatory power of interest rate differentials in the purchasing power parity model is modest at best.  In other words, in relation to the past 36 years, the current spread in interest rates should not be having this degree of impact.  The current spread is having an expanded impact mostly due to the current level of low rates.[1]

Complicating matters is that the U.S. three-month LIBOR rate has been rising due to changes in U.S. money market regulation.  There has been a sustained exodus of liquidity out of institutional prime money market funds and this has led to higher three-month LIBOR rates.  We doubt this level of LIBOR will be sustained over time, and so the U.S. side of the interest rate spread should ease.  In addition, German LIBOR rates have been negative for the past few months.  We doubt the ECB will maintain negative rates much longer and instead use QE for monetary stimulus.  Thus, we would expect the spread to narrow in the coming weeks.

In addition, there has been a marked change in market expectations toward FOMC monetary policy.

This chart shows the spread between the fed funds target and the two-year deferred Eurodollar futures contract.  The latter shows the market’s projection for future three-month LIBOR rates.  For much of the past two years, Eurodollar futures were projecting a terminal rate for fed funds of 1.50%; that has now declined to around 75 bps.  Simply put, the financial markets expect perhaps one or two more rate hikes over the next two years.  If this is all we get, we would expect the rate differentials between Germany and the U.S. to steadily contract.

It is worth noting that the current strength of the dollar appears based on the policy spread in 2014-15.  If so, once the market adjusts to a lower terminal fed funds target, we would expect some dollar weakness to develop.  In the second half of next year, a USD/EUR of 1.25 (a USD/DMK of 0.6410) would be likely.  A weaker dollar would be supportive for equities and commodities and bearish for debt and foreign equity markets, although this weakness would be partially offset by stronger foreign currencies.  In addition, emerging equities usually strengthen relative to developed markets when the dollar weakens.  Thus, in our asset allocation models, we have been slowly adding commodities and emerging equities to portfolios.  If the dollar weakens in 2017, we would likely build on these initial positions.

View the PDF

______________________

[1] Since 1970, the average spread between the U.S. and Germany is 69 bps, suggesting the current spread of 119 bps is rather wide.  However the standard deviation is 235 bps, meaning the current spread is within the normal range.