Daily Comment (December 16, 2016)

by Bill O’Grady, Kaisa Stucke, and Thomas Wash

[Posted: 9:30 AM EST] With the release of CPI data, we can update our versions of the Mankiw rule model, incorporating the recent rate changes by the FOMC (we assume December’s data will be close to November’s releases).  This model attempts to determine the neutral rate for fed funds, which is a rate that is neither accommodative nor stimulative.  Mankiw’s model is a variation of the Taylor Rule.  The latter measures the neutral rate by core CPI and the difference between GDP and potential GDP, which is an estimate of slack in the economy.  Potential GDP cannot be directly observed, only estimated.  To overcome this problem, Mankiw used the unemployment rate as a proxy for economic slack.  We have created four versions of the rule, one that follows the original construction by using the unemployment rate as a measure of slack, a second that uses the employment/population ratio, a third using involuntary part-time workers as a percentage of the total labor force and a fourth using yearly wage growth for non-supervisory workers.

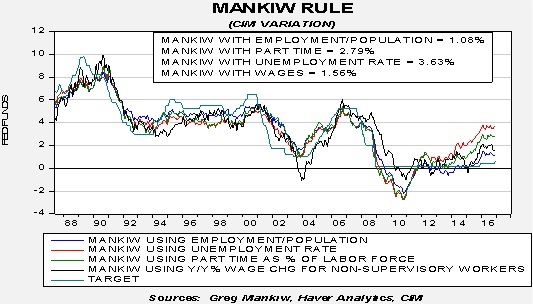
Using the unemployment rate, the neutral rate is now 3.63%.  This rate rose 13 bps due to the drop in the unemployment rate, offsetting a modest decline in core CPI.  Using the employment/population ratio, the neutral rate is 1.08%, down 5 bps.  Using involuntary part-time employment, the neutral rate is 2.79%, up 6 bps due to the decline in this measure of employment (fewer workers were forced to accept part-time employment when they preferred full-time employment).  And, for the new model, the neutral rate is 1.56, down 15 bps on continued sluggish wage growth.  What is interesting is that the model rate fell for the employment/population variant and for the wage growth measure as well.  On the other hand, the variants using involuntary part-time employment and the unemployment rate have increased.

It is still uncertain which of these variants best reflects slack (or lack thereof) in the economy.  Although we tend to think that wage growth or the employment/population ratio is the best measure of slack, the key is what policymakers view as the most consistent with measuring slack.  At this point, we don’t know, although we think the hawks are probably relying on the unemployment rate variant while the chair probably believes the involuntary part-time employment variant is the best measure.  The involuntary part-time employment variant is most consistent with six rate hikes over the next 24 months.  That path would bring the policy rate near neutral; however, if they are wrong and, for example, the employment/population ratio is actually correct, then policy will be overly restrictive (assuming that ratio doesn’t improve dramatically).  Thus, the FOMC is moving rates higher in a slow fashion to allow them time to adjust if it turns out there is more slack (reflected by the lower neutral rate variants) than some data would suggest.  Of course, by going slow, assuming the higher neutral rate variants are correct, the Fed could keep policy overly accommodative longer than it should.  As long as the economy remains globalized and deregulated enough to allow for the nearly unfettered introduction of new technology, being late isn’t all that risky.  That’s why the incoming President Trump and his potential to put up trade barriers is a key issue for policymakers.

The CNY continues to weaken.  This is consistent with the steady decline in foreign reserves.

(Source: Bloomberg)

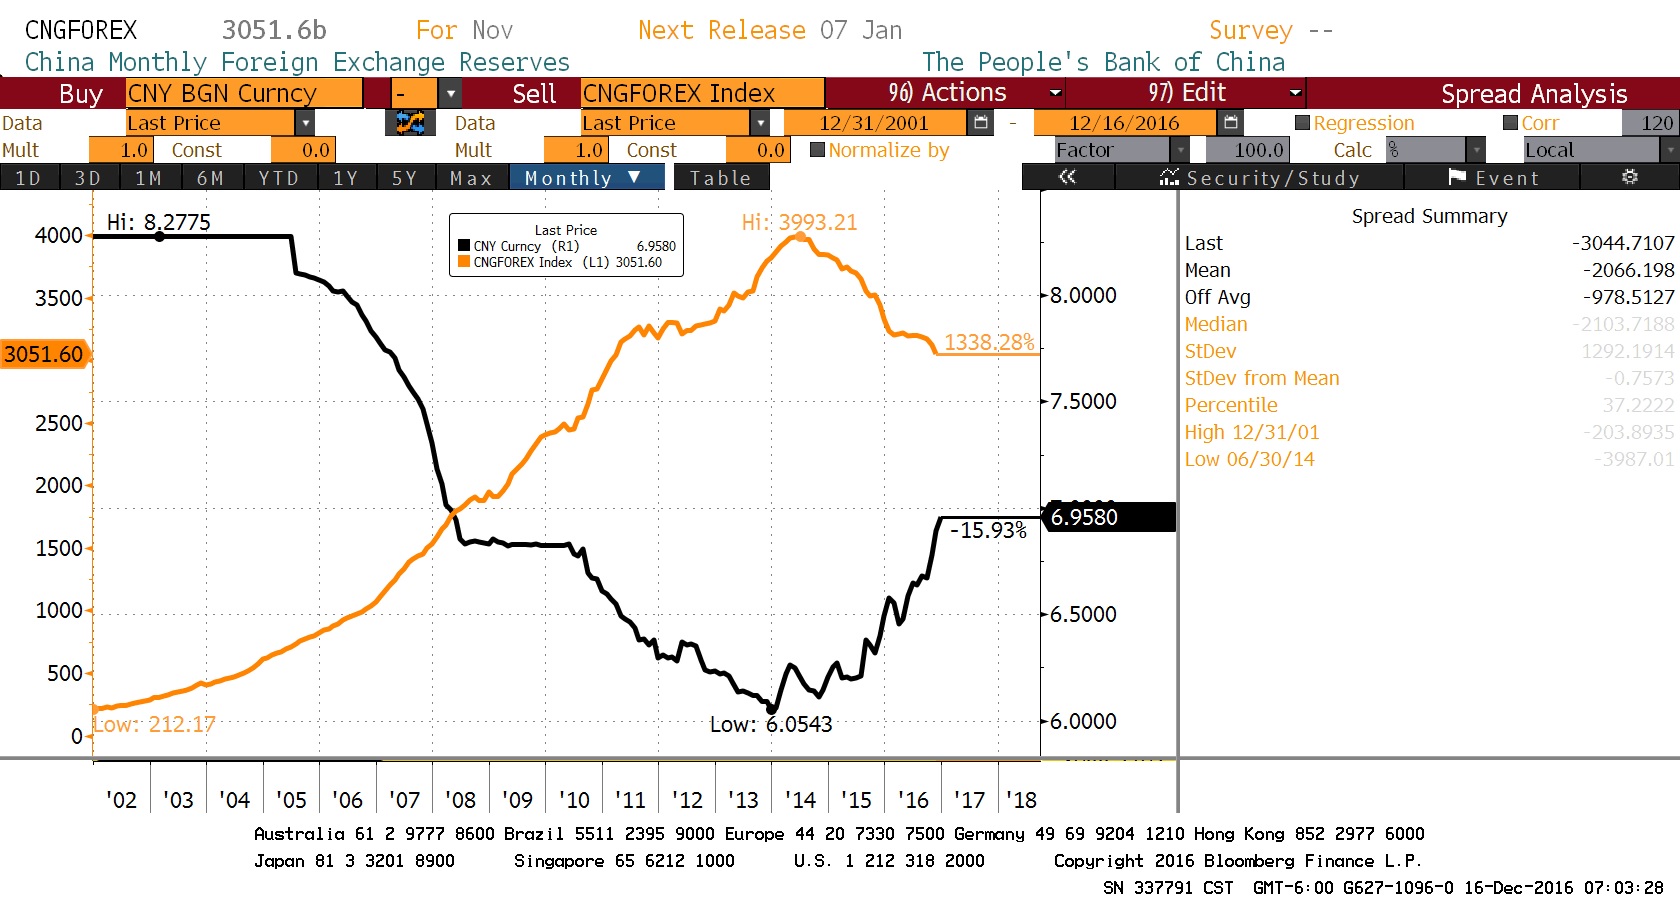
This chart shows the CNY/USD (black line) and the level of reserves (gold line).  The former is in CNY per USD, meaning the lower the value the stronger the Chinese currency.  Since reserves are calculated in dollars, to the extent that China holds reserves in other currencies a stronger dollar will lead to falling reserves.  The key unknown in this graph is which variable is independent; is the CNY weakening due to falling reserves or are reserves declining because of currency weakness?  In reality, the relationship is “reflexive,” a concept discussed often by George Soros.  Simply put, the direction of causality changes over time.  At present, we believe that reserves are leaving China because citizens are, for a number of reasons, wanting to invest overseas.  This is putting downward pressure on the CNY.  We know the PBOC is propping up the CNY, likely fearing that it may encourage faster capital flight if the depreciation accelerates (thus, the reflexive nature of the problem).  We see the CNY’s weakness as inevitable; U.S. monetary policy by itself will probably lead to that outcome.  However, political uncertainty in China is likely playing a role in capital flight, creating a negative feedback loop.  The main concern is whether it could trigger a financial crisis if reserves continue to leave China.  That is one of the key risks for 2017.

View the complete PDF

Daily Comment (December 15, 2016)

by Bill O’Grady, Kaisa Stucke, and Thomas Wash

[Posted: 9:30 AM EST] The Fed gave us a modest hawkish surprise, calling for three rate hikes in 2017 rather than two.  That was taken as bearish by the financial markets yesterday with Treasury yields rising, equities declining and the dollar rising.  U.S. equities are mostly flat this morning, but the dollar is sharply higher and Treasury yields are continuing to rise.

Here is the dots plot from September.

(Source: Bloomberg)

Note the purple line, which is the LIBOR-OIS curve from yesterday.  It has jumped from where it was on the meeting date in September, shown by the red line.

Now, the current dots plot.

(Source: Bloomberg)

For 2017, the median forecast is currently 1.375%, up from 1.125% in September.  For 2018, the median is up to 2.125% from 1.875%.  Two participants see no change next year but one of those is probably St. Louis FRB President Bullard, who has decided not to participate in the dots procedure.  Although the market expectations continue to lag, we did see the LIBOR-OIS rate rise to 1.25% from 0.875% in September.

This can be seen in the deferred Eurodollar futures.

The jump in yields since Trump’s election has been striking.  We are approaching the highest level of implied rates since the “taper tantrum.”  This rise triggered the onset of the dollar rally in mid-2014 and we note that the dollar has been rising since the election.

The fuchsia dots represent yesterday’s report.  It is important to note that the dots have stopped their steady progression to lower levels.  For better or worse, the path of policy expectations from the dots suggests that the FOMC is becoming comfortable with this path of hikes.

So, unexpectedly, the FOMC was hawkish yesterday.  It is projecting three hikes in 2017 and 2018.  As the dots chart history shows, what tends to occur is that rate forecasts fall as time passes.  That pattern appears to have stopped.  Normalization of monetary policy appears to be accelerating.  Adding to the hawkish tone was a warning of sorts from Chair Yellen who, in the press conference, downplayed the need for fiscal stimulus, a key element of the Trump platform.  Thus, if Trump is able to push through a significant stimulus package, it is possible the FOMC could become even more hawkish.

Although the reaction in Treasuries is remarkable, the dollar’s rally is equally impressive.  Here is one of the key reasons why.

(Source: Bloomberg)

This chart shows the spread between the U.S. and German two-year sovereigns.  The spread has widened to its highest level since the late 1990s.  By 2000-01, the €/$ exchange rate had fallen well below parity.  If this rate spread persists, the dollar will rise further and act as a policy tightening.

We have been closely monitoring the evolution of the incoming Trump presidency to see which constituent group he will favor.  Colloquially, we have framed this as Bannon v. Ryan, although Chief of Staff Preibus is a key player as well.  Preibus did an interview with conservative radio host Hugh Hewitt yesterday where he suggested that Trump’s primary agenda will be to change the Affordable Care Act (ACA) and tax cuts.  Politico reported that a “surprising” number of Democratic lawmakers are “open” to replacing the ACA, probably because so many Democratic Party senators are up for re-election in 2018.  At the midterms, 25 Democrats are facing re-election and 10 of those states were won by Trump.

What appears to be shaping up is that the GOP establishment is planning to radically change the ACA in return for tax cuts, assuming that Obamacare will be popular with right-wing populists.  This has the potential to be a major mistake.  Although the ACA isn’t popular, it may not be for the reasons the establishment thinks.  The establishment seems to believe the unpopularity is because of the government’s interference in medical care; more likely, it’s because the ACA didn’t produce what populist America really wanted, which is unlimited free health care.  Gutting the ACA and leaving lower income Americans without health care could prove to be a disaster for the GOP.  And, tax cuts won’t really help the bottom 80%.

We want to stress that President-elect Trump is capable of aggressive shifts in policy.  He could surprise the establishment and press for trade restrictions and infrastructure spending after all, but pushing a populist agenda with the cabinet he has constructed so far may be difficult.  If he disappoints the populists, 2020 could be another change election.

In our recently published 2017 Geopolitical Outlook we warned of a series of elections in Europe that could lead to further populist power in the region.  Another may be brewing.  Greece is in the midst of an impasse with its creditors and the European Stability Mechanism leadership has frozen its payments on a €86 bn support package.  The Tsipras government implemented a series of social spending measures and, in response, the EU has suspended support.  If the economy collapses, we could see snap elections and perhaps the decision by Greece to exit the Eurozone.

U.S. crude oil inventories fell 2.4 mb compared to market expectations of a 1.5 mb draw.

This chart shows current crude oil inventories, both over the long term and the last decade.  We have added the estimated level of lease stocks to maintain the consistency of the data.  As the chart below shows, inventories remain elevated.

The annual seasonal pattern suggests inventories should decline into year’s end.  This week’s data is consistent with that relationship.

Based on inventories alone, oil prices are overvalued with the fair value price of $41.25.  Meanwhile, the EUR/WTI model generates a fair value of $36.82.  Together (which is a more sound methodology), fair value is $37.49, meaning that current prices are well above fair value.[1]  OPEC has managed to lift prices but maintaining these levels will be a challenge given the dollar’s strength and the continued elevated levels of inventory.

View the complete PDF

_________________________________

[1] The reason the combined model is calculating a fair value price below the individual models for the euro and oil stocks is due to the fact that the euro and oil stocks are collinear.  In other words, the euro and oil stocks are correlated at -88.8%, meaning a weaker euro usually means higher oil stocks.  The fact that oil inventories are falling into a weakening euro is unusual.

Daily Comment (December 14, 2016)

by Bill O’Grady, Kaisa Stucke, and Thomas Wash

[Posted: 9:30 AM EST] It’s FOMC day!  The statement comes out at 2:00 EST with the press conference a half hour later.  We will also get new forecasts and a refreshed “dots” plot.  Market expectations call for a “dovish tightening,” where the FOMC raises rates by 25 bps and signals 50 bps, at most, for next year.  We don’t expect any comments about fiscal policy in the statement.  Chair Yellen will almost certainly get asked about this during the press conference and her most likely response will be that the FOMC will adjust to whatever effects fiscal policy has on the economy and make it clear that the central bank won’t preempt any fiscal changes.

These four charts show one of the key problems the FOMC faces.  The chart in the upper left shows the relationship between yearly wage increases for non-supervisory workers and core CPI from 1965 to 1990 (all four charts are scaled to this particular one).  This is the period when all of the current members of the FOMC completed their educations.  The linear relationship is clear; rising wages coincide with rising inflation.  The best fit line suggests that 4% wage growth leads to inflation just above 4%.  The other three charts show the behavior of these variables over the past three recoveries.  In two of the recoveries, the relationship is actually inverse; rising wages coincide with weaker inflation.  In the 2001-07 expansion, the relationship fits the theory of the Phillips Curve but the slope has clearly flattened; 4% wages barely bring inflation higher than 2%.  What has changed?  Why did the Phillips Curve relationship seem to exist before the 1990s change?  We believe globalization and deregulation changed the nature of the relationship between wages and inflation, essentially breaking the link.  And so, in line with this position, the Phillips Curve relationship began breaking down by the 1980s.

By the Reagan years, the Phillips curve had mostly flattened.  If rising wages are the independent variable in the relationship between wages and prices (as suggested by the Phillips Curve), then it hasn’t really been operative since 1980.  Still, the Phillips Curve remains one of the primary factors in the Fed’s view of monetary policy.  The bottom line here is that there isn’t much urgency for the FOMC to raise rates and thus we suspect they will continue to move slowly, which will be supportive for the economy and risk assets.

View the complete PDF

Daily Comment (December 13, 2016)

by Bill O’Grady, Kaisa Stucke, and Thomas Wash

[Posted: 9:30 AM EST] The FOMC begins its meeting today.  Tomorrow we expect to see a 25 bps rate hike and little, if any, change to the structure of the dots plot.  These expectations are based on the idea that, like all of us, the FOMC doesn’t know exactly what changes will be made to fiscal and monetary policy, and so moving policy expectations based on what policymakers think might happen is fraught with risk.  Thus, we look for mostly a status quo event tomorrow.

We have been avoiding commentary on President-elect Trump’s selections for his administration.  This is because the individual selections are not as important as the pattern and we needed to see more appointments to get a feel for how this new government is going to be structured.  This morning, Exxon (XOM, 90.98) CEO Rex Tillerson was named as the incoming president’s selection for Secretary of State, with former Texas Governor Rick Perry for Energy Secretary.  Here are a few thoughts on what we have seen so far.

Oil and natural gas production will be favored: The new Secretary of Energy was the governor of a major oil-producing state, and the head of the Environmental Protection Agency is the attorney general of Oklahoma, another major oil-producing state.  Now, the Secretary of State is coming from the oil industry.  Oil drilling and exploration looks to be favored in the Trump government.

Lots of brass: Military figures are prominent in the Trump administration.  As noted in yesterday’s 2017 Geopolitical Outlook, the plethora of generals probably indicates a return to the Powell Doctrine, which, in a nutshell, means fewer military adventures and if conflicts do occur they will be well defined and delivered with overwhelming force.  Simply put, we strongly disagree with some commentators who argue that the presence of military figures means more wars.  These appointees know firsthand the human costs of warfare and won’t take it lightly.

The populists, so far, are behind: We have been characterizing the internal conflict for the heart and soul of Donald Trump as a war between Speaker Ryan and Senior Counselor Bannon.  So far, Steve Bannon holds the only senior position going to someone outside the political and economic establishment.  However, that doesn’t mean the populists are finished.  We believe that to be successful Trump will need to address issues that both constituents want.  Part of the financial market’s positive sentiment seems to be coming from the idea that populist policies, such as restrictions on trade and immigration, won’t be significant.  It’s probably too soon to take that position but, given the imbalance of selections, it isn’t unreasonable to believe the populists have lost.  That may be true but, again, it’s likely too soon to determine.

We look for a quiet trade today in front of the FOMC meeting; the statement will be released at 1:00 EST tomorrow with a press conference soon after.

View the complete PDF

Weekly Geopolitical Report – The 2017 Geopolitical Outlook (December 12, 2016)

by Bill O’Grady

(This will be the last WGR for 2016.  The next report will be published on January 9, 2017.)

As is our custom, we close out the current year with our outlook for the next one.  This report is less a series of predictions as it is a list of potential geopolitical issues that we believe will dominate the international landscape in the upcoming year.  It is not designed to be exhaustive; instead, it focuses on the “big picture” conditions that we believe will affect policy and markets going forward.  They are listed in order of importance.

Issue #1: The Trump Doctrine

Issue #2: European Elections

Issue #3: The Fall of Islamic State

Issue #4: China’s Financial Situation

View the full report

Daily Comment (December 12, 2016)

by Bill O’Grady, Kaisa Stucke, and Thomas Wash

[Posted: 9:30 AM EST] The two major news items this morning are OPEC and China.  First, OPEC managed to procure pledged cuts of 558 kbpd from non-OPEC producers.  This is the first time since 2001 that the cartel has managed to get production cut pledges from producers outside of OPEC.  It is reasonable to assume that few of these reductions will materialize.  However, the real story is that the Saudis hinted they may cut more than their current promise, suggesting the kingdom is committed to driving oil prices higher.  In fact, Saudi Oil Minister Khalid Al-Falih signaled that his country would be willing to cut production below 10 mbpd, which is below the current official production target.  This is sort of a “whatever is necessary” move to drive prices toward $60 per barrel.  Although there are always doubts about an OPEC deal, there have been successful agreements in the past and the common element is a strong commitment from Saudi Arabia.  Thus, the agreement does look substantial.

This doesn’t mean that there won’t be bearish issues for oil that may develop.  First, we will likely see a rebound in U.S. shale production.  The industry has been working hard to reduce production costs and production will likely rise with prices well above $50.  Second, rising oil prices will trigger changes in both inflation expectations and actual inflation, which will tend to push the Fed to tighten credit faster.  Since the mid-1990s, oil prices have tended to lead core CPI by about 18 months.  Oil prices in January 2016 averaged $31.67 per barrel.  If oil prices hold near current levels into January, the yearly change will exceed 64%.  As the Fed raises rates it will slow economic growth and boost the dollar.  Since the mid-1990s, the dollar and oil have been correlated at -62% (y/y% change).  Dollar strength will be a headwind for oil prices.  Third, despite the euphoria, U.S. oil inventories remain elevated.  One way to address this overhang would be a rise in oil exports, which we would anticipate.  Although that will help balance the oil market, it requires a loss of market share for OPEC.

In the short run, we expect oil prices to remain supported into next year.  The Saudis appear committed to a deal and seem to be targeting $60 per barrel.  We think we will get there, but staying there will be difficult.

On China, President-elect Trump suggested that he is not necessarily bound by the “one-China” policy.  This comment has led to handwringing in Beijing and inside the Beltway in Washington.  We suspect Trump is signaling to China that the relationship between the two nations is headed toward a restructuring.  Just because a relationship has been in place for a long time doesn’t mean it has become sacred.  What Trump has to consider is that the PRC views Taiwan as a breakaway province; any move toward independence is thus a secession and grounds for civil war.  Given that we don’t have a foreign policy apparatus around the incoming president yet, it is still too early to get too exercised over this matter.  But, it appears to us that Trump is making it clear that the relationship between the two states is going to be renegotiated and China should prepare itself for a new structure.  And, fitting with Trump’s position favoring complete flexibility, he is signaling that he won’t necessarily be bound by previous constructs.

This news isn’t being taken well in China as seen by the weak performance of Chinese equities.  Although reports that Chinese insurance firms will be restricted from investing in equities are partly to blame, we suspect uncertainty with regard to foreign policy and rising rates are weighing on sentiment as well.  This uncertainty coupled with pressure from rising U.S. interest rates and capital flight are raising concerns among Chinese policymakers.  We note that today’s NYT is carrying a report that peer-to-peer lending technology is leading Chinese middle class investors to projects in the U.S.[1]  Although we suspect that, in the end, China and the U.S. will continue the one-China policy, Trump does appear to be using it as a bargaining chip.

In other news, Italian banks are trying to raise capital, although the likelihood of success looks low.  The Italian foreign minister, Paolo Gentiloni, has been given the mandate from the president to form a new government.  It appears he will be able to use Renzi’s administration to continue governing for now, but we would not be surprised to see elections held sometime next year.

The FOMC meeting concludes on Wednesday with a press conference—the upcoming FOMC meeting is important.  The baseline expectation is that the Fed will raise rates by 25 bps and probably continue to signal a steady path toward higher rates.  Given recent growth numbers, we would not expect any dissents from the doves.  We will be watching for any indication that the path for policy next year will remain about as the market has discounted (roughly two hikes of 25 bps each next year), or something quicker.  We suspect the statement and the press conference will continue to signal a slow glide toward higher rates, but we would not be shocked to see or hear promises to move faster if conditions warrant.

Finally, since the early 1990s, consumer sentiment and investor sentiment have been closely linked.

This chart shows the University of Michigan consumer confidence data with the Shiller P/E.  Since the early 1990s, the two have been correlated at +78%.  The recent rise in confidence is supportive for higher equity values.

View the complete PDF

_______________________________

[1] http://www.nytimes.com/2016/12/11/business/dealbook/china-small-investors-us-money.html?emc=edit_ee_20161212&nl=todaysheadlines-europe&nlid=5677267

Asset Allocation Weekly (December 9, 2016)

by Asset Allocation Committee

The rapid rise in longer duration Treasury yields since the presidential election has been surprising.  As of December 8, the 10-year T-note yield was approximately 2.40%.  Although President-elect Trump’s policies will probably be inflationary, it is still unclear how much of his arguably vague plans will get passed.  It is possible the FOMC will become more hawkish and we have seen some increase in rate hike expectations.[1]  Still, our 10-year T-note model is putting the fair value yield at 1.85%.  Assuming fed funds at 1.25% still only raises the 10-year rate to 2.20%.  Taking oil to $60 and assuming the 1.25% fed funds only raises the fair value yield to 2.27%.  Only when assuming steady oil, fed funds at 1.25% and German bunds at 1.25% (up from the current 33 bps) does the yield even reach 2.40%.  The current spike in yields can be best justified by assuming a significant jump in inflation expectations.

In our yield model we use the 15-year average of CPI as a proxy for inflation expectations.  This assumption comes from the work of Milton Friedman, who postulated that inflation expectations are derived over a long-term time frame.  We realize our calculation is a proxy but have refrained from using more market-based expectations because of their lack of predictability.  If one assumes that nominal rates are the sum of the expectations of real rates plus inflation forecasts, inflation forecasts are very important to predicting nominal interest rates.

If the lifetime experience of inflation is important, then what is the most important age?  We estimate that 60 is a reasonable age; the average age of the Senate is 61 years, the current FOMC average is 62 and the average age of an S&P 500 CEO is 57.[2]  Simply put, it’s around the age of 60 that people come into power in politics and business.  We believe that their personal experiences color the expectations of any investor and so using 60 as an influential age makes sense.

This chart shows the adult experience of inflation for a person turning 60 from 1932 to the present.  To reflect the adult experience, we use the average annual change in CPI from ages 16 to 60.  Note that inflation experience rose into the late 1940s and stabilized into 1960, when it fell sharply.  This was the generation that entered adulthood during the Great Depression.  It is interesting to note that as rates began to rise in the mid-1960s, the inflation experience steadily rose as well.  Essentially, the rise in rates coincided with the rise in inflation experience.  However, after peaking in 1981, bond yields began a steady drop into the current year despite the relatively high level of inflation experience.  On the other hand, T-note yields exceeded the inflation experience of 60-year-olds in absolute terms until 2002.

This chart shows the actual inflation rate compared to an average 60-year-old’s adult experience of inflation.  In general, bull markets in bonds tend to occur when the actual inflation rate is persistently below the average rate.  Bear markets happen when the opposite condition is in place.  Currently, the actual inflation rate is still well below the average rate, suggesting that the bull market in bonds should have more time to run.  However, our worry is that the average 60-year-old is unusually sensitive to inflation fears and thus may overreact to the incoming president’s policies.  In other words, inflation expectations may become unanchored rather quickly, forcing the Federal Reserve to turn unexpectedly hawkish.  Thus, we are taking a more cautious stance on fixed income into 2017, expecting higher yields and greater duration risk.  At the same time, we will be closely monitoring the economy in light of less accommodative monetary policy.  Most recessions occur because the Fed tightens too much.  We don’t expect that to become a problem until late next year or early 2018 if the Fed continues to raise rates.  So, for the upcoming year, we expect a weak fixed income environment.

View the PDF

_______________________

[1] For example, the two-year deferred Eurodollar futures, which measure three-month LIBOR two years into the future, have jumped nearly 50 bps since the election.

[2] http://fortune.com/2015/12/13/oldest-ceos-fortune-500/

Daily Comment (December 9, 2016)

by Bill O’Grady, Kaisa Stucke, and Thomas Wash

[Posted: 9:30 AM EST] BREAKING NEWS:  The ECB has rejected a request by the troubled Italian bank Monte dei Paschi (BMDPY, $0.18) for an extension of the deadline for the bank to raise more capital.  Italian banking authorities had requested more time to complete a €5 bn rescue package but the ECB has indicated that it doesn’t believe an extension will change the likelihood of a successful bailout.  This action by the ECB all but insures the Italian government will need to bail out the bank, but according to EU rules, equity and bond holders must absorb the first losses.  The sticking point is that there are €2.1 bn of subordinated bonds that were sold to retail investors; if these investors suffer losses, the political fallout will be massive.  We suspect that Italy will allow institutional bond and equity holders to suffer losses but attempt to reimburse the retail bondholders.  However, sparing the small bondholder may not be possible.   We have seen the EUR weaken on the news.

The other major political news emerged from South Korea where President Park was impeached by the legislature.  The motion needed 200 votes in the legislature, a two-thirds majority; it passed with 256.  Park is now suspended and her duties will be assumed by PM Hwang Kyo-ahn.   If all goes according to plan, new elections will be held 60 days after she officially leaves office.  Park has offered to resign, and so in the wake of her impeachment, if she does quit, the clock starts.  On the other hand, without Park’s resignation, the impeachment isn’t official until the Constitutional Court ratifies the measure within the next 180 days.  Thus, in theory, South Korea could be without an official president for 240 days. We suspect this won’t be the case and new elections will occur soon.

OPEC holds meetings with non-OPEC members over the weekend.  Although there are residual concerns that the deal could still fail (the Saudis have indicated they won’t cut if non-OPEC members fail to cut output by 0.6 mbpd), we suspect a deal will get done and promises will be made even if no actual reductions occur.  Reuters is reporting that Saudi Arabia has already announced cuts to U.S. and European buyers, although no reductions are planned for Asia, the new area where OPEC and Russia are vying for market share.  In reality, we don’t expect material cuts from non-OPEC members and cartel compliance will lag.  However, it will take a while for that reality to set in which means oil prices will likely remain richly valued.

Yesterday, the Federal Reserve released the Financial Accounts of the United States report for Q3, which more senior readers will remember as the “Flow of Funds” data.  This is a remarkably rich report, full of insights as to the health of the economy.  The following charts are some of the ones we found most interesting.

Net worth as a percentage of after-tax income rose to 638.8% from 633.9% in Q2.  This number remains elevated and does reflect higher values for homes and financial assets.

Owners’ equity in their homes rose to 57.3%, up from 56.8% in Q2.  History would suggest that the average homeowner will consider equity of 60% as normal and once this is achieved, we would expect to see greater confidence in real estate.

Household deleveraging has clearly slowed but releveraging has not started.

Household debt as a percentage of after-tax income fell to 100.1% from 100.4% over the quarter.  As a percentage of GDP, household debt declined to 78.4% from 78.7%.  Household liabilities are rising at a slow pace.

Prior to the Great Financial Crisis (GFC), four percent growth was rarely seen at the trough of recessions.  Negative growth has not been part of the postwar experience until the GFC and although households are adding to debt, it is clearly at a slow pace.

Finally, net saving is showing a rather interesting trend; business dissaving fell but foreign saving declined as well.

This chart shows net saving as a percentage of GDP.  Business dissaving usually translates into investment, although this quarter most of the dissaving has gone to share buybacks and dividends.  The decline in foreign saving reflects a narrowing trade deficit.  If President-Elect Trump is trying to recreate the pre-1980 America, household saving will need to rise dramatically and the trade deficit will also need to drop.

View the complete PDF

Daily Comment (December 8, 2016)

by Bill O’Grady, Kaisa Stucke, and Thomas Wash

[Posted: 9:30 AM EST] The ECB gave us a modest surprise this morning by announcing a tapering of QE.  Expectations called for an extension of the current program through September.  Now, through March 2017, the bank will purchase €80 bn of bonds; from April to December, the bank will purchase €60 bn per month.  So, we are getting a smaller amount of bonds purchased but for a longer period of time.  The total purchases actually rise (the new program buys €540 bn compared to expectations of €480 bn).  Rates were left unchanged.  The EUR rallied briefly but has since reversed.  The German Bund rose 8 bps to 43 bps.

At the time of this writing, ECB President Draghi has completed his formal comments and is in the Q&A session.  His formal comments were quite dovish.  He suggested that QE could be extended and expanded if necessary, and he has refused to describe today’s ECB decision as “tapering.”  His definition of tapering, in response to a question, is a gradual reduction of purchases with the goal of ending QE.  Thus, by this definition, the ECB is probably a long way from ending QE.

Here are a few charts to show market reaction.

The EUR did spike but rapidly reversed.

(Source: Bloomberg)

Longer duration yields rose, although we have seen some reversal.

First, German bonds:

(Source: Bloomberg)

Second, U.S. 10-year T-notes:

(Source: Bloomberg)

Overall, we view ECB policy as dollar bullish, EUR bearish and equity bullish.  The markets are taking the move as bond bearish, but we think that markets will conclude as the day wears on that the bank’s move isn’t all that bearish for bonds, either.

There was a large oil industry transaction overnight.  Russia announced that it has sold a 19.5% stake in the state-controlled Rosneft (RUB 375.80) to Glencore (GLEN, 305.60 GBX) and to the Qatar Investment Authority.  We won’t go into the details of the transaction (see footnote),[1] but our interest lies in whether or not this transaction violates sanctions that are currently in place.  Since there are no U.S. firms involved, it is possible that the deal will skirt sanctions.  On the other hand, both buyers probably touch the U.S. financial system and could face an American reaction.  This will be an interesting test for both the Obama administration and the incoming Trump administration.  We would not be surprised to see a protest from the Obama government and perhaps an attempt to interfere with the deal.  We have no idea what Trump will do.

The other interesting issue with this sale is that it explains why Russia was so supportive of an oil output deal.  Driving up oil prices makes the sale more attractive.  Now that the deal is done, it will be interesting to see if Russia is as supportive of production cuts.

U.S. crude oil inventories fell 2.3 mb compared to market expectations of a 1.5 mb draw.

This chart shows current crude oil inventories, both over the long term and the last decade.  We have added the estimated level of lease stocks to maintain the consistency of the data.  As the chart below shows, inventories remain elevated.

The annual seasonal pattern suggests inventories should decline into year’s end.

Based on inventories alone, oil prices are overvalued with the fair value price of $40.31.  Meanwhile, the EUR/WTI model generates a fair value of $38.78.  Together (which is a more sound methodology), fair value is $37.41, meaning that current prices are well above fair value.[2]  Although we expect the oil market to give OPEC the benefit of the doubt, some period of consolidation at these levels would make sense.

View the complete PDF

_______________________________

[1] http://www.wsj.com/articles/glencore-qatar-buy-stake-in-russian-oil-producer-rosneft-1481143830?mod=wsj_nview_latest

[2] The reason the combined model is calculating a fair value price below the individual models for the euro and oil stocks is due to the fact that the euro and oil stocks are collinear.  In other words, the euro and oil stocks are correlated at -88.8%, meaning a weaker euro usually means higher oil stocks.  The fact that oil inventories are falling into a weakening euro is unusual.