Daily Comment (May 1, 2017)

by Bill O’Grady, Kaisa Stucke, and Thomas Wash

[Posted: 9:30 AM EDT] It’s May Day, the international labor day.  As noted above, a large number of financial markets are closed today, including China and most European markets.  Direct news flow is less than normal due to the closed markets.  Here are the items of note:

See you in September: Congressional negotiators reached an agreement to fund the government into autumn when the debt ceiling will be hit and a broader spending package will be required.  The vote is expected to be held early this week.  There is $12.5 bn of new military spending and $1.5 bn for border security, although no wall money was allocated.  The border spending only covers technology and repair to existing structures.  Democrats were able to spare spending for Planned Parenthood, money to pay for Medicaid for Puerto Rico and a modest $100 mm for opioid addition reduction.

China’s PMI data a bit soft: China’s PMI data came in a bit soft at 51.2.  We have been watching steadily tightening policy in China and this may be an early sign that policy is starting to “bite.”

(Source: Bloomberg)

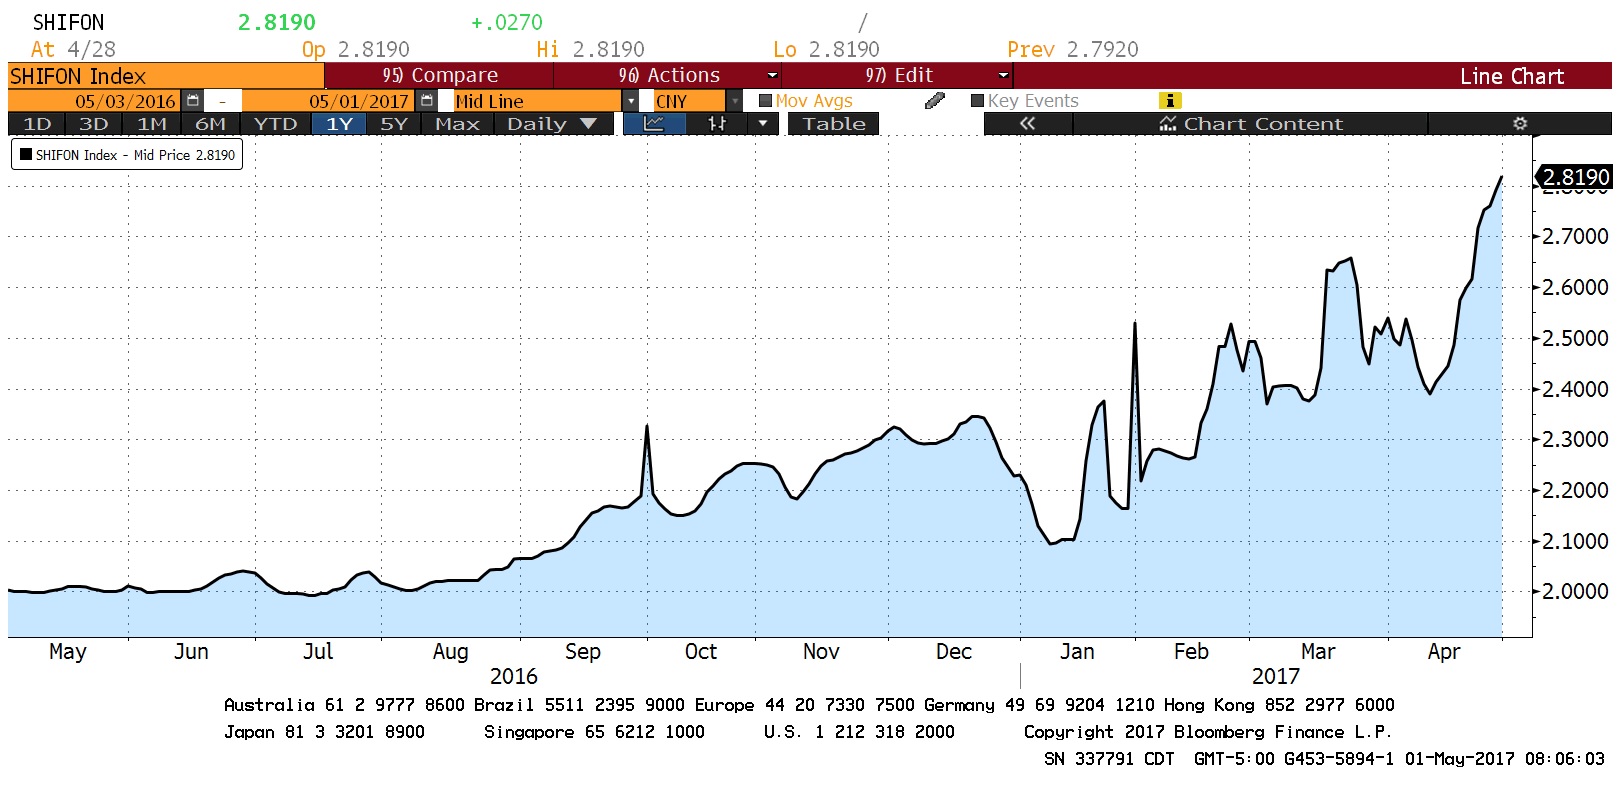
This chart shows the overnight Shanghai LIBOR.  Since the January trough, rates are up just over 70 bps.  It is something of a surprise that policymakers are tightening policy into the October CPC meetings.  We have speculated that Chairman Xi wants to see a robust economy as he kicks off his second term.  The best explanation for tightening policy is growing concern over rising debt and non-performing loans.  China can achieve any growth it wants; it has an investment-driven growth model and so debt levels are the only constraints.  The problem with determining debt capacity is that it really can’t be established ex ante; it can only be established ex post.  In other words, the debt limit is discovered when a debt crisis occurs.  Until the crisis, no one really knows.  It is no great secret that China needs to change its model to drive growth from consumption.  The transition will (a) mean periods of lower growth, and (b) weaken the power of those who have benefited from the current investment model.

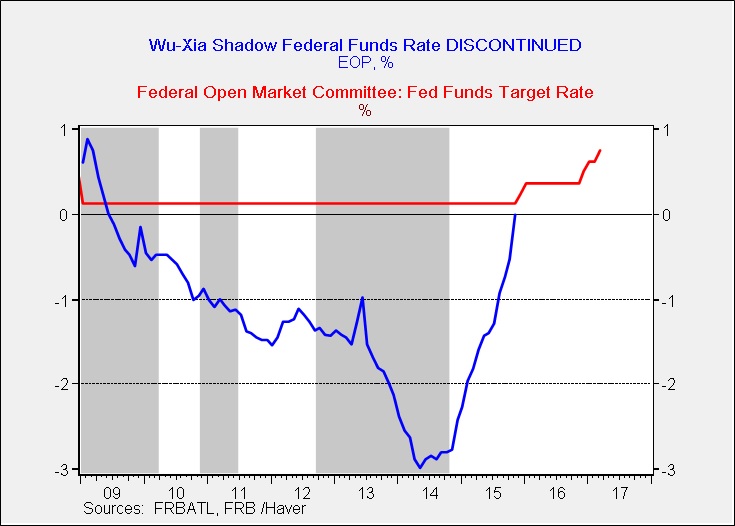
The FOMC meets on Wednesday: We don’t expect any policy changes.  This meeting doesn’t have a press conference and lately the central bank seems to reserve changes for meetings with such conferences.  We will be watching for signs that the FOMC is teeing up for a June rate hike, but a lack of signal doesn’t mean that a hike won’t come.  After all, there wasn’t anything in the January meeting statement that hinted at a March rise.  The financial markets might take the lack of signal as an indicator that a hike is not coming soon, which would probably be a mistake.  We do look for the Fed to acknowledge that some of the economic data has softened, but we also expect the committee to suggest that the slowing is temporary.

Matteo Renzi wins back party leadership: Renzi, the former PM of Italy, stepped down last year when he failed to pass political reform proposals.  He ran to lead the Democratic Party and won the leadership vote with 72% of the ballots cast.  Although Renzi is clearly popular within his party, the populist Five Star Movement continues to lead in the polls with 30% of the electorate.  Similar to the Netherlands, it isn’t clear whether the Five Star Movement can form a government as it’s possible no other party will work with it.  National elections are expected in February 2018; this may be the most risky election for the Eurozone in the next 12 months.

Other European elections: In France, Macron continues to hold a dominating lead.  The latest polls show 60% support for Macron compared to 40% for Le Pen.  Although there are still reasons to worry about Sunday’s election (e.g., preference falsification may be overstating Macron’s support; the wide margin may lead to complacency and a low turnout, which would help Le Pen), overcoming 20 points in less than a week would be unprecedented in modern Western elections.  As we noted last week, Truman overcame such differences but it took him about two months.  We would not be shocked to see a tighter final vote; 55% for Macron to 45% for Le Pen would be a likely outcome, but a Le Pen victory would be a shocker.  Meanwhile, in Germany, the recent gains by Socialist Party candidate Martin Schulz are evaporating as Merkel’s lead has widened by eight points to 37%.  The most likely outcome for forming a government remains a “grand coalition” of the Socialists and the Christian Democrats/Christian Social Union.  The Greens and the Left Party are unlikely coalition candidates and the Free Democrats, often a junior coalition partner for the CDU/CSU, probably won’t get enough votes to form a government.  Still, a Merkel win in September will be seen as good for markets.

Other items: Although the media focus continues around the 100-day mark for the Trump administration, we noted a couple of good weekend editorials.  The NYT carried an op-ed by R.R. Reno suggesting that the Reagan era is over and the GOP is rapidly becoming a nationalist party.[1]  This is a theme we have been discussing since 2014; the U.S. two-party system is one of forced coalitions and these coalitions are currently in flux.  The cosmopolitan elites, who have benefited from globalization and deregulation, are becoming less welcome in the evolving GOP.  We note a comment from The Hill that suggests the political obituaries for Steve Bannon were probably premature; economic nationalism has been a focus of the president’s recent speeches.[2]  The FT noted in a similar op-ed that Sen. Sanders (I-VT) is now the most popular politician in the U.S.[3]  Rana Foroohar notes that voter concerns are mostly economic.  She also notes the leadership of the Democrat Party is remarkably ignoring this trend.  We are reminded of the German sociologist Max Weber who made a distinction between class and status.  Class is determined by income and wealth, while status is the social group(s) to which one belongs.  Since Clinton, the Democrat Party has become less of a party of class and more of a party of status.  In other words, the party has focused on helping a status group’s power through regulation, which gives rise to its focus on racial and gender rights.  However, the Democrats have increasingly ignored class, becoming the party that supports technological disruption.  Status rights are important but, in the current environment, not as important as class.  Donald Trump is recreating the GOP into a working-class party, which may become uncomfortable for some elements of the business class currently in that party’s coalition.  We don’t know how this is going to shake out but it does appear the coalitions are shifting and what defines a Democrat or Republican in the coming years may be much different than what defines them currently.

View the complete PDF

________________________________________

[1] https://www.nytimes.com/2017/04/28/opinion/sunday/republicans-are-now-the-america-first-party.html (paywall)

[2] http://thehill.com/homenews/administration/330987-bannon-reasserts-influence-in-100-days-push

[3] https://www.ft.com/content/b34f5536-2c02-11e7-bc4b-5528796fe35c (paywall)

Asset Allocation Weekly (April 28, 2017)

by Asset Allocation Committee

Last week, we discussed the impact of reducing the size of the Federal Reserve’s balance sheet on stocks and bonds.  This week we will discuss the effects of QE on monetary policy.

The FOMC dropped rates to near zero by January 2009.  Although European central banks (including the ECB) have since taken policy rates below zero, in 2009, the “zero lower bound” was considered to be the lowest rates could fall.  Thus, when the Fed wanted to stimulate further, it felt it could not lower rates below zero.  The U.S. central bank was left with nothing but unconventional policy.  The two policy tools employed at this point were forward guidance and QE.  The former was a clear signal from the Fed that rates would be kept low for the foreseeable future.  The latter was the expansion of the balance sheet.

The problem was that it was difficult to determine how much stimulus these tools generated.  One attempt to answer this question came from the Atlanta FRB.  To estimate the impact of unconventional policy, Wu and Xia used the yield curve to measure the impact on borrowing rates.

Based on their analysis, QE and forward guidance were the equivalent of negative nominal rates of nearly -3.0%.  As tapering set in, the “shadow” rate rose rapidly.  The bank has discontinued calculating the rate, suggesting that once the fed funds target rate leaves the zero floor, the applicability of the shadow rate is reduced.  Essentially, they argue that once rates lift off the zero bound, the shadow fed funds rate is no longer applicable.

Using the shadow rate as a guide, we can get a feel for how much policy has tightened relative to earlier cycles.

This chart shows the effective fed funds rate from 1957 to 1982, the estimated and actual target from 1982 to 2009, the shadow rate (shaded in yellow on the chart) from 2009 to 2015 and a return to the target rate after 2015.  We have then calculated the trough and peak in fed funds tied to the end of each expansion from 1960 through 2008 along with the current cycle using the shadow rate.

(Source: Haver Analytics, CIM)

We have highlighted the current cycle in yellow and excluded it from the average.  To reach the average level that has preceded recessions in the past, the FOMC will need to make around seven more rate hikes of 25 bps.  Excluding the Volcker money-targeting regime years would reduce the average by roughly 125 bps, meaning that the Yellen Fed will be flirting with recession with only two more rate hikes.(Source: Haver Analytics, CIM)

We are quite concerned about this situation because of an unresolved policy debate.  It is unclear if QE stimulation is a function of the level or the change in the balance sheet.  If it’s the level, the balance sheet is quite large; however, if it’s the change that matters, then reducing the balance sheet could create unanticipated risks for the economy and markets.

The balance sheet, scaled to GDP, is off its all-time highs but, at 23.4%, is well above the pre-QE level of 5.8%.  If level is the key determinant of stimulus, then the FOMC can reduce the balance sheet substantially.  On the other hand, the Wu-Xia shadow rate seems to follow the yearly changes in the balance sheet.

Comments from Fed officials clearly signal that policymakers believe the level is the key indicator of stimulus; last week’s report, which compared equity markets to the level of the balance sheet, would support that contention.  However, as the above chart suggests, a case can be made that the change in the balance sheet has an impact as well.

By 2018, it is quite possible the FOMC will have raised rates by another 50 bps and will have started the process of reducing the balance sheet.  The latter policy could tighten monetary policy by an unknown amount.  And, as we noted above, excluding the early Volcker years, two rate hikes may be getting us closer to recession levels than generally believed if the shadow rate accurately represents the actual trough in the policy rate.  It should be remembered that forward guidance was part of the policy as well.  Simply indicating that hikes will occur in the future affects financial markets today.  Although this isn’t an immediate concern, it appears we are gliding into a period of enhanced risk by autumn.  Adding to this issue is that both Chair Yellen and Vice Chair Fischer are expected to leave the FOMC in January.  Depending on who President Trump appoints, we could have a change in the policy stance of the central bank.

We will be watching financial markets closely in the coming months to see how these issues we have raised over the past three weeks will affect the economy and financial markets.  Our concern is that policymakers and markets have never experienced a sustained drop in the Fed’s balance sheet; it may be innocuous or it may be a problem.  History will be of only modest use and thus the potential for a mistake will be elevated.

View the PDF

Daily Comment (April 28, 2017)

by Bill O’Grady, Kaisa Stucke, and Thomas Wash

[Posted: 9:30 AM EDT] Markets were fairly quiet overnight.  The biggest mover was the EUR, which rose after Eurozone CPI came in at 1.9%, a bit higher than forecast.  The financial markets are starting to discount a reduction in stimulus from the ECB, although Draghi’s comments yesterday suggest he is pushing back against any idea that stimulus is about to be removed.  However, the ECB does not have a growth mandate; it is designed, like the Bundesbank, to focus on inflation and the exchange rate and so rising inflation should boost the likelihood that tapering will begin later this year.  Although we have been favorable toward the dollar for some time, further strength is based on much more tightening by the FOMC and fiscal stimulus in the form of tax cuts and infrastructure spending.  It is unclear if or when the fiscal actions will be forthcoming and so the dollar could become vulnerable to weakness in the coming months, especially if the ECB begins to withdraw stimulus.

Yesterday, the president suggested in media interviews that a conflict on the Korean peninsula is possible.  Although we don’t think such an event is imminent, we are watching developments closely.  Earlier this week, all 100 senators came to the White House for a classified briefing on North Korea.  Comments afterward were underwhelming, suggesting little new information was discussed.  The president did make some waves by suggesting the South Koreans should pay for the recent deployment of the THAAD missile system.  This has actually been an issue for years; on numerous occasions in the 1970s, Congressmen suggested that Germany should pay for U.S. soldiers stationed there.  The U.S. exercise of hegemony has generally been rather “light touch” compared to the British colonial system.  The U.S. used its own resources to freeze conflict zones in Europe, the Middle East and the Far East.  However, it has been argued that Nixon’s decision to exit the gold standard in 1971 and create a “dollar-Treasury” reserve standard effectively forces foreigners to partially fund the U.S. fiscal deficit through the process of holding Treasuries as part of the dollar reserve currency system.[1]

President Trump has been alluding to a more overt “billing” of allies for American security.  In last year’s 2017 Geopolitical Outlook, we described this as the “Malevolent Hegemon” model.  So far, he hasn’t made any radical moves but he has clearly signaled that they may be coming.  The erroneous reports earlier this week that the U.S. was pulling out of NAFTA would be an example of such malevolence.  At first, Trump was skeptical of NATO but that appears to have changed.  So far, the malevolent hegemon has been mostly bluster but that could change.

Perhaps the most effective way to address hegemonic concerns is through a weaker dollar.  The best path to a weaker dollar is probably a relatively dovish FOMC.  Given recent retirements and anticipated term expirations, President Trump could fill five of the seven governor positions.  We reported earlier that Randal Quarles was the expected selection for Vice Chair of supervision, but he may have hit a snag.  Fed rules require that no two Fed governors can come from the same Federal Reserve district.  Quarles appears to be from Utah, in the San Francisco district, which is currently represented by Chair Yellen.  CNBC reported earlier this week that Gary Cohn might be a candidate for the chair to replace Yellen, which might free Quarles to be appointed in early 2018 when Yellen is expected to step down.  However, in order for Cohn to ascend, who is from NY, Vice Chair Fischer would also need to resign.  This rule may force the administration to look into the “dark hinterlands” of the Midwest and Southwest for candidates.  Kevin Warsh and Thomas Hoenig were also mentioned in the article.  Warsh would probably be a moderate on policy but Hoenig is a notorious hawk.  Adding Hoenig to the board would likely be dollar bullish.

View the complete PDF

________________________________________

[1] Hudson, M. (2003). Super Imperialism: The Origin and Fundamentals of U.S. World Dominance (2nd ed.). London, England and Sterling, VA: Pluto Press.  First edition published in 1972 by Holt, Rinehart and Winston.

Daily Comment (April 27, 2017)

by Bill O’Grady, Kaisa Stucke, and Thomas Wash

[Posted: 9:30 AM EDT] ECB President Draghi is speaking at the time of this writing.  Nothing has changed in terms of policy, but Draghi’s assessment of the economy is somewhat supportive, although still rather cautious.  Initially, forex markets took his comments as modestly dollar bearish.  However, in the Q&A, Draghi made it clear that no path of tapering has been decided which reversed dollar weakness.  Treasury yields have turned higher in the wake of his comments.  Overall, there wasn’t much to signal that the ECB will be tightening soon and so we are seeing a weakening of the EUR.

The White House sent a scare through the media last night by indicating that the U.S. is preparing to leave NAFTA, which would effectively kill the organization.  However, that leak was quashed; the president did indicate he wanted to renegotiate the treaty but that was his position during the campaign.  It is unclear what triggered the outburst, other than it may have been driven by the desire to make a splash for the 100-day mark.  On this topic, we are not going to make any further comments about the tax proposal until we see more detail and can assess its chances of passage.

U.S. crude oil inventories fell 3.6 mb compared to market expectations of a 1.9 mb draw.

This chart shows current crude oil inventories, both over the long term and the last decade.  We have added the estimated level of lease stocks to maintain the consistency of the data.  As the chart shows, inventories remain historically high.

As the seasonal chart below shows, inventories are near their seasonal peak and begin falling as rising refinery operations lower stockpiles.  This week’s decline puts us further below normal.  Although inventories remain high, this seasonal level is consistent with July, meaning that we may be on the way to an easing of the inventory overhang.  Last year, we saw a draw of roughly 45 mb from the April peak.  Assuming a similar drop from this year’s peak of 566.5 mb at the end of March, we will end up at 520 mb by late September.  Assuming a $1.09 EUR and using the model discussed below, fair value for oil prices is $44.15.  Thus, we would need to see a much larger drop to justify current prices.

(Source: DOE, CIM)

Based on inventories alone, oil prices are overvalued with the fair value price of $30.78.  Meanwhile, the EUR/WTI model generates a fair value of $41.25.  Together (which is a more sound methodology), fair value is $37.39, meaning that current prices are well above fair value.  To a great extent, it appears that the oil market has already discounted a drop in inventories and a weaker dollar.

A key factor lowering inventories is that refinery output is unusually strong.

(Source: DOE, CIM)

This chart shows the level of refinery utilization as a percentage of total capacity.  Last week’s data hit 94%, which is rather high for this time of year.  We do expect a good summer driving season as the economy isn’t in recession and consumer confidence is elevated.  Still, given that gasoline stockpiles are ample, we doubt this level of activity will rise much more from current levels.

On gasoline, relatively low prices should be supportive for consumption.

This chart shows the current average retail gasoline price divided into average hourly earnings for non-supervisory workers.  This tells us how many gallons a worker can purchase by working one hour.  The average since 1964 has been about 8.6 gallons per hour so the current price, relative to earnings, is not high enough to dampen consumption.

However, we do have concerns about gasoline consumption.

The blue line shows the monthly level of consumption, which is obviously sensitive to seasonal factors.  The red line is the 12-month moving average.  Note that the average began to strongly recover beginning in 2013 but we have been seeing evidence of slowing demand over the last quarter.  This slowing of consumption is worrisome given that prices are not unusually high, employment levels are rather strong and consumer confidence is elevated.  It is possible that we are seeing evidence of “peak demand” for the U.S.  From 1980 to 2006, with a couple of exceptions, gasoline consumption has steadily increased.  This may be due to demographic issues, such as a rising number of baby boomers driving less and millennials driving less as a lifestyle preference, meaning that the uptrend is permanently broken.  If that is the case, it’s going to be difficult to work off the U.S. oil inventory overhang unless we see a rise in exports.  Our position on oil is that we are in a trading range between $45 and $55 per barrel.

View the complete PDF

Daily Comment (April 26, 2017)

by Bill O’Grady, Kaisa Stucke, and Thomas Wash

[Posted: 9:30 AM EDT] At 1:30 EDT, the White House is scheduled to release its tax proposal.  There is quite a bit of speculation about what we will get from this announcement.  Current “leaks” suggest a 15% tax rate for corporate taxes, including owner-operated firms, and a reduced rate for repatriation.  There is also talk about changing the code for individual taxes too, including a larger tax credit for child care and a higher standard deduction.  However, beyond the announcement effects, probably little comes from this.  Democrats won’t support it and it isn’t even likely that it would get enough GOP votes in the House due to the proposal’s lack of revenue offsets.  There will be talk of dynamic scoring to raise revenue but that will be a stretch.  Even using the tactic of reconciliation, which would eliminate the filibuster, is probably not possible because of the lack of revenue offsets.

There is great speculation that this is simply the opening salvo in a bargaining position.  We tend to agree with this stance.  So, if this is the opening position, what would need to happen in order to get a deal done?  First, it appears that a revenue raiser would be necessary.  The border adjustment tax (BAT) appears dead but it wouldn’t shock me to see it resurrected.  The BAT is controversial.  Retailers hate it; exporters cheer it.  But it would raise revenue.  However, it would also likely send the dollar higher.  The BAT won’t gain any support from the Democrats.  Although it’s a long shot, James Baker’s proposal of a carbon tax[1] coupled with a major cut in tax rates might gain support from the Democrats, but it would not be popular with non-establishment Republicans.  Of course, one could get the necessary offsets by cutting spending.  However, Congress is so divided that the only way to cut spending would be to use a sequester mechanism of across-the-board cuts.  Given the White House’s goal of boosting defense and leaving entitlements untouched, cuts will be difficult.

The takeaways from this opening proposal are the following:

  1. The White House isn’t concerned about expanding the deficit. Congress is concerned but the popularity of tax cuts may change the mood of the legislature into finding ways to live with the loss of revenue;
  2. It’s hard to see what the White House can do to get Democrats on board, although adjusting Social Security taxes might be an area of discussion.

This chart shows the share of tax liabilities paid by the lowest 20% of households.  Due to the earned income tax credit and other exemptions, the bottom 20% receive money from the income tax system, so tax cuts to this group are not meaningful.  On the other hand, this quintile pays 5.4% of the Social Insurance tax.  So, raising the cap on Social Security earnings might be an offset.

Any talk of cutting corporate taxes is bullish for equities and the dollar and bearish for Treasuries.  However, talk without a reasonable path to policy changes won’t have much of a lasting effect.  In other words, at some point a deal must be struck and market disappointment will rise without it.  For now, we will be watching this afternoon’s announcement with everyone else to see what is proposed.

View the complete PDF

_____________________________________

[1] https://www.nytimes.com/2017/02/07/science/a-conservative-climate-solution-republican-group-calls-for-carbon-tax.html

Keller Quarterly (April 2017)

Letter to Investors

Perhaps you’ve heard it or felt it, but fear of financial market decline has become palpable among the public.  It’s not just fear as reflected by TV shows or internet social media I’m talking about, but fear reflected by real people in conversation.  I travel rather extensively, speaking to both advisors and their clients, and hear directly from the public such fear of a stock market collapse.  The advisors report, and the clients confirm, that it’s the norm for their clients to hold more than 20% of their investable assets in cash.  Considering that cash now earns sub-1% yields, there really isn’t an investment reason to hold such a high proportion of one’s investments in cash unless one fears a financial panic.

Is such a panic likely? Well, I cannot predict the future, but as one who has been advising investors for over 38 years and studying the stock market for longer, market declines rarely begin with such prevalent pessimism.  Major stock market declines proceed from periods of extraordinary optimism about the future, when seemingly no one can imagine that the economy and the market do anything but surge ahead.  Public sentiment clearly is not at that point.

But didn’t the market recently hit an all-time high? Yes, but that’s not a predictor of market decline. The stock market’s price regularly hits all-time highs because the economy is growing virtually every year.  It was Warren Buffet who once noted that a bank certificate of deposit whose interest is compounded daily hits an all-time high every day!  The market should be marching ahead similarly, as long as the economy and the businesses undergirding it are growing, and they are.

But isn’t the market’s price-to-earnings (P/E) ratio rather high? Yes, as it has been for most of the last 20 years. The reason for the high P/E ratio (and other high valuation measures) is that inflation is very low.  Inflation “steals” away investment returns by paying you back in dollars that are worth less than you originally invested.  Thus, in a rising inflation environment, the market eventually corrects for this “theft” by valuing stocks at lower P/E ratios.  On the flip-side, when inflation is low (as it has been for over 20 years), after-inflation returns are better than expected because very little of this “theft” occurs.  Therefore, stocks adjust by trading up to higher P/E ratios because investors become confident that they’ll actually get to keep their returns.  We wrote last quarter of some things that make us worry about inflation, but we are not seeing it “perk up” yet.

So, we’ve got nothing to worry about? No, there are always things to worry about, but economic disaster is usually not a high probability item, and we don’t think it is today, either. But all the financial markets are the products of human decisions and, as a result, emotions can become embedded in those decisions and thus into prices.  A 5 to 10 percent decline in stock prices never surprises us any more than a similar rise; it happens every year.  The “sentiment pendulum” of optimism/pessimism can swing rather widely and quickly, much more quickly, in fact, than the economy moves.  Rather than being “swung around” by this pendulum, a wise investor should take advantage of the swings.  This is what we seek to do: take advantage of excessive pessimism and optimism in the markets.

We appreciate your confidence in us.


Gratefully,

Mark A. Keller, CFA
CEO and Chief Investment Officer

View the PDF

Daily Comment (April 25, 2017)

by Bill O’Grady, Kaisa Stucke, and Thomas Wash

[Posted: 9:30 AM EDT] We are seeing some follow through from yesterday’s French election rally, although the magnitude is understandably less.  The financial markets appear comfortable that Macron will win in the runoff, and with good reason.  It would be a real shocker to see Le Pen overcome a 25-point deficit in the polls.  To give this lead some context, most reliable polls put Dewey ahead of Truman by 17 points in late September 1948.  However, this lead narrowed to a mere five points by the end of October.  Macron’s lead is clearly more than what Dewey enjoyed and the time for Le Pen to narrow the gap is shorter.

Still, if the past year has told us anything it’s that surprises are possible.  The European media is noting that Le Pen is out aggressively campaigning while Macron appears to be taking a breather.  Dewey’s campaign was also low key.  The elements of an upset are in place.  Macron is a political novice; his support is broad but not very committed and he has no real party apparatus to boost the usual politicking that goes with elections.  If the mainstream parties decide to adopt Macron as one of their own, which is what we expect, he will probably be the winner.  But, if the wide margin breeds complacency, this election may be closer than expected.  The one factor to watch, which is consistent with the Truman/Dewey contest, is a narrowing of the polls.  If an upset is to come, look for the 25-point lead to narrow significantly going into the election on May 7.

The Trump administration has indicated that it wants a major corporate tax cut, lowering the highest rate to 15%.  This is a massive cut.

As the horizontal line shows, this would be the lowest rate since 1937.  Unlike the House plan, it doesn’t appear that Trump has offered any revenue offsets.  A simple cut is estimated to boost the deficit by $2.4 trillion[1] over the next decade.  We suspect this proposal will land with a “thud” on Capitol Hill.  Most Republicans will be quite uncomfortable with expanding the deficit, while Democrats will view the cut as a giveaway to upper income households and won’t support it.

Most public finance analysis suggests the incidence (who pays) of the corporate tax falls on households in the form of either higher prices or reduced dividends.  Although the research is somewhat mixed, most analysis suggests that the incidence of the corporate tax falls more on upper income households.

This chart shows the effective corporate tax rate by selected household income groups.  Clearly, most of the tax falls on the highest income brackets.

Meanwhile, on trade, the administration announced it is implementing new tariffs on Canadian softwood.  This issue has been a controversial one for some time.  U.S. producers complain that Canadian softwood is subsidized by provincial governments.  The tariffs will range from 3% to 24%.  This dispute follows one in which the Canadians complained that the U.S. is subsidizing milk; a product from the milk used in cheese and yogurt is being exported to Canadian processors.  Currently, Canada has decided to support its own dairy farmers to thwart U.S. dairy exports.  These disputes indicate rising trade tensions.  Reducing the trade deficit is something the president campaigned on and he appears to be taking increasingly aggressive steps in this direction.  Given that these actions don’t require Congressional approval, quick action is possible in this arena.  We will have more to say on this issue in the coming weeks.

Although a government shutdown on Saturday is possible, it does appear unlikely.  President Trump offered “flexibility” on the border wall, suggesting he will accept just about anything that promises something with regard to the proposal.  At this point, neither party appears keen on taking the potential blame for a closure.  In past shutdowns, the Freedom Caucus was more than willing to accept responsibility for this action.  Since no one wants to bear the blame, it’s unlikely that a shutdown will happen.  Instead, look for a continuing resolution to keep the government funded.

View the complete PDF

_____________________________________

[1] https://www.washingtonpost.com/business/economy/trump-seeks-15-percent-corporate-tax-rate-even-if-it-swells-the-national-debt/2017/04/24/0c78a35c-2923-11e7-be51-b3fc6ff7faee_story.html?hpid=hp_hp-top-table-main_trumptax-130pm:homepage/story&utm_term=.2c81aecfaee2

Weekly Geopolitical Report – Between a Rock and a Hard Place: The Gibraltar Dilemma (April 24, 2017)

by Thomas Wash

Days after Theresa May triggered Article 50 of the Lisbon Treaty, Brussels issued a nine-page document outlining its guidelines for Brexit negotiations. One of the guidelines gave Spain the authority to veto any deal between Gibraltar and the European Union (EU). The U.K. is currently recognized as holding sovereignty over Gibraltar and thus took exception to this provision, vowing to defend the will of the people of Gibraltar.

The provision is likely the result of heavy lobbying by the Spanish government, who would like to end this 300-year dispute once and for all. A war of words between Spain and the U.K. has already started in response to the announcement. Former Tory leader Michael Howard stated that the U.K. is willing to fight for Gibraltar. Although not responding to the threat, Spain has hinted that it would not block Scotland if it were to apply to the European Union upon a potential Scexit.[1]

Despite the bravado, it is likely that the two countries will come to some sort of agreement as they have deep trade ties. In fact, Spain has been the most vocal backer of a soft Brexit. That being said, the people of Gibraltar are stuck at a crossroads regarding the dispute. On the one hand, they voted 96% to remain in the EU, but on the other hand, they voted 99% against joint sovereignty with Spain. The situation becomes even murkier when its economy is taken into account. Gibraltar is dependent upon the U.K. for trade and Spain for labor. Nevertheless, it is unlikely that Gibraltar would have emerged from Brexit unscathed as its labor force is dependent on the free movement of immigrants permitted under the EU. Ironically, it was the free movement of immigrants that mostly caused British voters to leave the EU.

In this report, we will focus on the significance of Gibraltar, its historical context and the impact of the current dispute. We will conclude with possible market ramifications.

View the full report

__________________________________

[1] During the run-up to the Scottish referendum, it was believed that Spain would oppose any immediate transition by Scotland into the EU if it decided to leave the U.K. because it could encourage Catalonia to move toward independence as well.

Asset Allocation Quarterly (Second Quarter 2017)

  • The economy continues on a stable path, along with relatively low levels of inflation.
  • In this cycle, tighter Fed policy involves not only raising short-term rates, but also reducing the size of the Fed’s balance sheet.
  • The magnitude of growth of the Fed’s balance sheet in recent years was unprecedented. Its reduction is also unprecedented.
  • We expect the Fed to move gradually and telegraph its policy, allowing markets time to adjust without harmful disruptions.
  • Our equity allocations are unchanged this quarter and remain entirely domestic. We utilize large caps for conservative portfolios, while including mid and small caps where risk tolerance is higher.
  • Our bond allocations include short, intermediate and long maturities. We also believe speculative grade bonds are helpful in pursuing income objectives.
  • Our growth/value style bias shifts from 30/70 to an even weight of 50/50.

ECONOMIC VIEWPOINTS

The economy remains on a stable trend so far in 2017. Unemployment remains low, while consumer and business sentiment are improving. Accordingly, the Fed has continued on its path of gradually raising short-term interest rates. At this point, it appears the pace of tightening is appropriate, and isn’t tipping the economy toward a recession. Still, we’re keeping a close eye on monetary policy, because there’s a unique issue the Fed is managing in this cycle: the reduction of its own balance sheet.

What exactly is the Fed’s balance sheet? Without getting into too many details, the Fed’s balance sheet reflects the value of assets it has purchased in the financial markets, most of which are bonds. When the Fed buys assets, it pays for them by simply creating money. It’s sort of like a digital printing press that increases money supply. Conversely, when the Fed sells assets, the proceeds are taken out of the economy, lowering the supply of money. The Fed normally expands and shrinks its balance sheet by buying and selling short-maturity bonds, thereby directing short-term interest rates, according to its desired policy.

However, during the financial crisis in 2008, the Fed altered the kinds of assets it would purchase in order to help stabilize the markets. Then, after stabilizing markets, the Fed began purchasing long-maturity Treasury and mortgage bonds (a policy called “Quantitative Easing,” or “QE” for short) in an attempt to stimulate the economy by driving long-term interest rates lower. In this graph, we can see the total assets of the Fed. In 2008, its balance sheet had assets worth about $900 billion. Although this was a large number, it was a function of multi-decade growth, having risen along with the overall size of the economy.

Through three rounds of QE, the Fed’s balance sheet growth accelerated rapidly, ultimately quintupling assets to almost $4.5 trillion. Unfortunately, the economic stimulus from QE didn’t materialize. Most of the increase in money supply remained parked as excess reserves in the banking system. Lending stalled as financial regulations made banks very cautious to lend, while at the same time most qualified borrowers were simply not interested in more debt.

So, today, as the Fed guides short-term rates gradually higher, it is also contemplating how to lower the size of its balance sheet. If most of the increase in money supply is parked as excess reserves in the U.S. banking system, a gradual decline in the Fed’s balance sheet shouldn’t be too disruptive to the availability of credit and shouldn’t harm the economy…in theory. The problem is, nobody really knows how to shrink a balance sheet of this size. How much? How fast? When? It’s an unprecedented endeavor.

Fortunately, the Fed has significant leeway in how it moves forward. It has already had success in telegraphing its interest rate policy, and we expect the Fed to communicate its balance sheet plan in a way that fosters gradual adjustments by financial markets, borrowers and lenders. It’s worth noting this leeway is derived from a stable economy. In the event the economy begins to falter, or is disrupted by geopolitical events, the Fed’s efforts will become much more complicated.

It’s also worth mentioning that uncertainty regarding White House policies may also cloud the economic landscape. We have not yet ascertained whether the president will favor traditional supply-side economics, or if populist priorities will rule the day. Generally speaking, a supply-side bias would create more predictability for the Fed, whereas populist policies toward protectionism would tend to create more inflation, geopolitical risk and uncertainty for the Fed. Accordingly, we’ll be closely monitoring economic trends, geopolitical risk, White House policies and how the Fed decides to navigate the unprecedented reduction of its balance sheet.

STOCK MARKET OUTLOOK

Even as the post-election euphoria leveled off, equities were still able to begin 2017 on a positive trend, with large caps delivering some of the best returns. We believe the environment for equities should remain generally good, although we are a bit more cautious given that valuations have risen over the past few years. Our work indicates there has been a close relationship between increases in the Fed’s balance sheet and equity valuations (stock P/E ratios rose during periods of QE), so we are monitoring equities to see if a shrinking balance sheet has the opposite effect. Our early work indicates that a gradual decline in the Fed’s balance sheet may not be overly disruptive to equities.

We maintain our focus on domestic equities, with no foreign developed or emerging equity exposure.  We continue to believe the return/risk profile is more favorable for U.S. equities against the backdrop of potential earnings, valuations, currency risk and geopolitical uncertainty. We utilize large caps for more conservative models, while including more exposure to mid and small caps where risk tolerance is higher. Within large caps, we are overweight financials, industrials and utilities, while being underweight telecom and consumer staples. We are adjusting our style bias from 30/70 growth/value to an evenly balanced 50/50, based upon our views toward sectors and industries within each style.

BOND MARKET OUTLOOK

After rising in the latter half of 2016, Treasury yields were generally stable in the first quarter of 2017. Seemingly, as the optimism for higher growth mellowed, so too did concerns for future inflation and more aggressive tightening by the Fed. Our expectation is for both growth and inflation to remain generally in line with current levels, with the potential to rise modestly over the next few quarters. A wildcard here may be trade policy. If protectionist policies were to actually manifest, they would likely drive inflation higher. We are also watching to see how the decline in the Fed’s balance sheet affects bond yields.

Against this backdrop, we feel it is appropriate for most bond investors to include a variety of maturities, sectors and credit qualities in their bond allocations. These include short, intermediate and long-maturities, including Treasury, corporate and MBS. We also include speculative grade bonds, where the default rates appear relatively benign. It is worth mentioning that we continue to see important diversification benefits from longer maturity bonds as this asset class has a tendency to rise when equities decline, helping to address overall portfolio risk.

OTHER MARKETS

Fundamentals in real estate are generally good, although we prefer to limit or avoid exposure to retailing, where certain markets may face ongoing challenges. Broadly speaking, real estate capital costs and financing should remain relatively low, while occupancy and rental rates are likely to be constructive. We also expect foreign capital to continue flowing into U.S. real estate.

We remain out of commodities where the return/risk does not appear as favorable. China continues to be the marginal source of demand for most commodities, and we have concerns regarding the stability of the country’s growth rate. In addition, we expect energy commodities to have a negative bias given significant global supply capacity.

View the complete PDF