Business Cycle Report (September 29, 2022)

by Thomas Wash | PDF

The business cycle has a major impact on financial markets; recessions usually accompany bear markets in equities.  The intention of this report is to keep our readers apprised of the potential for recession, updated on a monthly basis.  Although it isn’t the final word on our views about recession, it is part of our process in signaling the potential for a downturn.

The Confluence Diffusion Index fell into contraction territory for the first time since 2020. The latest report showed that five out of 11 benchmarks are in contraction territory. The diffusion index declined from +0.3939 to +0.2121, slightly below the recession signal of +0.2500.

  • Tighter financial conditions weighed on bond and equity prices
  • Goods production slowed but remains supportive of the economy
  • Firms’ demand for available workers continues to outpace the number of jobseekers

The chart above shows the Confluence Diffusion Index. It uses a three-month moving average of 11 leading indicators to track the state of the business cycle. The red line signals when the business cycle is headed toward a contraction, while the blue line signals when the business cycle is in recovery. The diffusion index currently provides about six months of lead time for a contraction and five months of lead time for recovery. Continue reading for an in-depth understanding of how the indicators are performing. At the end of the report, the Glossary of Charts describes each chart and its measures. In addition, a chart title listed in red indicates that the index is signaling recession.

Read the full report

Weekly Energy Update (September 29, 2022)

by Bill O’Grady, Thomas Wash, and Patrick Fearon-Hernandez, CFA | PDF

Crude oil prices remain under pressure due to recession fears.

(Source: Barchart.com)

Crude oil inventories fell 0.2 mb compared to a 2.0 mb build forecast.  The SPR declined 4.6 mb, meaning the net draw was 4.8 mb.

In the details, U.S. crude oil production fell 0.1 mbpd to 12.0 mbpd.  Exports rose 1.1 mbpd, while imports fell 0.5 mbpd.  Refining activity plunged 3.0% to 90.6% of capacity.  We are in the usual period for autumn refinery maintenance, so falling refining activity should be expected for the next few weeks.

(Sources: DOE, CIM)

The above chart shows the seasonal pattern for crude oil inventories.  As the chart shows, we are at the seasonal trough in inventories.  The build seen in October into November is usually due to refinery maintenance.  With the SPR withdrawals continuing, the seasonal build could be exaggerated this year.

Since the SPR is being used, to some extent, as a buffer stock, we have constructed oil inventory charts incorporating both the SPR and commercial inventories.

Total stockpiles peaked in 2017 and are now at levels last seen in 2003.  Using total stocks since 2015, fair value is $107.52.

Market News:

 Geopolitical News:

  Alternative Energy/Policy News:

  View PDF

Bi-Weekly Geopolitical Report – Updates on Russia-Ukraine and Armenia-Azerbaijan (September 26, 2022)

by Patrick Fearon-Hernandez, CFA, and Bill O’Grady | PDF

September has been full of dramatic developments in Russia’s war against Ukraine and in the broader geopolitics of the region.  Indeed, now that we’re into autumn and Russia and Ukraine are both trying to improve their positions ahead of winter, it may be a good time to update the recent developments in the war and how they’re playing out more broadly.  Renewed fighting between Armenia and Azerbaijan in mid-September offers a good example of the broader implications of the war, so we especially want to touch on that.  As always, we wrap up this report with a discussion of the implications for investors.

View the full report


Don’t miss the accompanying Geopolitical Podcast, available on our website and most podcast platforms: Apple | Spotify | Google

Weekly Energy Update (September 22, 2022)

by Bill O’Grady, Thomas Wash, and Patrick Fearon-Hernandez, CFA | PDF

Crude oil prices remain under pressure on recession fears.

(Source: Barchart.com)

Crude oil inventories rose 1.1 mb compared to a 1.9 mb build forecast.  The SPR declined 6.9 mb, meaning the net draw was 5.8 mb.

In the details, U.S. crude oil production was steady at 12.1 mbpd.  Exports were unchanged while imports rose 1.2 mbpd.  Refining activity rose 2.0% to 93.6% of capacity.

(Sources: DOE, CIM)

The above chart shows the seasonal pattern for crude oil inventories.  The rise in stockpiles over the past two weeks is contra-seasonal.  As the chart shows, we are nearing the seasonal trough in inventories.  The build seen in October into November is usually due to refinery maintenance.  With the SPR withdrawals continuing, the seasonal build could be exaggerated this year.

Since the SPR is being used, to some extent, as a buffer stock, we have constructed oil inventory charts incorporating both the SPR and commercial inventories.

Total stockpiles peaked in 2017 and are now at levels last seen in 2003.  Using total stocks since 2015, fair value is $106.98.

With so many crosscurrents in the oil markets, we are beginning to see some degree of normalization.  The inventory/EUR model suggests oil prices should be around $66 per barrel, so we are seeing about $20 of risk premium in the market.

The SPR

In our weekly reporting above, we have been updating total U.S. oil inventories, both commercial and the SPR.  For years, analysts have tended to treat the two as different entities as commercial inventories are what is available and the SPR was only deployed in emergencies.  Price modeling, therefore, tended to focus on commercial storage.  The separation of commercial and strategic stocks made sense.  However, as our above analysis suggests, we have stopped treating the SPR as an emergency reserve and have begun considering it a buffer stock.

Buffer stocks are sometimes used in commodity markets to dampen price volatility.  When prices rise to a level considered “too high,” the buffer stock manager releases inventory, and when prices are “too low” the commodity is purchased.  In the 1970s, several commodities had buffer stocks, which were managed by producers.  All of them eventually failed because producers set a price well above the market clearing one.  Eventually, the buffer stock became too large, and the manager was forced to “dump” the stocks on the market, leading to a price collapse.  A buffer stock operated by a consumer would likely have the opposite problem since it would want to set a price well below the market clearing one.

Recently, the Biden administration floated an idea that if WTI fell to $80 per barrel or less, the SPR would buy oil to refill it.  We still harbor doubts that oil will ever be purchased by this administration, but this recent “trial balloon” is intriguing.  If this idea becomes policy, it will confirm that the SPR has become a buffer stock and the government is comfortable with an $80 per barrel oil price.  That is probably a high enough price to maintain current output, but if prices remain steady, the inflationary impact (inflation is a rate of change concept) would diminish over time.  In theory, the $80 per barrel becomes a floor, and it is unclear what price would trigger selling (the ceiling price), although one could imagine that a round number like $100 per barrel would be reasonable.  There remain numerous uncertainties about this concept, but we will continue to monitor developments.

Here’s the key point to all this:  from the late 1970s until recently, there was great faith placed on markets to solve problems.  Government intervention into the economy was normalized during the Great Depression and WWII but the inflation of the 1970s undermined the idea that the government could manage the economy.  The infamous gas lines of the 1970s occurred, in part, due to price caps on product.  When it became unprofitable to refine gasoline at the cap price, shortages developed.  Markets do work, but they are focused on efficiency, not equality.  In other words, high gasoline prices did increase available supply and eased demand, but the burden of the policy fell more heavily on lower income households.  The government using the SPR as a buffer stock could suggest a return to the pre-Reagan/Thatcher era.

Market News:

  • We want to issue a correction to last week’s report; we implied that the permitting element of the Inflation Reduction Act had already been passed. It was not.  This part was peeled from the bill to be passed separately.  Talks on permitting are currently underway.
  • The government has accepted about $190 million of bids for offshore oil development.
  • The G-7 price cap idea remains untested, but the IEA notes that when the EU implements its embargo next February, Russian oil demand will fall by 1.9 mbpd.
  • As winter approaches, U.S. oil producers warn they will not be able to meet shortfalls as demand rises. Surging LNG exports are pushing U.S. electricity prices higher.
  • For reference, this site updates EU natural gas storage.
  • One of the factors that has cooled oil prices has been weaker Chinese economic growth. If Beijing becomes serious about stimulating the economy, oil prices will likely rise.
  • Over the past several months, we have noted that the data for miles driven by Americans shows a clear reaction to higher gasoline prices. For years, it was a “truism” that driving demand was price insensitive.  However, work from home and the expansion of social media appear to have caused gasoline consumption to become more sensitive to price.
  • As energy prices rise in the EU, manufacturing firms are being forced to curtail production.
  • Smaller U.S. oil firms have been aggressively expanding oil and gas production, but reports suggest that they have exhausted their most promising fields, which may lead to falling output.
  • As energy prices rise in Europe, governments are trying to address this issue. There are two policy paths.  The first is to increase supply, and although that is the preferred solution, it is hard to execute in the short run because it often takes investment and time to lift production.  The other path is to ease the negative impact on consumers by either fixing the price and then allocating the “pain” to either producers or the government, or by subsidizing consumers.  The problem is, once this path has been taken, it becomes a political decision about who will bear the cost.  The U.K. is a good example of what not to do as the support program is likely too broad, offers too much support, and will be funded by government borrowing.  The steady decline in the GBP is evidence that the markets, to quote Queen Victoria, “are not amused.”
  • The lack of investment in oil and gas production is a key element to the recent rise in prices. A good example of this lack of investment is Nigeria, where oil production is  about 1.2 mbpd, down from 2.6 mbpd in 2012.  Economic mismanagement and corruption have weakened the incentives to investment, and since oil and gas are depleting assets, the lack of investment means falling output.  This investment issue isn’t just a Nigerian problem as OPEC+ now speaks of “production targets” as opposed to “production quotas,” reflecting the lack of productive capacity.
  • The recent heatwave in China has spurred coal demand and has lifted imports of coal from Russia and Indonesia.
  • As we head into another “La Niña” season, Japan is bracing for a cold winter. If the temperatures stay true to form, it will lift LNG demand.

 Geopolitical news:

 Alternative energy/policy news:

  • There is an old adage in commodities that “nothing cures high prices like high prices.” The idea is that high prices lead consumers to reduce demand and suppliers to boost output.  In the current high-price environment, most of the adjustment has come from consumers.  However, one area often overlooked is increasing efficiency.  A recent report indicated that data centers, server farms that do the calculating that fosters AI and the internet, tend to generate massive levels of heat that is usually vented.  However, with prices for energy high, there are efforts to capture this energy and use it for the production of steam.
  • As EVs expand, lithium, a key mineral in batteries, is in high demand. It tends to be found from two sources:  ‘hard rock’ mining and evaporating brine at high altitudes from waters containing lithium.  The latter source is mostly found in South America, primarily Chile.  The former source is distributed around the world, with several mining sites in Canada.  A major, yet undeveloped, mine exists in Quebec.  Despite high demand and high prices, the mine remains uncompleted due to various obstacles.
  • Hertz (HTZ, $18.15) announced plans to purchase 175,000 EVs from General Motors (GM, $39.17) over the next five years.
  • Modular nuclear reactors hold the promise of expanding nuclear power quickly to less populated regions. Despite their promise, industry expansion has been slow.  There are several reasons.  First, most of the research and development of these reactors are still in the concept and design phases.  This situation is still favorable, because is suggests this product will become increasingly available.  But for now, electricity from small modular nuclear reactors remains in the future.  Second, connecting to the grid remains an issue in some markets.  One possibility would be to site these reactors where current coal-fired plants reside, allowing for rapid connectivity.  And finally, even with modularity, nuclear power remains controversial, which tends to slow development.
  • Although key metals for clean energy are found in various places around the world, processing is concentrated in China.

  View PDF

Asset Allocation Bi-Weekly – The Federal Reserve’s Big Policy Mistake (September 19, 2022)

by the Asset Allocation Committee | PDF

If you look at how stocks and other risk assets have lost value since Fed Chair Powell’s short, hawkish speech at Jackson Hole last month, it’s clear he has succeeded in resetting expectations for monetary policy.  Investors now seem to accept that the Fed plans to hike interest rates much higher and then hold them there until consumer price inflation falls sharply.  The drop in risk assets suggests investors now realize that monetary policymakers are willing to push the economy into recession if needed to re-establish their credentials as inflation fighters.  That’s a huge change in sentiment.  But has the change gone far enough?  Multiple signs suggest investors expect any impending recession to be mild.  For example, the S&P 500 price index is currently down just 19.2% from its most recent record high in early January versus a median decline of approximately 25% during recessions over the last few decades.

We are skeptical that the Fed can keep any impending slowdown mild, for several reasons.  One key reason is that the Fed now has much weaker control over financial conditions than it did in the past.  In the chart below, we show that the Chicago FRB’s broad measure of U.S. financial conditions had a very tight correlation with the Fed’s benchmark fed funds interest rate only up to about 1998.  Since then, financial conditions have had almost no relation to the fed funds rate.  At most, the chart suggests the Fed needs to keep hiking rates for a long time before financial conditions tighten, as in the years leading up to the housing crisis of 2007-2008.  And even then, when financial conditions tighten, they do so quickly and dramatically.  Why is that?

It’s hard to pinpoint exactly why the Fed’s interest rate policy lost its impact on financial conditions in the late 1990s, but one plausible explanation is that the U.S. economy by then had become “money market driven” and was no longer “bank driven.”  By the late 1990s and ever since, those in need of capital and those holding excess capital (including international entities) have increasingly found each other via efficient, impersonal trading markets.  Rather than borrowing from banks, sophisticated corporate or municipal borrowers now issue bonds directly to investors.  Individuals borrow from both banks and specialized mortgage companies, both of which often package those loans into securities and sell them to third-party investors.  Finally, any holder of high-quality assets like U.S. Treasury bills can pledge them in return for a loan via the “repo” market.  The capital flows involved in these market transactions amount to trillions of dollars, and neither the banks nor the Fed has much control over them.

The problem is that Chair Powell and the other Fed policymakers may not understand or accept that in this new, internationalized money market-driven environment, the Fed may be better positioned to manage the economy by setting guardrails on the value of market-traded financial instruments like bonds and repos.  The fed funds rate may no longer be the right tool to achieve the Fed’s goals of stable consumer prices and full employment.  In fact, the Fed’s current aggressive rate hikes implicitly show this.  In the chart below, we can see that the Fed’s current rate hikes have broken a 20-year tradition in which policymakers cut rates or refrained from hiking them when the VIX gauge of stock volatility was greater than 20.  The Fed is now hiking rates despite the VIX being well above 20, just as it did in its bubble-popping mode during the late 1990s.

We all know how dangerous it is to try slicing an apple with a dull knife: you add more and more pressure until, suddenly, the blade crashes through and takes off the tip of your thumb.  The fed funds rate is now a very dull knife, and Fed policymakers will likely have to press it much harder than people expect before it substantially tightens financial conditions and cuts inflation pressure.  The danger is that the accumulation of rate hikes will suddenly gain traction and slide through the economy.  Looking forward, the Fed may realize that a better policy tool now may be something like its emergency asset backstopping programs early in the coronavirus pandemic.  With those programs, the Fed promised to buy a wide range of assets ranging from Treasuries and commercial paper to municipal bonds, if needed, to ensure their tradability, but the programs were so successful in calming the markets that they were little used.  For the time being, however, Fed policymakers are still wedded to their old-school, dull-bladed fed funds rate and will likely keep ratcheting it up until it finally sparks a more substantial recession.

View PDF

Weekly Energy Update (September 15, 2022)

by Bill O’Grady, Thomas Wash, and Patrick Fearon-Hernandez, CFA | PDF

Crude oil prices remain under pressure on recession fears.

(Source: Barchart.com)

Crude oil inventories rose 2.4 mb compared to a 2.5 mb build forecast.  The SPR declined 8.4 mb, meaning the net draw was 6.0 mb.

In the details, U.S. crude oil production was steady at 12.1 mbpd.  Exports rose 0.1 mbpd, while imports declined 1.0 mbpd.  Refining activity rose 0.6% to 91.5% of capacity.

(Sources: DOE, CIM)

The above chart shows the seasonal pattern for crude oil inventories.  The rise in stockpiles over the past two weeks is contra-seasonal.  As the chart shows, we are nearing the seasonal trough in inventories.  The build seen in October into November is usually due to refinery maintenance.  With the SPR withdrawals continuing, the seasonal build could be exaggerated this year.

Since the SPR is being used, to some extent, as a buffer stock, we have constructed oil inventory charts incorporating both the SPR and commercial inventories.

Total stockpiles peaked in 2017 and are now at levels last seen in 2003.  Using total stocks since 2015, fair value is $106.07.

The SPR has been falling rapidly.

With so many crosscurrents in the oil markets, we are beginning to see some degree of normalization.  The inventory/EUR model suggests oil prices should be around $66 per barrel, so we are seeing about $20 of risk premium in the market.

Natural Gas Update

Now that summer is behind us, it’s time to examine the state of the natural gas market as winter approaches.  Currently, on a rolling 12-month basis, supply is exceeding consumption.

Some of the supply improvement has come from rising net imports.  As the chart below shows, the U.S. was a net importer of natural gas until late 2017 (again, on a rolling 12-month basis).  Since then, the U.S. is a net exporter, hence the negative net import reading. The recent rise in net imports appears to be tied to the Freeport LNG disruption, as LNG exports have fallen.  By next spring, that facility is expected to be at full production, which will reduce American supplies, assuming steady production.

Although supply has been ample, hot summer weather has lifted consumption and puts the U.S. at a modest storage deficit going into autumn.

This model seasonally adjusts storage levels, and the deviation line shows the difference between current and normal storage.

Expectations of rising LNG exports have pushed U.S. natural gas prices well above seasonal norms.  As always, the key to prices in the winter is temperature.  One way to measure the impact of temperature on energy demand is using the concept of the degree day.  The degree day measures the average temperature (high + low/2) compared to 65o with the idea that no climate control is necessary at that temperature.  If above 65o, cooling is required while if below, heating is required.  The temperature deviation is then adjusted by population.  Below are the deviations from normal.

Heating degree day values tend to be higher than cooling because extreme cold is more common than extreme heat.  A temperature of 0o generates a heating degree day where the equivalent would be 130o for a cooling degree day.  Thus, on the above charts, we have scaled the degree days equally.  Casual observation would suggest that winters have become milder as the last extreme cold month, December 2000, was a heating degree day of 200 which has not been exceeded since.  Such readings were far more common in the 1970s.  On the cooling side, there is a clear upward drift in deviations.  It is quite possible that rising greenhouse gas levels are a factor in both warmer winters and hotter summers, but one cannot rule out longer cycle factors, such as sunspots.  What this means for natural gas markets is that colder winters may not be as bullish a factor as it once was, but summers pay a larger role in demand.

Market news:

  • As autumn approaches, natural gas demand tends to decline. Moderate temperatures ease electric demand.  There is always a risk of hurricane disruption in the Gulf of Mexico, but so far this year, the region has been spared from storms.  Hurricane season peaks, on average, by September 10, so there is a growing chance that we will avoid a serious disruption from tropical activity.  Although EU natural gas inventories have increased, it is important to remember that inventory is a supplement to production and imports.  Thus, to ensure ample supplies, barring a mild winter, U.S. LNG flows, which have been critical to the inventory build, will need to continue.  This means that U.S. natural gas prices will remain elevated, unless the U.S. decides to curtail exports.
  • A follow-on effect of high natural gas prices is high fertilizer prices as natural gas is an important feedstock for fertilizers, and tight supplies are hammering the European fertilizer industry. In response, Germany has been increasing chemical imports.
  • One of the surprises over the past 18 months has been the lack of supply response from the oil industry in the face of elevated prices. A key reason is the worry about policy changes leading to stranded assets.  We expect this fear to cap the supply response and keep oil prices high.
  • Although the supply situation for crude oil remains bullish, demand is cyclical and as the odds of a recession rise, the potential for demand destruction is increased as well.
  • One of the key elements of recent legislation was permitting reforms. Environmentalists and other groups have been using the courts to prevent pipeline construction, for example.  The Inflation Reduction Act is designed to reduce the time of objections to construction.  Interestingly enough, it could work the other way.  Although intermittency is a hinderance to using solar and wind power, long-range electricity distribution could, in theory, counter intermittency by allowing solar or wind power to be sent long distances when it might be dark and calm.  This bill should help that process as well, as often proposals for electricity lines face local objections.

 Geopolitical news:

  • It is looking increasingly like a return to the Iran nuclear deal isn’t going to occur. To some extent, it appears that Iran won’t take “yes” for an answer.  The White House has generally accepted Iran’s demands, only to see new ones emerge.  We suspect the Iranian leadership needs an enemy much like the Castros do in Cuba; it is hard to repress one’s population without an ever-present enemy.  We have been skeptical of a deal and despite continued negotiations, it doesn’t look like one is coming.
  • Part of managing sanctions is the use of GPS and vessel transponders. Increasingly, software is spoofing this system, reducing the effectiveness of sanctions. Actual interdiction is still possible but would require a much larger military effort.
  • Lebanon has been in a financial crisis for some time. Things have gotten worse as the central bank has stopped supplying dollars to energy importers, leading to soaring product prices.

 Alternative energy/policy news:

  View PDF

Bi-Weekly Geopolitical Report – The Ukraine War at Six Months: Some Reflections (September 12, 2022)

by Bill O’Grady | PDF

On February 24, Russian forces entered Ukraine.  Despite warnings from U.S. intelligence about an invasion, the general consensus was that Moscow was merely threatening to act.  Thus, when Russia invaded, Europe was mostly caught by surprise.  Much of what followed was also unexpected.

As we reach the six-month mark of the conflict, we believe it’s worth taking some time to discuss what has surprised us about the war so far, some of the key risks going forward, and the most likely outcome of the conflict.  We will also touch on the lasting changes this war will cause and one important narrative that will likely lose its power.  We will close with our usual look at market ramifications.

View the full report

Note: There is no accompanying Geopolitical Podcast this week.
Previous episodes are always available on our website and most podcast platforms: Apple | Spotify | Google

Asset Allocation Bi-Weekly – Storm Warning (September 6, 2022)

by the Asset Allocation Committee | PDF

Throughout this year, there has been much talk (and confusion) about recession.  Officially, the National Bureau of Economic Research is the formal arbiter of recession.  This private group of economists assesses when there is a broad-based decline in economic activity and when that activity recovers.  It then tells us when the recession began and when it ended.  It’s important to note that it can be months after the recovery is underway that the recession is made official.  The NBER isn’t making real-time calls on the business cycle.  Thus, it’s never wrong, but it isn’t timely, either.

In the absence of an official designation, economists (and others) offer their insights as to whether the economy is in recession.  A common rule is that two consecutive quarters of negative real GDP growth signals a recession.  As rules go, it’s not a bad one as every time we have seen this measure met, a recession was usually underway.  But we have also had recessions where this rule was not triggered.  It’s also important to note that the historical data has been revised numerous times, and it is possible that we could see one or both negative quarters reversed.  Since the beginning of the year, a parade of pundits and economists have weighed in on the topic.  Our take has been that conditions are deteriorating, but we aren’t in recession…yet.

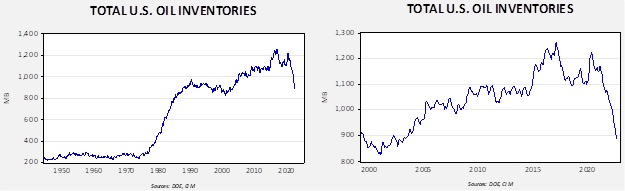
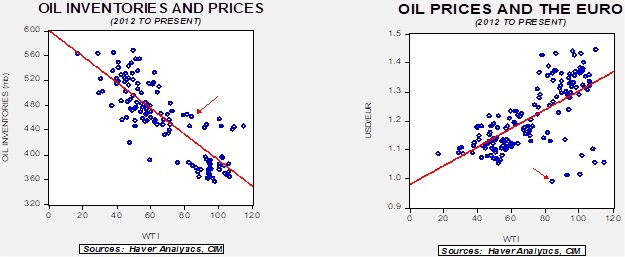
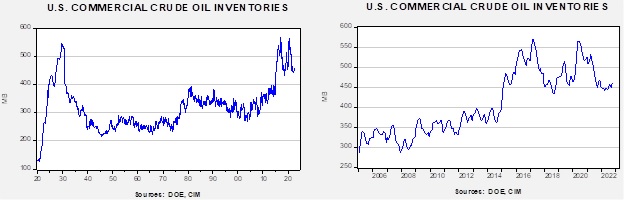
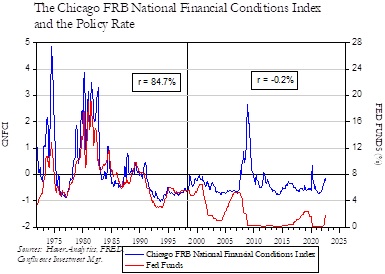
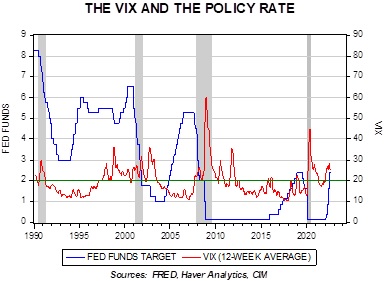
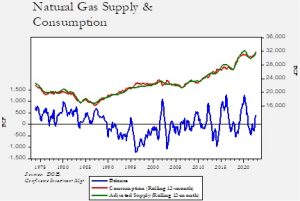
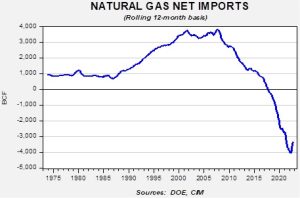
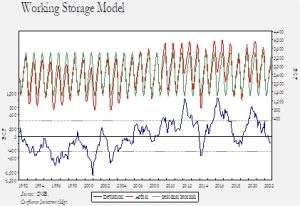
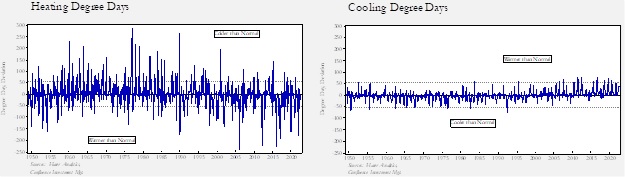
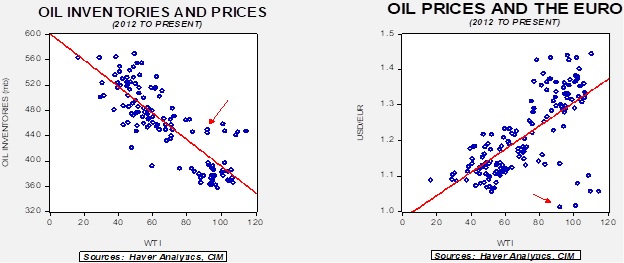
However, evidence is rapidly accumulating that a recession is on the horizon.  Since the business cycle is so important to financial markets, we use a wide variety of sources to update us on business conditions, some of which are protected by copyright.  Although we cannot disclose them publicly, we do note they are signaling a downturn.  We also have ones we can share and others we have created ourselves.  The following are a couple of useful charts.

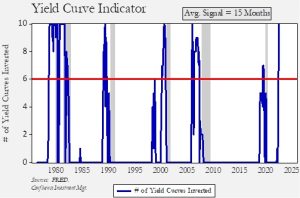
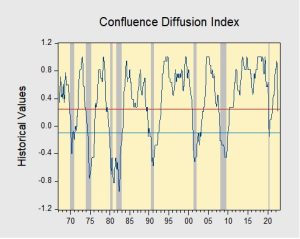
The yield curve is considered the most reliable signal of the business cycle available.  Every inversion, where short-term interest rates rise above long-term interest rates, has preceded a downturn.  However, this statement does not delineate “which” yield curve should be the determining one.  After all, there are numerous permutations of yield curves available.  To resolve this issue, we have created an indicator that uses 10 different yield curves[1] and counts them as they invert.  Over the past 45 years, when seven curves have inverted, a recession always follows.  Currently, all 10 have inverted.  On average, a recession occurs in roughly 15 months with the fastest occurring in just eight months.

The following chart combines two indictors from the New York FRB and the Atlanta FRB.  The former (the red line on the chart) uses the yield curve, while the latter works off GDP (the blue line).  The New York FRB signals a recession with a reading greater than 40, whereas the Atlanta FRB trigger is a reading over 30.  Neither is signaling a downturn at the moment, but both are quite close to a recession signal.

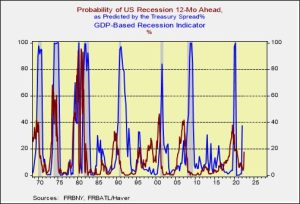
Our best estimate is that a recession will likely be evident by late this year or, more likely, in Q1 2023.

The chart below shows weekly Friday closes for the S&P 500.  The lower line shows the index value compared to the previous peak.  The variance with recessions is notable.  In three of the four deep recessions, declines of around 50% occurred.  In normal recessions, the declines were usually less onerous, although the 1970 and 2001 recessions had rather sizeable pullbacks.  Most of the time, recessions coincide with weaker equity markets, but the degree of weakness varies.

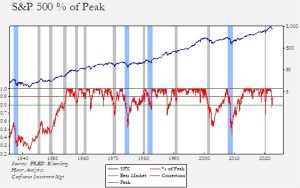
In general, odds favor a normal recession (shown on the above chart with gray bars).  Deep recessions (shown with blue bars) tend to be characterized by unusual situations.  For example, the 1937 recession was caused by premature and excessively tight monetary and fiscal policy when the Fed raised rates and the Roosevelt administration tried to run fiscal surpluses.  The 1973 recession had an oil and geopolitical crisis.  The 1981 recession was characterized by extremely tight monetary policy to end persistent inflation, and the 2007 recession had a financial crisis.  Currently, the financial markets are not expecting any of these outcomes as monetary policy is expected to pivot quickly in response to a decline in growth, inflation is expected to moderate, and no financial or geopolitical crises are anticipated.  Obviously, vigilance is required, because bad recessions tend to be “black swan” sorts of events and the downside would be significant.  Given current geopolitical tensions and disruptions to supply chains, there is certainly a case to be made that the expected recession has the potential to be a deep one.  However, the more likely outcome is a milder downturn for equities.

With a 20% decline already recorded, there has been some discussion that a recession is already discounted.  Although this outcome is possible, we think that the earlier pullback was more of a reflection of the removal of extreme stimulus.  Thus, another “leg” lower when the recession arrives is more likely.  Currently, we think a drop to 3500 would not be unreasonable.

View PDF


[1] Specifically, we use the 10/1, 10/2, 10/3, 10/5, 5/1, 5/2, 5/3, 3/1, 3/2, and 2/1.

Weekly Energy Update (September 1, 2022)

by Bill O’Grady, Thomas Wash, and Patrick Fearon-Hernandez, CFA | PDF

(The Weekly Energy Update will not be published next week.  The report will return on September 15.)

Crude oil prices remain under pressure on fears of a deal with Iran and weakening economic growth.

(Source: Barchart.com)

Crude oil inventories fell 3.3 mb compared to a 2.5 mb draw forecast.  The SPR declined 3.1 mb, meaning the net draw was 6.4 mb.

In the details, U.S. crude oil production fell 0.2 mbpd to 12.0 mbpd.  Exports fell 0.8 mbpd, while imports were unchanged.  Refining activity rose 0.3% to 93.8% of capacity.

(Sources: DOE, CIM)

The above chart shows the seasonal pattern for crude oil inventories.  Clearly, this year is deviating from the normal path of commercial inventory levels although the past months’ inventory changes are more consistent with seasonal behavior.  We will approach the usual seasonal trough for inventories in mid-September.

Since the SPR is being used, to some extent, as a buffer stock, we have constructed oil inventory charts incorporating both the SPR and commercial inventories.

Total stockpiles peaked in 2017 and are now at levels last seen in 2003.  Using total stocks since 2015, fair value is $107.69.

With so many crosscurrents in the oil markets, we are beginning to see some degree of normalization.  The inventory/EUR model suggests oil prices should be around $64 per barrel, so we are seeing about $24 of risk premium in the market.

Market news:

(Source:  Bloomberg)

 Geopolitical news:

 Alternative energy/policy news:

       (Source:  Axios)

    • One factor driving the price of EVs higher is the goal of giving the cars the same range as a gasoline powered vehicle. However, when “fill up” of electricity can be done daily in one’s garage, an EV with a much smaller range might be more practical for everyday use and be cheaper to make.
    • We remain bullish on metals required in the conversion away from fossil fuels because it doesn’t appear that the demand is impossible to fill. At the same time, miners continue to find that local opposition is delaying the building of new mines for the materials required for batteries.

  View PDF