by Bill O’Grady, Thomas Wash, and Patrick Fearon-Hernandez, CFA | PDF
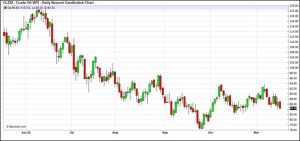
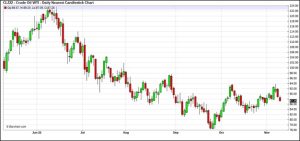
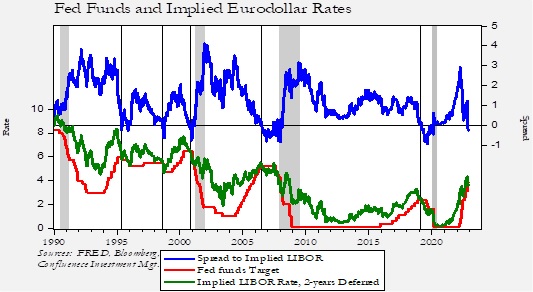
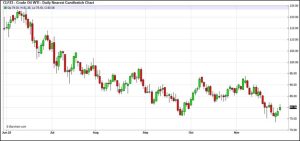
Crude oil prices appear to be building in a base in the mid-$80s.
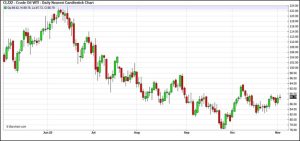
(Source: Barchart.com)
Crude oil inventories fell 3.1 mb compared to a 1.5 mb build forecast. The SPR declined 1.9 mb, meaning the net draw was 5.0 mb.
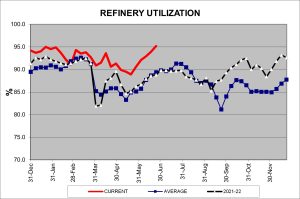
In the details, U.S. crude oil production fell 0.1 mbpd to 11.9 mbpd. Exports declined 1.2 mbpd, while imports were steady. Refining activity rose 1.7% to 90.6% of capacity.
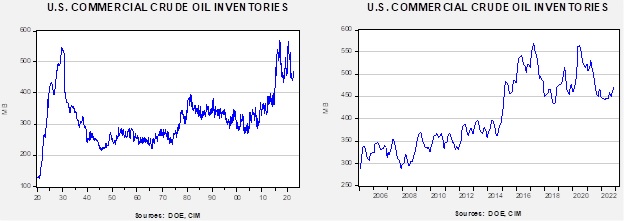
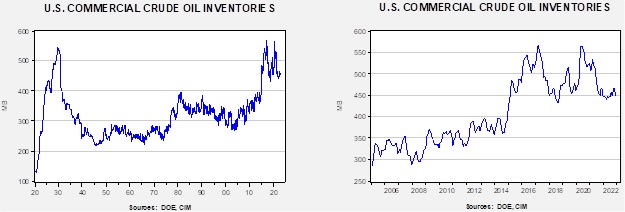
(Sources: DOE, CIM)
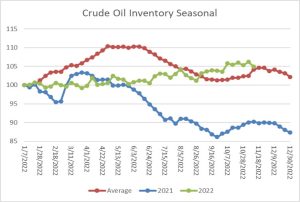
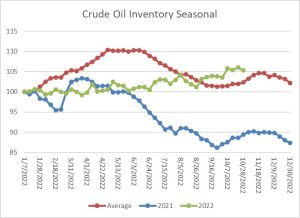
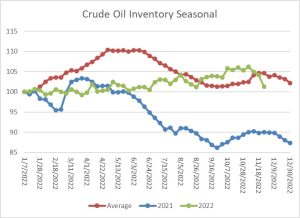
The above chart shows the seasonal pattern for crude oil inventories. As the chart shows, we are past the seasonal trough in inventories and heading toward the secondary peak which occurs later this month. SPR sales have distorted the usual seasonal pattern in this data.
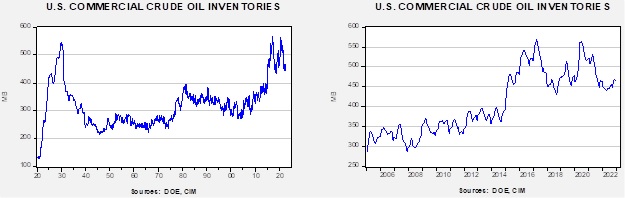
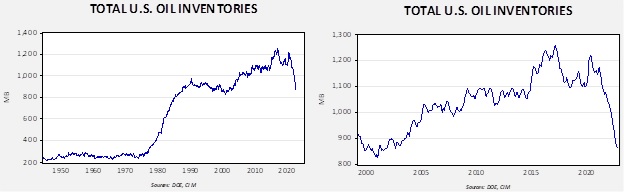
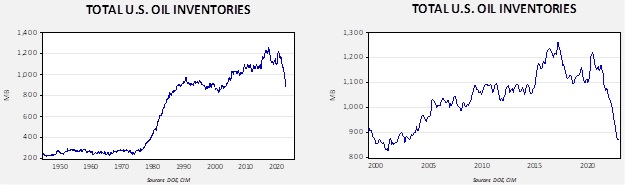
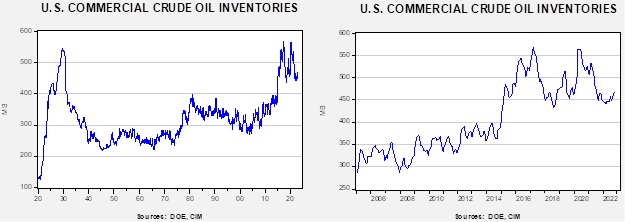
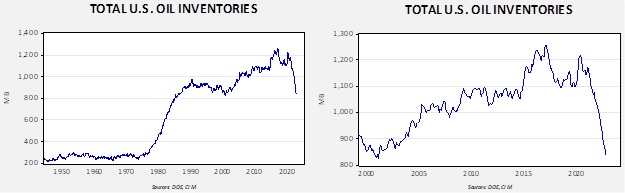
Since the SPR is being used, to some extent, as a buffer stock, we have constructed oil inventory charts incorporating both the SPR and commercial inventories.
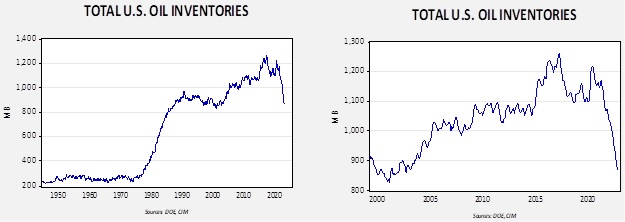
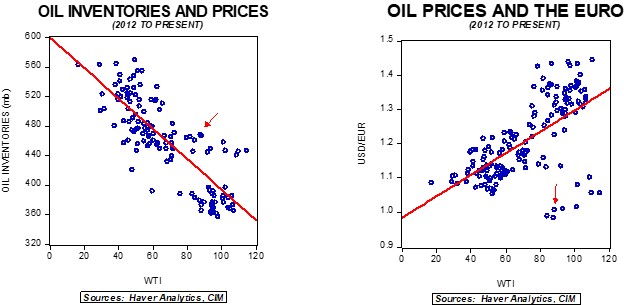
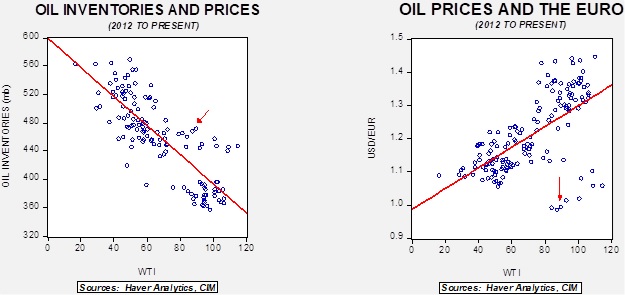
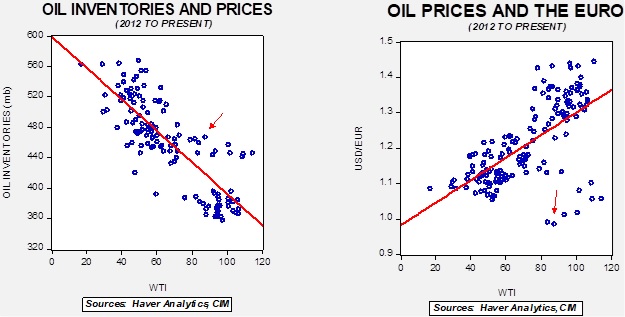
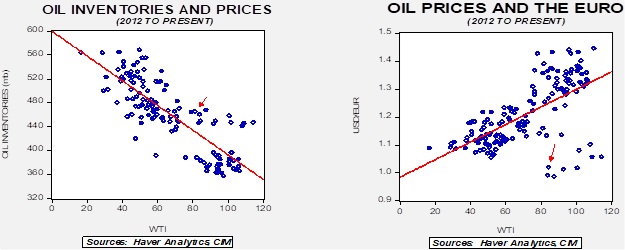
Total stockpiles peaked in 2017 and are now at levels last seen in 2002. Using total stocks since 2015, fair value is $107.47.
The Diesel Scare:
A prominent news personality recently suggested that “the country will run out of diesel fuel by Thanksgiving,” leading to a steady stream of questions to our inbox. So, here is our take…
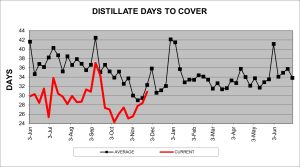
Diesel is part of a family of fuels called “distillates.” Other members of this family include heating oil (diesel with a higher sulfur content) and sometimes jet fuel. In general, diesel for road use has a lower sulfur content (it’s cleaner, in other words) so other distillates can’t easily be substituted for the diesel. In the weekly data, diesel demand isn’t broken out from overall distillate demand. To create a standardized measure of inventory (a mere level won’t tell you how much you have relative to demand), we divide stockpiles into daily demand. By dividing inventory into consumption, we determine how many days of supply are available given current demand. We are hearing that there are 21 days of inventory available, but since we can’t confirm diesel demand separate from distillate demand, we can’t confirm that number, although we can say that distillate stocks are tight, around 27 days.
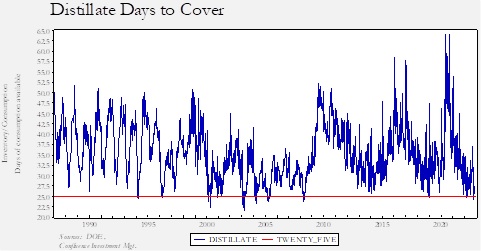
The above chart, which is weekly data going back to 1987, measures current distillate inventories compared to consumption. As the chart shows, levels are around 25 days, which is “tight.” On average, the “days to cover” is 35 days with a standard deviation of six days. So, the current level of 27 days is in the “bucket” of two standard deviations below average. At the same time, it is important to remember that this number tells us how many days we can go if our only source of distillate is inventory. That would assume the U.S. refining industry would close, and we couldn’t import any fuel. That isn’t the case. It is strictly true that we could run out of distillate by Thanksgiving, but only if we closed the ports and stopped refining completely, which isn’t likely. Simply put, conditions are tight but not dire.
Complicating matters is that Europeans are importing diesel as a backup fuel for electricity generation and heating, both at the utility level as well as the firm and household level.
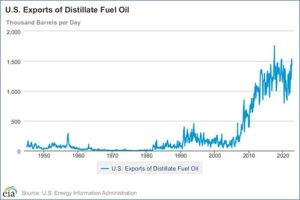
This is why the administration has floated export controls to ensure domestic supplies. The problem is that it will be hard to keep the EU supporting the war in Ukraine if Europeans are freezing because the U.S. won’t send diesel. At the same time, it will be hard to maintain support for the war in the U.S. if tight diesel supplies lift overall inflation. In the past, when diesel fuel stocks tightened, our exports were much smaller. So, the export situation has complicated matters.
We do have some refining capacity to tap. Currently, refinery capacity is running around 89%, so we could see increased production. Unfortunately, U.S. refinery capacity has been declining for some time as about 3.0 mbpd of refining capacity has closed since 1993.
There is yet another complication. The Northeast (PADD1) is facing a severe shortage of diesel. This region uses both natural gas and heating oil for home heating (the rest of the country mostly uses natural gas or propane) and so tight supplies can be a real problem. Due to the Jones Act, this region usually imports distillate from abroad because it is cheaper to use foreign shipping than higher cost U.S. shippers, who are protected by the act. But currently, Europe is absorbing the global supplies that would normally end up on the Eastern Seaboard. It is unclear how this situation will be resolved, but the overall tight distillate market is being exacerbated by the shipping situation to the Northeast.
We don’t expect that the trucking industry will “shut down” due to the lack of diesel; instead, diesel prices will likely rise, which will cause adjustments (more rail traffic, for example, as trains are much more efficient) and delays in shipping. However, the situation isn’t good. About the only silver lining is that for every barrel of crude oil refined, roughly a third is distillates and 55% to 60% is gasoline. As refiners lift production to meet diesel demand, we will get more gasoline in the market.
We also note that a weaker economy will reduce energy demand. Already, U.S. trucking firms are reporting that shipments are down and we note that European economies are slumping as well.
Natural Gas Update:
Natural gas prices have been weak lately as the storage injection season is near its end, the tropical storm season spared the oil sensitive regions of the Gulf of Mexico, and so far, temperatures have been mild. For the most part, the trends in supply and demand are balanced.
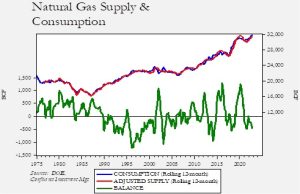
On a rolling 12-month basis, there is a modest level of excess demand. Meanwhile, inventories appear to be in balance.
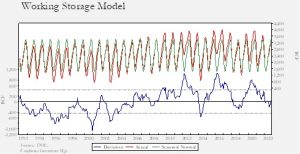
With supply and demand nearly in balance and inventories in line with seasonal norms, the direction of prices going forward will mostly be a function of temperature. The official NOAA forecast suggests that most of the nation’s major population centers will be normal to warmer-than-normal this winter.
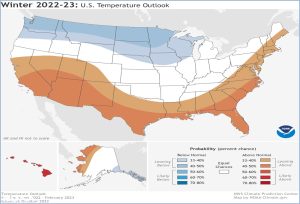
Of course, even in an otherwise mild winter, a cold snap can have important effects on demand and natural gas prices. Overall, though, the forecast does offer hope that home heating costs will be manageable.
Market News:
- In the latest IEA annual report, one of the more important assertions is that fossil fuels are approaching peak demand, in part driven by the war in Ukraine. We have doubts that this forecast is correct, but the fact that it exists will tend to affect investment decisions. In other words, if investors believe peak demand is on the horizon, there will be less incentive for investment, which will tend to crimp supply and lift prices.
- Major oil companies are reporting record-breaking profits. President Biden is floating a windfall profits tax, accusing the oil industry of war profiteering. In general, such taxes are counterproductive. If the goal is to increase supply, taxing it works against that outcome. If production remains low, the case for higher taxes on energy companies will become more compelling. However, unless the tax is crafted to offer exemptions for increased production, this tax won’t increase production. And, given the near certainty that the government will be divided after next week’s elections, the White House would have to put the tax through in the “lame duck” session.
- It looks like the price cap idea on Russian crude oil is slowly unraveling. It has been arduous to get enough nations on board with the plan, leading the U.S. to lift the proposed price cap. At the same time, it may be difficult for Russia to overcome the looming insurance ban, since the country may not have enough ships to avoid reducing exports.
- Although the U.S. is the world’s largest oil producer, it is also a major consumer as well. Complicating matters is the mismatch between what U.S. drillers produce and what refiners use. The U.S. tends to produce more sweet/light oil, whereas U.S. refiners prefer sour/heavy crudes. Thus, the U.S. tends to export the former and import the latter to make the adjustment. There are two nearby producers that generate sour/heavy oils: Canada and Venezuela. The former is a major exporter to the U.S. However, recent prices suggest that Canada could export even more to the U.S. if pipeline constraints were relieved.
- In recent reports, we have discussed how the SPR is evolving from a strategic reserve to a buffer stock. It seems that others are also thinking in a similar fashion. Buffer stocks in commodities have operated to the benefit of both consumers and producers, but they have a long history of failure. Scenes of blocks of processed cheese being tossed to the crowds from the back of trucks in the 1980s were the result of a buffer stock of dairy products that were used to keep milk prices above their market-clearing level. In our current situation, the failure point for the SPR is that there will never be a price low enough to trigger buying for the reserve. That’s because consumers really like free goods, and once you start buying for the SPR, you are setting a floor price.

(Source: Bloomberg)
- The current spread of Western Canadian Select and WTI is nearly $30 per barrel, nearly double the average of $16. Unfortunately, expanding pipelines is difficult, since local opposition tends to be high, and environmentalists have targeted pipeline construction as a way to reduce oil and gas production. So, instead, the administration is considering easing sanctions on Venezuela. Caracas has been under sanctions for its repressive tactics and support of drug trafficking.
- After prompting OPEC+ to cut production targets recently, the Saudi oil minister suggested that the Kingdom of Saudi Arabia (KSA) might be willing to lift output if the energy crisis worsens. He also suggested that the recent cuts had more to do with maintaining a supply buffer than lifting prices.
- Recently we have reported that LNG tankers are sitting off the Iberian Peninsula waiting to disgorge their cargos. Initially, it seemed they lacked a space to dock and regassify. However, recent indications suggest it may be more about waiting for higher prices. After all, as we noted last week, prices for prompt natural gas briefly turned negative due to weak prompt demand. Weaker EU demand relative to supply is creating a game of “chicken” for buyers and sellers. Current sellers who are hedged have to deliver the gas, and if they can’t, they must either take a lower price or offset the position but pay to store the gas on a tanker, which isn’t cheap.
- COVID infections are disrupting China’s coal industry.
Geopolitical News:
- U.S. forces in the Middle East and the KSA are said to be on “high alert” based on intelligence suggesting that Iran is considering an imminent attack. Riyadh is suggesting Iran is trying to distract its citizens from the ongoing protests.
- As protests continue in Iran, with university students staging strikes, the U.S. has announced additional sanctions and will put the Iran protests to the UN Security Council. Although Russia will protect Iran from UN action, the move is symbolic and will increase global awareness of the protests.
- Iraq has elected a new prime minister. Mohammed al-Sudani is considered to be an ally of Iran. It remains to be seen if he can hold his government together, given that the al-Sadr faction, which controls the most seats in the legislature, opposes Iran.
- One way the U.S. might retaliate against the KSA’s support of OPEC+ production cuts is by slowing the pace of arms sales to the Saudis. On a related note, the UAE has indicated that it opposed the KSA’s push to cut production targets, suggesting some divisions within the cartel.
- The new president of Colombia, Gustavo Petro, recently met with Venezuelan President Maduro in a bid to improve relations. The previous government ended formal relations in 2019.
Alternative Energy/Policy News:
- Although nuclear energy remains controversial, it does not give off any greenhouse gases during the production of electricity. Therefore, Western governments are slowly considering the expansion of nuclear power. However, Russia and Kazakhstan are significant global suppliers of uranium, meaning that without new sources, the West is merely trading one vulnerability (oil and gas) for another. The U.S. is actively considering policies to develop domestic uranium sources to support the nuclear power industry.
- The EU is not pleased with the recently passed Inflation Reduction Act as the provision tailors subsidies for purchasing EVs to those made in the U.S. This rule either prevents the buyer of a European EV import to receive the subsidy, or it forces a European automaker to make the car in the U.S. Needless to say, the EU isn’t thrilled with this new law and wants carveouts or loopholes added or it will consider retaliation. However, if the goal of the administration was to boost jobs in the U.S., allowing carveouts defeats the purpose. USTR Tai is in Europe trying to make Washington’s case; so far, though, she isn’t budging on ending the preference of U.S. production.
- California is planning on ending the sale of natural gas-fired furnaces and water heaters by 2035. Natural gas utilities in the state are looking to repurpose their pipeline networks, perhaps for hydrogen.
- Copper is a critical metal in the energy transition, but current production is running below demand and there doesn’t appear to be enough investment to meet future demand. Prices have soared on the imbalances.
- The government is supporting efforts to create electro-fuels, which are biofuels without the crops. By combining electricity, carbon dioxide, and algae, biofuels can be created. Although such fuels make environmental sense, they will face opposition from the farm lobby.
- Although Australia is a large producer of rare earths, the country’s resource minister indicated that his nation cannot, in the near term, replace China.
- The EU plans to end the sales of internal combustion engines by 2035.
- Renewable energy capacity is growing rapidly.
- In contrast, Germany is tearing down a wind farm to facilitate a lignite coal mine.
View PDF


 (Sources: DOE, CIM)