

Weekly Energy Update (August 3, 2023)
by Bill O’Grady, Thomas Wash, and Patrick Fearon-Hernandez, CFA | PDF
Oil prices challenged the upper end of the trading range but so far have failed to breakout above that level.
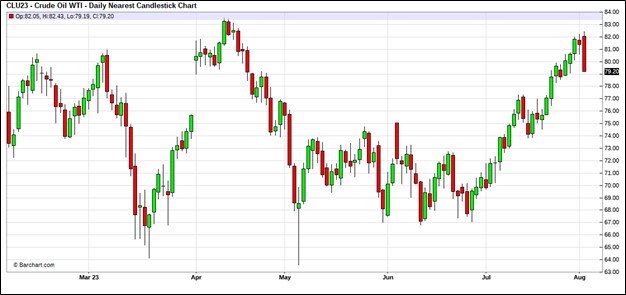
(Source: Barchart.com)
Commercial crude oil inventories fell a massive 17.0 mb, well above the 2.3 mb draw forecast. The SPR was unchanged.
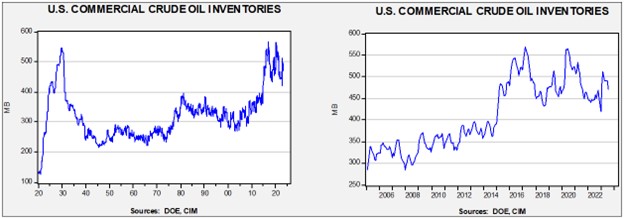
In the details, U.S. crude oil production was steady at 12.2 mbpd. Exports rose 0.7 mbpd, while imports increased 0.3 mbpd. Refining activity fell 0.7% to 92.7% of capacity.
(Sources: DOE, CIM)
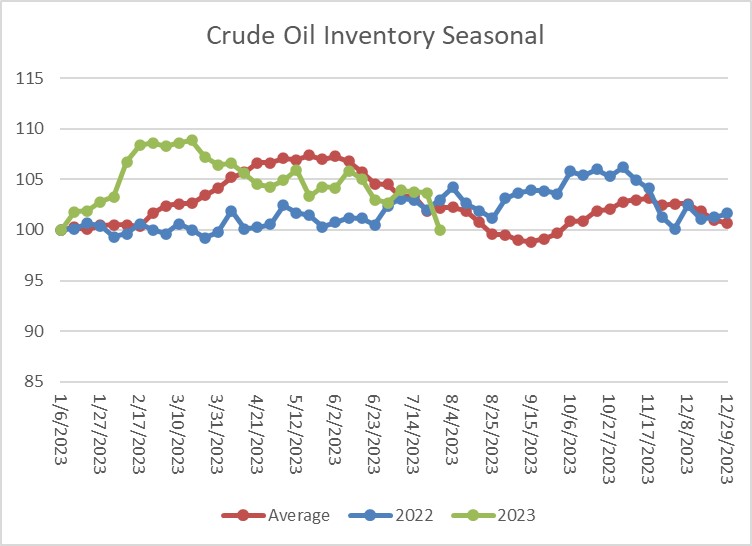
The above chart shows the seasonal pattern for crude oil inventories. Last week’s large decline has put inventories below their seasonal average.
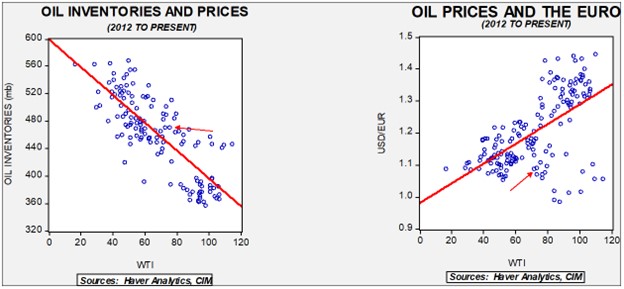
Fair value, using commercial inventories and the EUR for independent variables, yields a price of $65.79. Commercial inventory levels are a bearish factor for oil prices, but with the unprecedented withdrawal of SPR oil, we think that the total-stocks number is more relevant.
Since the SPR is being used, to some extent, as a buffer stock, we have constructed oil inventory charts incorporating both the SPR and commercial inventories.
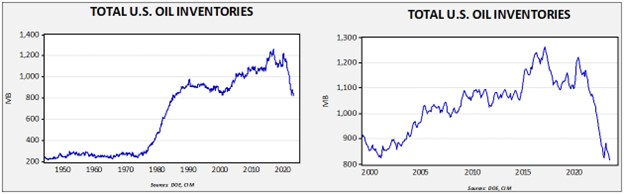
Total stockpiles peaked in 2017 and are now at levels last seen in late 1985. Using total stocks since 2015, fair value is $94.97.
Market News:
- Analysts expect the Kingdom of Saudi Arabia (KSA) to extend its voluntary production cuts. However, the continued loss of revenue is probably not sustainable. We do note that production from OPEC+ fell sharply in July.
- Rating agencies are threatening to downgrade PEMEX bonds due to its high debt load. There is a growing likelihood that PEMEX will default on its bonds, but given the government’s close relations with the company, a massive restructuring is also likely.
- The U.K. is easing environmental restrictions in a bid to boost North Sea oil and gas production. Although the Sunak government is being criticized by environmentalists, this sort of behavior isn’t uncommon. Most voters support environmental measures until standards of living are threatened.
- Managing pollution is a textbook economics problem. Pollution is an externality; in economic terms, it’s a bad outcome that isn’t reflected in the market price. Without outside intervention, the cost is shifted to society and away from the parties to the transaction. Gasoline consumption does trigger air pollution. In addition, insofar as gasoline is refined from foreign oil, there is a potential geopolitical externality that isn’t captured by the price at the pump. The most efficient way to address this problem is to estimate the externality’s cost and apply a tax. It’s also the least politically popular. For this reason, Congress and regulators have used other means to achieve this goal instead. Specifically, the government has applied mileage standards to automakers, called the Corporate Average Fuel Economy (CAFE) standards. This leads to automakers selling small, fuel-efficient cars at a discount so they can sell more of the popular larger vehicles. The EPA is looking to raise the CAFE standard to 58 mpg by 2035, which will likely force automakers to sell more EVs to meet this standard. A standard of this level would likely lead to lower gasoline consumption.
- Brazil and Guyana are expected to increase oil production over the next few years. The latter has turned out to be a very promising find. However, it’s unlikely that this new production will do much more than merely offset the impact of depletion.
- China and India have been driving global coal consumption. At the same time, China is running a broad-based energy policy. We note that it is building 23 nuclear reactors, accounting for 42% of global reactor construction.
- The U.S. has completed its first new nuclear power station since 2016. The 2016 plant was the first in two decades. The plant, in Georgia, was seven years overdue with cost overruns of $17 billion.
- Due to rising costs, the 6.0 mb planned injection into the SPR has been postponed.
Geopolitical News:
- The Trump administration’s diplomatic breakthrough in the Middle East, which led several Arab states to normalize relations with Israel, is starting to stall. The key goal was a normalization of relations between the KSA and Israel. The Saudis’ demand is a two-state solution with the Palestinians, which the Abraham Accords essentially undermined. It’s not clear just how much progress would be required in order to implement a two-state solution, but the Netanyahu government would probably have to take the Palestinians’ goals into account. The benefits of normalization would be significant. Israel could potentially develop military relations with the KSA, which would help both nations contain Iran. From the U.S. perspective, it could allow for a smaller American security footprint in the Middle East. Pivoting to China requires the U.S. to reduce its attention in other parts of the world, including the Middle East.
- Last week we reported that the U.S. had blacklisted 14 Iraqi banks from transacting in dollars due to their relations with Iran. The U.S. feared the banks were facilitating sanctions avoidance. The move sent the IQD plunging and triggered protests in Iraq.
- Iran and Iraq have a complicated energy trade which is mostly designed to evade sanctions.
- Iran has continued to escalate tensions in the Persian Gulf and the Gulf of Oman. This action has led the U.S. to send military resources to protect shipping.
- Pakistan is trying to import oil from Russia. However, it is struggling to make payment in CNY.
- Although most EU nations have either ended or curtailed Russian natural gas purchases, Austria is still importing a sizable amount of Russian gas. Before the war, Russia provided almost 80% of Austria’s natural gas. It still provides more than half, and in March, Russia supplied 74%. Austria, a bit like Switzerland, is officially neutral as this was the agreement reached in 1955 to end Soviet occupation. Like Germany, Austria was divided into four occupied zones after WWII. However, unlike Germany, this occupation didn’t evolve into two separate states. The occupation ended in 1955 with Austrian neutrality, and as such, the country isn’t a member of NATO, for example.
- Mongolia, wedged between China and Russia, is attempting to tread an independent policy path by seeking closer relations with the U.S. Mongolia is a major producer of energy transition minerals. We doubt the country will be able to make this goal work, but its attempt is worth watching.
- The KSA has become an aggressive investor in the mining industry. This action is likely an attempt to diversify its economy from its dependence on oil and gas. The entrance of Saudi Arabia into the industry intensifies the race to secure these metals.
Alternative Energy/Policy News:
- As EV sales rise, China is aggressively expanding its EV industry across the globe. So far, the U.S. is trying to fend off Chinese EV imports in order to build the domestic industry. The problem for the U.S. is that protecting domestic producers will slow the achievement of climate goals. Europe, on the other hand, appears to be more open to buying China’s EVs.
- China is also expanding its overseas efforts to secure EV metals.
- China’s main EV producers are setting new sales records.
- Several automakers are collectively trying to build out EV charging stations. Some of this drive is to create an alternative charging network to Tesla’s (TSLA, $255.71).
- Research by Capital Economics projects that EVs will displace 7.5% to 8.0% of global oil demand by 2050.
- The Swiss solar company Meyer Burger (MYBUF, $0.65) is postponing plans to expand a solar plant in Germany and opting for a new plant in Colorado to take advantage of U.S. subsidies.
- Commodity production throughout history has often been a dangerous pursuit. Turns out, mining for the metals needed for the energy transition is not exempt from this issue.
- China and the KSA have effectively gutted attempts to apply greenhouse gas emissions targets. Essentially, China is signaling that it will not comply with global attempts to curtail fossil fuel consumption.
- The lack of international compromise increases the odds that geoengineering will be tried as a solution to climate change.
- Hydrogen offers promise as a replacement fuel for hydrocarbons. By separating out the “carbon” part, the gas could be used directly with no pollution. However, the method by which hydrogen is created is complicated. The “greenest” hydrogen, using only renewable energy to split water, for example, is very expensive and difficult to scale. Energy groups want to tap the subsidies available for making hydrogen but use less “clean” methods in order to lower costs.
- Germany’s attempts to ban boilers in favor of heat pumps have been unpopular. Now, a controversy has emerged over the use of hydrofluoroolefins in heat pumps. Germany wants to prohibit the use of such gases in German heat pumps, meaning U.S. and other EU heat pumps would not be allowed. Foreign providers of heat pumps are arguing against the exclusion of hydrofluoroolefins.
- Offshore wind projects are in trouble due to rising costs of construction and key metals needed for the windmills.
- During the 1970s, oil companies, flush with cash, ventured into other businesses. Some bought coal companies, while others tried to diversify in other ways from oil and gas. For the most part, these investments didn’t do much for the oil companies. We note that oil companies are looking to invest in lithium production as extracting lithium from brine is a similar chemical process to petrochemicals. Whether this foray proves fruitful is another matter.