

Asset Allocation Bi-Weekly – A Regime Change in Bonds? (October 23, 2023)
by the Asset Allocation Committee | PDF
Jim Bullard, former president of the St. Louis Federal Reserve Bank, based his policy votes and economic analysis, in part, on a concept known as regimes. Our take on his concept is that an edifice of factors underly clearly observable correlations in markets, and when this edifice changes, the former rules of thumb no longer hold. Regime changes are jarring for investors as previous relationships no longer hold, and there is a sense that the world no longer makes sense. However, over time, new rules of the road emerge, and markets tend to become understandable again.
We think that something similar is occurring in long-duration fixed income. Since the early 1980s, low inflation volatility (supported by globalization and deregulation) and strong confidence in the Federal Reserve’s ability to give value to the dollar and suppress inflation, led to steadily falling long-term bond yields. Consequently, this allowed investors to use bonds as a buffer in portfolios, fostering solid performance of the 60/40 portfolio. However, as we have been detailing for some time, the steady erosion of U.S. hegemony is undermining globalization and as the world factures, national security concerns are overriding efficiency. This set of circumstances are expected to lead to higher and more volatile inflation.
In an attempt to quantify what this means for investors going forward, we use a reduced form of our 10-year T-note model. First, let’s look at the model from 1960 through the present:
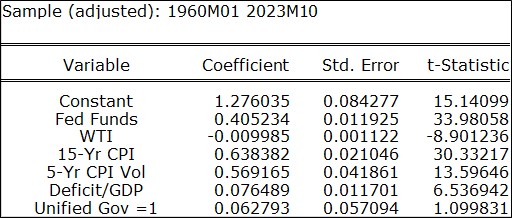
The model includes the fed funds rate, oil prices (WTI), the 15-year average of yearly CPI (which is our inflation expectations proxy), the five-year standard deviation of yearly CPI, the deficit to GDP ratio, and a binary variable for periods when Congress and the White House are controlled by the same political party. There are a few unexpected outcomes. First, oil prices carry a negative coefficient, meaning that higher oil prices lead to lower yields. Second, the coefficient on the deficit is also positive, meaning that larger deficits bring lower yields. Both are contrary to common expectations.
Now, let’s look at the model from 1960 through 1982. This was the pre-Volcker era, where it was generally held that monetary and fiscal policies should work in concert, and after the gold standard was ended in 1971, there was uncertainty surrounding what would give value to fiat currency.
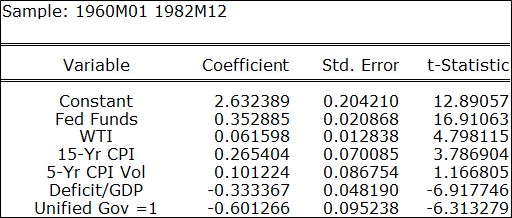
Note the differences from the overall model. First, the oil price and deficit coefficients are positive, which means that rising oil prices and deficits led to higher interest rates. Also, a unified government led to lower yields. We suspect the government variable reflects a period when there was greater confidence in government, and thus, a clear mandate (expressed by single party dominance) led to lower yields.
Now for the 1983 through the current period model:
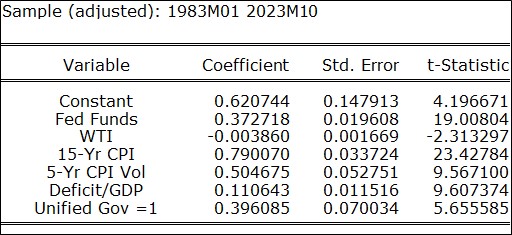
Some major changes have emerged. First, the oil coefficient sign flipped, meaning higher oil prices have led to lower yields. The best explanation of this circumstance is that investors had faith that the Fed would see high oil prices as an inflation threat and would move to tighten policy to ensure oil price increases didn’t lead to persistent inflation. Second, the trend in inflation has had a much greater impact on yields when compared to the earlier period. This change likely reflects the “scars” of the high inflation period of the 1970s. At the same time, the deficit variable’s sign also flipped as higher deficits led to lower yields. This change likely reflects faith that the Fed will lean against deficit spending. In other words, Volcker was seen to have implemented Fed independence, which, along with a clear inflation target, replaced gold as the factor that gave credibility to the dollar. Finally, the lack of faith in government is reflected in the sign flip of that variable. Since 1983, a unified government has led to higher yields on the expectations that an administration with such a mandate would use it to spend money and potentially bring inflation. Or, put another way, a divided government was considered a positive.
Recent market behavior has raised concerns that the regime that began in 1983 could be ending. Large fiscal deficits have led to fears of rising debt service costs. There is increasing worry that we could be approaching fiscal dominance, where the Fed is no longer independent because it must partially monetize Treasury spending to maintain order in the Treasury bond market. This outcome may not materialize since it’s possible that policymakers would implement austerity measures to reduce deficits, although there is some evidence to suggest that investors doubt the resolve of policymakers. If the Fed’s independence is compromised, we would likely see oil prices become positively related to yields again.
What will be important going forward is that the truism of the past forty years may not hold to the same degree. That doesn’t mean we will completely revert to relationships last seen in the 1960-82 period, but it probably means that a breakdown in variable relationships from the most recent period is likely. Investors should be prepared for new relationships to emerge over time.