

Tag: recession
Asset Allocation Bi-Weekly – #151 “When the Financial System Finds a Cockroach” (Posted 11/3/25)
Asset Allocation Bi-Weekly – When the Financial System Finds a Cockroach (November 3, 2025)
by Thomas Wash | PDF
No one likes finding a cockroach, especially in a place that should be clean, like the financial system. Last month, JPMorgan CEO Jamie Dimon issued a warning, suggesting that isolated loan failures — the “cockroaches” — are pointing to a much broader credit risk problem. He specifically flagged risky loan assets held by specialized lenders such as TriColor, stating that their poor performance is likely evidence of a generalized decay in loan quality across the consumer sector.
The deterioration in loan quality appears to reflect a mounting consumer debt burden that is now leading to significant household financial strain. Credit card delinquencies have surged to their highest level since the 2008 financial crisis, underscoring this pressure. In response, lenders are tightening underwriting standards and curbing new card issuance, particularly to subprime borrowers. This defensive shift indicates that the rise in defaults is largely concentrated among existing borrowers rather than driven by a fresh wave of risky lending. Yet, there is more to the story.
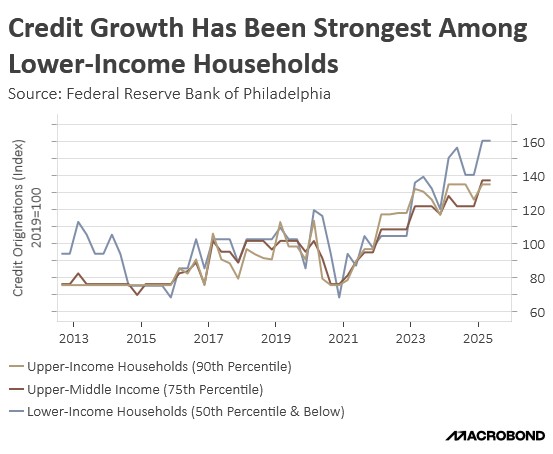
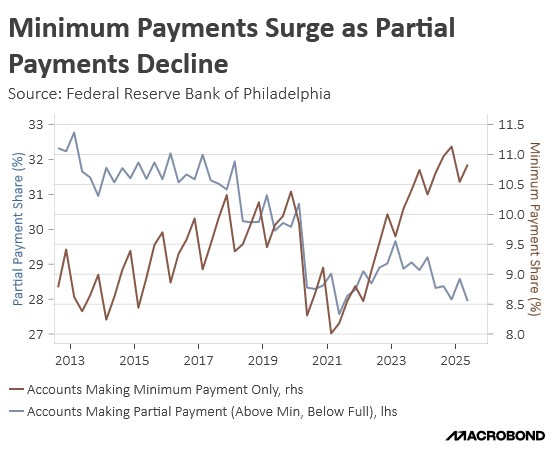
The recent rise in delinquencies can be partially traced to the massive expansion of consumer credit since 2019, especially among lower-income households. Credit availability for the bottom half of cardholders has surged nearly 60%, allowing many to maintain consumption amid persistent inflation. While this expansion has inevitably increased overall debt burdens, it has also enabled households to preserve spending power by spreading purchases into smaller, more manageable payments rather than paying the full cost upfront, even as real incomes have struggled to keep pace.
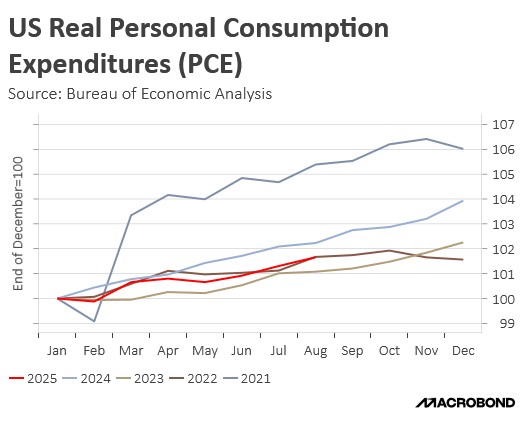
This surge in consumer credit has been a key mechanism sustaining consumption during recent periods of economic uncertainty. Despite repeated recession warnings over the last three years (citing the 2022 market contraction, 2023 failure of Silicon Valley Bank, and fleeting 2024 Sahm Rule alarm), aggregate consumption has remained remarkably resilient. While recent tariffs have slowed consumption compared to the previous year, the overall pace remains consistent with the strong trend that was set over the last four years.
While pockets of consumer weakness are evident, the broader systemic risk still appears to be limited. Subprime borrowers, despite the expansion of credit, hold a relatively small share of total household debt. According to Moody’s Analytics, subprime loans stood at $2.63 trillion in September, or about 15.3% of household debt. That’s a far cry from 2007 when subprime exposure reached $3.38 trillion and accounted for 28.2% of the total. The current, much smaller concentration suggests that today’s risks are more contained.
Furthermore, the immediate impact of weakness in the consumer credit market on the broader economy is likely to be muted. This continued stability in the economy is rooted in the labor market, where unemployment remains relatively low. Firms have largely retained staff, even while curtailing new hiring. The persistence of high employment means households should still be able to meet the minimum payments on credit cards and other consumer loans, suggesting their financial perseverance may last longer than many observers anticipate.
In addition, the overall US economy and total consumption expenditures are currently disproportionately dependent on high-income households. For example, the top 20% of earners account for approximately 40-50% of all consumer spending (depending on the specific measure and source). This significant concentration means that while low-income households may be forced to reduce spending due to financial strain, the overall momentum of the economy can be sustained by the resilience of the wealthiest earners.
As noted by JPMorgan, the appearance of “cockroaches” in consumer credit confirms a structural weakness. However, we conclude that this distress is a medium-term challenge, not a short-term systemic threat. This assessment is rooted in three factors: the resilience of the high-income consumer, the contained nature of subprime debt, and the strength of the jobs market. We therefore remain confident in projecting continued economic momentum and even an acceleration in economic growth next year, which should directly support strong corporate earnings and sustained broad-based support for equity markets.
Don’t miss our accompanying podcasts, available on our website and most podcast platforms: Apple | Spotify
Confluence Mailbag – #4 “Dollar Dynamics and the Future of Fed Independence” (Posted 10/7/25)
Business Cycle Report (September 25, 2025)
by Thomas Wash | PDF
The business cycle has a major impact on financial markets; recessions usually accompany bear markets in equities. The intention of this report is to keep our readers apprised of the potential for recession, updated on a monthly basis. Although it isn’t the final word on our views about recession, it is part of our process in signaling the potential for a downturn.
The US economy continued to expand in August, though warning signs are starting to appear. Our proprietary Confluence Diffusion Index remained out of contraction territory for the seventh straight month. Three indicators slipped back into contraction, raising the total number of warning signals to five out of 11. Despite these concerns, both stock and bond markets were bolstered by optimism regarding a potential shift in monetary policy. Signals from the “real economy” remain mixed, with business spending holding up, while households and firms continue to express concerns about the impact of tariffs. The labor market showed a notable slowdown, with firms hiring fewer workers, indicating a weakening in labor demand.
Financial Markets
Investors broadened their focus beyond the Information Technology sector. This shift is supported by growing optimism about the wider economy, driven by strong corporate earnings. Leading the performance charge were the Health Care and Materials sectors. In the bond market, yields have begun to fall as recent economic data suggests the Federal Reserve will prioritize maximum employment over price stability. This change in sentiment is largely due to evidence that the hiring slowdown was more significant than initially estimated, while inflation, though still elevated, has remained roughly in line with expectations.
Goods Production & Sentiment
August’s economic data presented a mixed picture. While new orders continued to show signs of strength, the housing market painted a different story. Housing starts fell last month, in an indication that homebuilders remain hesitant to begin new projects due to ongoing uncertainty in the market. At the consumer level, households expressed growing apprehension about the labor market and persistent concerns over rising prices. Conversely, the business outlook, while still subdued, showed signs of improvement as deliveries have picked up, driven by firms actively rebuilding their inventories.
Labor Market
The US labor market showed further signs of deterioration in August, with hiring slowing to a critical level. For the first time since the pandemic, the number of payrolls has dipped into “contraction” territory, a clear signal that labor demand has weakened. While the unemployment rate remains low, it did tick up slightly from the previous month. Nevertheless, initial jobless claims have remained relatively subdued, suggesting that firms are still reluctant to lay off workers. The shift toward a “low-hiring, low-firing” labor market is a notable trend.
Outlook & Risks
The economy may have lost some of its momentum, but it remains in a good state. The possibility of easier monetary policy and continued investment in AI should provide a lift. We believe the markets will continue to focus on monetary policy and corporate earnings as investors seek reassurance that the economy is not being negatively impacted by tariffs. Consequently, we are cautiously optimistic about risk assets, given the strong underlying fundamentals, but we are waiting for confirmation that this growth is sustainable for the medium term.
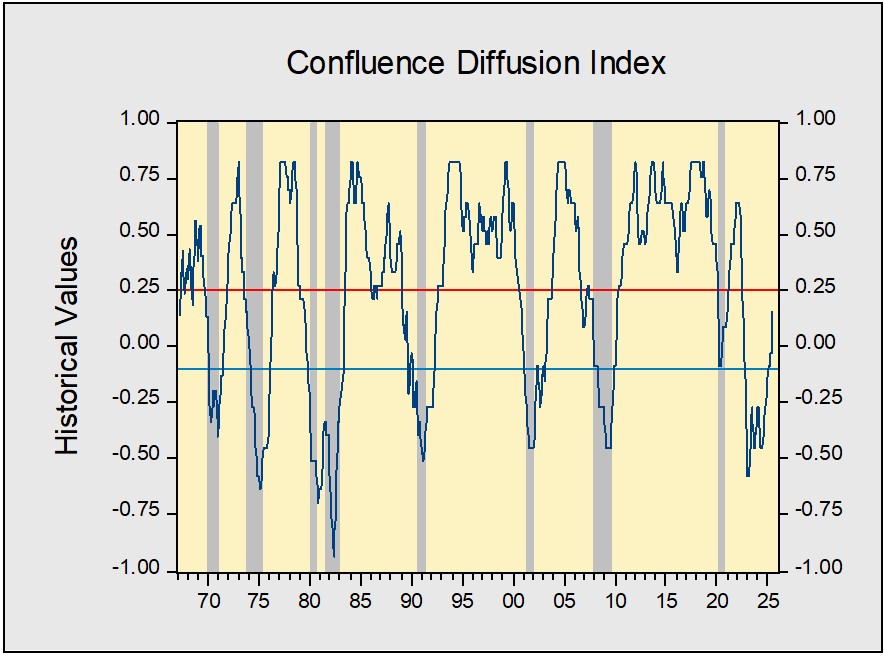
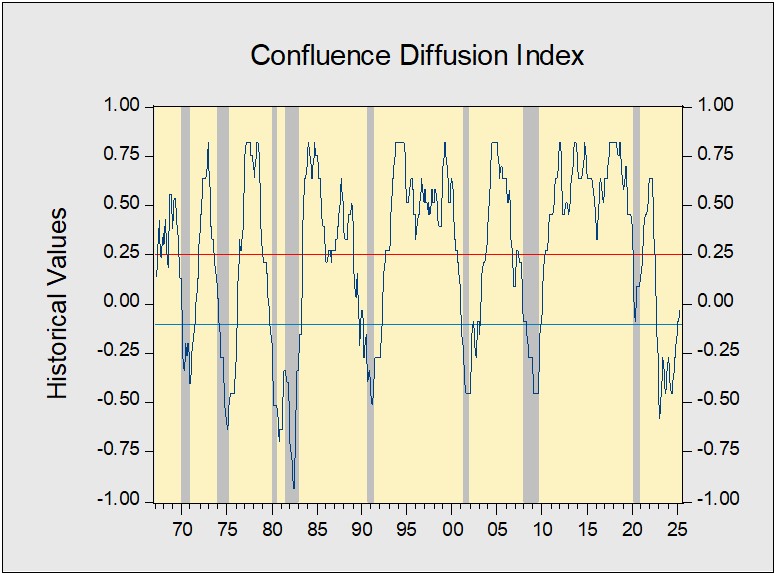
The Confluence Diffusion Index for September, which provides a composite view of the economy based on 11 benchmarks, remains in expansionary territory according to August data. The index’s value fell from +0.1515 in July to +0.0909 in August, but it is still well above the recovery signal threshold of −0.1000. This shows that while the economy continues to expand, the breadth of that expansion is narrowing. This is further evidenced by the fact that five of the 11 benchmarks are now in contraction, an increase from just two last month.
- Job growth concerns led to a flattening of the yield curve.
- Consumer sentiment is being weighed down by job uncertainty.
- The labor market appears to be in a phase of “low hiring and low firing.”

The chart above shows the Confluence Diffusion Index. It uses a three-month moving average of 11 leading indicators to track the state of the business cycle. The red line signals when the business cycle is headed toward a contraction, while the blue line signals when the business cycle is in recovery. The diffusion index currently provides about six months of lead time for a contraction and five months of lead time for recovery. Continue reading for an in-depth understanding of how the indicators are performing. At the end of the report, the Glossary of Charts describes each chart and its measures. In addition, a chart title listed in red indicates that the index is signaling recession.
Business Cycle Report (August 28, 2025)
by Thomas Wash | PDF
The business cycle has a major impact on financial markets; recessions usually accompany bear markets in equities. The intention of this report is to keep our readers apprised of the potential for recession, updated on a monthly basis. Although it isn’t the final word on our views about recession, it is part of our process in signaling the potential for a downturn.
The US economy sustained its expansion in July, and our proprietary Confluence Diffusion Index stayed out of contraction territory for the sixth straight month. Two indicators entered expansion territory, which helped lift the overall diffusion index. Despite initial concerns, the equity markets were positively affected by the reduction in trade uncertainty. Bond markets, however, showed concern about the potential removal of Federal Reserve Chair Powell. Signs of improvement were also seen in the real economy, with both business spending and construction showing growth. The labor market remained stable but did show some signs of weakening.
Financial Markets
Equity markets are proving resilient, with the ongoing trade friction having little apparent impact on investor sentiment. This optimism has spurred a rally, led by strong performances in the Utilities and Information Technology sectors. In the bond market, yields are rising, a reflection of growing investor unease over a potential threat to the Federal Reserve’s independence. The concern is that if its autonomy is compromised, the Fed could be pressured to prioritize maximum employment over its core mandate of price stability, an outcome that would have significant implications for monetary policy.
Goods Production & Sentiment
July brought encouraging signs of resilience across key economic sectors. The goods production and sentiment segments notably improved, marked by the first expansion in our indicator that tracks the three-month average of new orders for core nondefense capital goods since 2022. This industrial strength was complemented by a significant jump in housing starts, driven by a pivot toward larger multi-family projects. Furthermore, consumer confidence rebounded noticeably as expectations began to normalize following earlier tariff-related shocks, although the indicator remains in contraction territory.
Labor Market
The labor market was the sole category exhibiting signs of weakness, but conditions remain broadly healthy. A slight increase in the unemployment rate weighed on the index, pulling it further into contraction territory. However, downward revisions to July’s nonfarm payrolls pushed the indicator to just above the contraction threshold. Some of this weakness is attributable to firms adopting a more risk-averse approach amid ongoing trade uncertainties; this should improve as greater policy clarity emerges.
Outlook & Risks
The economy is on solid footing, with some metrics reaching post-pandemic highs. This trend is expected to continue, provided policy remains predictable. Markets are likely to focus on the potential for monetary easing. While lower rates could mitigate the impact of tariffs on businesses, they also risk fueling inflation by stimulating consumption. Consequently, we are cautiously optimistic on risk assets due to strong fundamentals but await confirmation that this growth is sustainable for the medium term.
The Confluence Diffusion Index for August, which encompasses data for July, remains well above the recovery indicator. However, two of the 11 benchmarks remained in contraction territory from last month. Using July data, the diffusion index rose from -0.0303 to +0.1515, above the recovery signal of -0.1000.
- Equities softened due to trade tensions but remain elevated.
- Business spending showed signs of picking up.
- Revisions hurt job numbers but not enough to enter contraction territory.
The chart above shows the Confluence Diffusion Index. It uses a three-month moving average of 11 leading indicators to track the state of the business cycle. The red line signals when the business cycle is headed toward a contraction, while the blue line signals when the business cycle is in recovery. The diffusion index currently provides about six months of lead time for a contraction and five months of lead time for recovery. Continue reading for an in-depth understanding of how the indicators are performing. At the end of the report, the Glossary of Charts describes each chart and its measures. In addition, a chart title listed in red indicates that the index is signaling recession.
Asset Allocation Bi-Weekly – #145 “No Country for Recessions” (Posted 8/8/25)
Asset Allocation Bi-Weekly – No Country for Recessions (August 4, 2025)
by Bill O’Grady | PDF
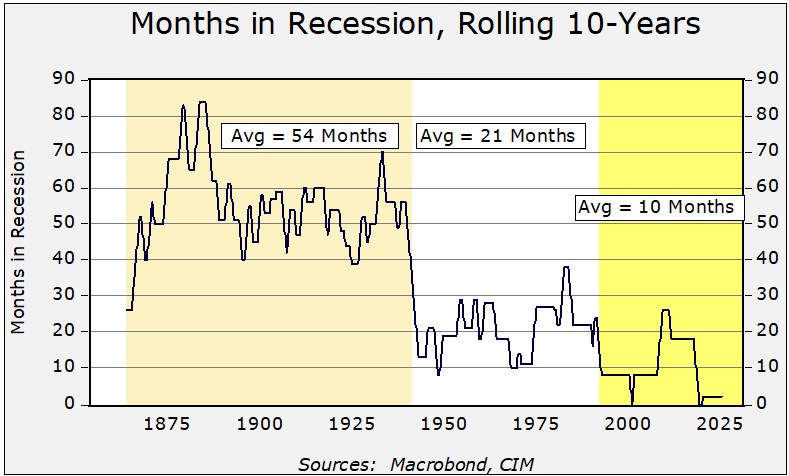
Recessions in the United States have become less frequent over time. To illustrate this, the chart below shows data from the National Bureau of Economic Research, the official arbiter of recessions in the US, which has been establishing business cycles since January 1854. In the chart, we show the total months spent in recession over a rolling 10-year period. Clearly, we have seen the incidence of recession decline over time. From 1864 until 1940, recessions occurred, on average, 54 months out of 120 months, or 45% of the time. From 1941 to 1991, the average declined to 21 months, or 18% of the time. Since 1991, the average fell to 10 months, or 8% of the time.
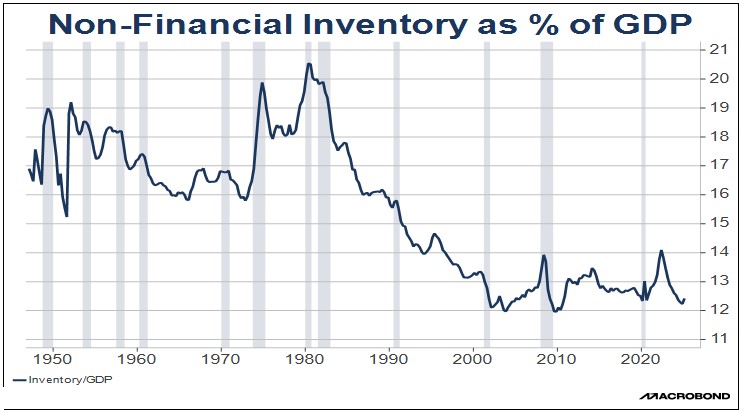
Why has the incidence of recessions declined? There are three primary reasons. First, as the economy evolved into being dominated by services instead of manufacturing, there were less inventory misallocations causing slumps, especially after 1980. As shown in the next chart, inventories relative to gross domestic product (GDP) have clearly fallen. Therefore, the likelihood of excess inventories or other issues arising from misallocation of inventory also fell.
Second, until the 1930s, recessions were thought to be natural occurrences. Often, the burden of policies that allowed recessions tended to fall on debtors and the lower classes, who had limited political influence. After WWI, this idea became contested and was one of the reasons for the unraveling of the gold standard. Because the gold standard created inelastic conditions for liquidity, central banks were restricted from easing credit conditions during downturns, leading to deflation. After WWII, monetary and fiscal policy became countercyclical; in other words, policies were designed to either prevent or mitigate recessions. By the mid-1990s, monetary policy transparency became the norm, further reducing the amount of policy shocks.
The third factor behind less-frequent recessions is the expansion of globalization that started in 1978 with deregulation and accelerated after the end of the Cold War. The rise of globalization increased the available supply, which led to lower inflation and a decline in interest rates. This period, dubbed “the great moderation,” made it easier to extend the business cycle.
This history raises two questions. First, will this period of infrequent recessions continue? And second, what are the ramifications if it does? Addressing them in order, it’s likely that infrequent recessions will continue because two of the three conditions described above should remain in place. We expect that services will continue to dominate the economy, while modern inventory management will maintain stability. At the same time, countercyclical policy isn’t likely to change. If anything, policy accommodation appears to be expanding (raising inflation concerns). In our view, only the third condition for less-frequent recessions will be less supportive. As the US attempts to rebalance the global trading environment, imports will become less plentiful, and the potential for supply shocks will rise. Of course, as domestic production responds, the potential for foreign-driven supply shocks (as observed during the pandemic) will also be less of an issue. But overall, the trend toward fewer downturns looks to be in place.
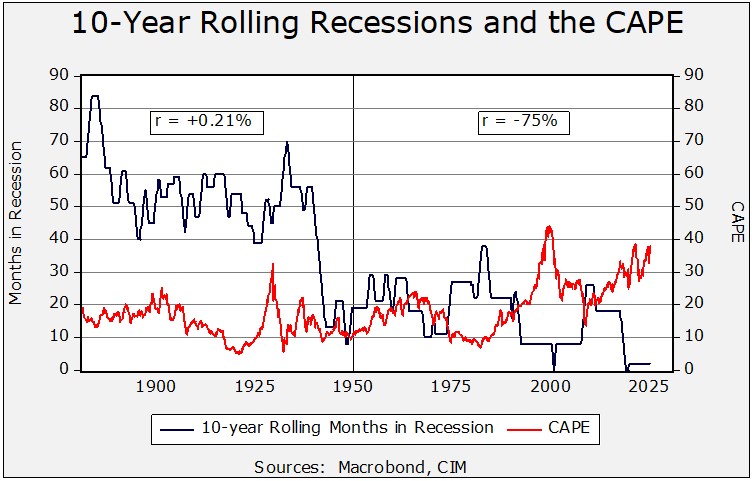
What does this mean for equity markets? Less frequent recessions, at least in the postwar period, correlate with higher price/earnings multiples. We show this in the chart below, which overlays the rolling decades of recessions with the Shiller cyclically adjusted P/E ratio. From 1870 to 1950, the correlation was low and positive. However, since 1950, the correlation has increased significantly and turned negative. In other words, the declining occurrence of recessions is now associated with higher stock valuations.
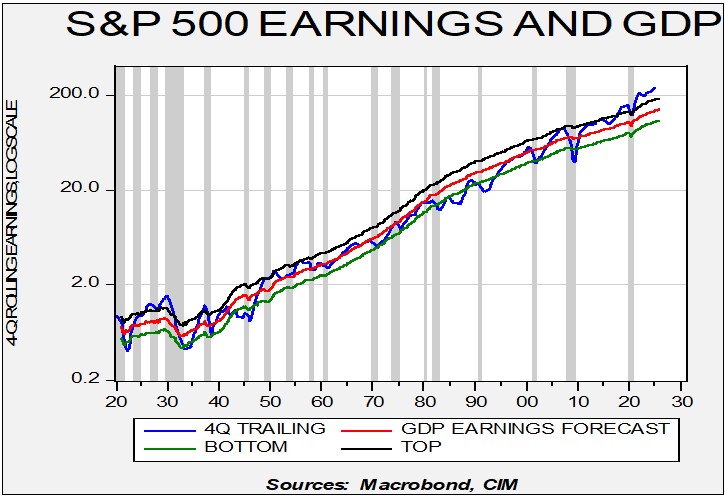
Finally, the chart below shows S&P 500 earnings on a four-quarter rolling basis compared to a regression of earnings to nominal GDP. Recessions are indicated by the vertical grey bands. The chart shows that, in the postwar era, recessions tend to depress earnings. Thus, if recessions remain less frequent, it makes sense that the earnings multiple would be higher. Investors generally can worry less about economic downturns, giving them greater confidence to bid up stock values relative to earnings.
Don’t miss our accompanying podcasts, available on our website and most podcast platforms: Apple | Spotify
Business Cycle Report (July 31, 2025)
by Thomas Wash | PDF
The business cycle has a major impact on financial markets; recessions usually accompany bear markets in equities. The intention of this report is to keep our readers apprised of the potential for recession, updated on a monthly basis. Although it isn’t the final word on our views about recession, it is part of our process in signaling the potential for a downturn.
The US economy sustained its expansion in June, and our proprietary Confluence Diffusion Index stayed out of contraction territory for the fifth straight month. Most indicators showed improvement or only modest changes from the prior month. Financial markets reflected continued optimism from trade progress, lifting equity sentiment, while bond markets signaled lingering uncertainty over inflation and monetary policy. The real economy is showing resilience, with production levels improving (though still well below their peak) and both business and consumer sentiment on the rise. The labor market also looks stable as firms remain reluctant to cut jobs.
Financial Markets
Equity markets are adjusting to tariff-related headlines as confidence grows that the worst of the disruptions has passed. This optimism has driven a sustained rally, with tech stocks leading the gains. US government bonds have remained rangebound as a decline in the 10-year Treasury yield has pushed the financial spread (measured by the 10-year yield minus the effective fed funds rate) into contraction territory. However, this compression likely reflects shifting expectations around Fed policy rather than underlying economic stress as markets continue to assess the timing and magnitude of potential rate cuts this year.
Goods Production & Sentiment
The goods production and sentiment segments remain the weakest component of the business cycle report. In June, three of the four key diffusion indicators remained in contraction. While consumer sentiment showed an improved household inflation outlook, concerns have shifted toward labor market conditions. Business sentiment also edged higher, with supplier deliveries continuing to signal expansion. On a positive note, housing construction activity picked up modestly, led by multi-family projects. Meanwhile, a proxy for investment spending showed marginal improvement but stayed in contractionary territory.
Labor Market
The latest labor market data underscored the economy’s continued durability, with the unemployment rate unexpectedly dropping to 4.1% as more people secured jobs, though a deeper dive into the payroll numbers reveals a more nuanced picture. Nearly half of all new positions were created in state and local governments, highlighting the public sector’s outsized role in driving recent job growth. The steady decline in jobless claims suggests private employers are also retaining workers, signaling broader labor market strength.
Outlook & Risks
The economy is proving to be remarkably resilient, even with new tariffs in play. As trade deals are concluded, businesses and households should gain a clearer roadmap for navigating this evolving landscape. The new tax bill is a welcome shot of relief and is set to reduce recession risk. We’ll get an even better read on its full positive impact over time. Our focus stays squarely on earnings. As long as firms show flexibility and creativity in adjusting, we anticipate continued stability. But if companies shrink their margins, we could still see some economic volatility.
The Confluence Diffusion Index for July, which encompasses data for June, remained slightly above the recovery indicator. However, the report revealed that four of the 11 benchmarks remained in contraction territory from last month, and one additional indicator has now crossed into contraction for the month of June. Using June data, the diffusion index was unchanged at -0.0303, above the recovery signal of -0.1000.
- Stocks sustained the previous month’s momentum while bonds remain in holding.
- Sentiment and production showed signs of improvement.
- The labor market has softened but remains tight.
The chart above shows the Confluence Diffusion Index. It uses a three-month moving average of 11 leading indicators to track the state of the business cycle. The red line signals when the business cycle is headed toward a contraction, while the blue line signals when the business cycle is in recovery. The diffusion index currently provides about six months of lead time for a contraction and five months of lead time for recovery. Continue reading for an in-depth understanding of how the indicators are performing. At the end of the report, the Glossary of Charts describes each chart and its measures. In addition, a chart title listed in red indicates that the index is signaling recession.