

Tag: Federal Reserve
Asset Allocation Bi-Weekly – Activist vs. Accommodative Treasury Issuance (August 26, 2024)
by the Asset Allocation Committee | PDF
The Federal Reserve and the US Treasury are independent government agencies with the shared objective of economic prosperity. While the Treasury manages government finances and executes fiscal policy, the Fed focuses on monetary policy as it aims to maintain price stability and full employment. Despite the Fed and the Treasury having distinct roles, there is an ongoing debate over whether they should coordinate their policies or whether it’s appropriate for one to work at cross-purposes with the other, particularly in the context of the big US budget deficit and growing debt load.
A recent report has accused the Treasury of intentionally shifting its debt issuance strategy to favor shorter-term bills over longer-term notes to the detriment of the country. Economists Nouriel Roubini and Stephen Miran, both Treasury veterans, contend in their paper, “ATI: Activist Treasury Issuance and the Tug-of-War Over Monetary Policy,” that this strategy is a deliberate attempt to counteract the Fed’s tightening measures and artificially stimulate the economy.
The Roubini and Miran paper argues that the Treasury’s strategy effectively amounts to a covert form of quantitative easing (QE). When the Fed employs QE to stimulate the economy, it purchases long-term bonds, thereby suppressing interest rates. The Treasury can achieve a similar outcome by shifting toward shorter-term debt issuance. By reducing the supply of longer-term bonds, the Treasury can indirectly push up their prices and lower their yields, effectively loosening financial conditions.
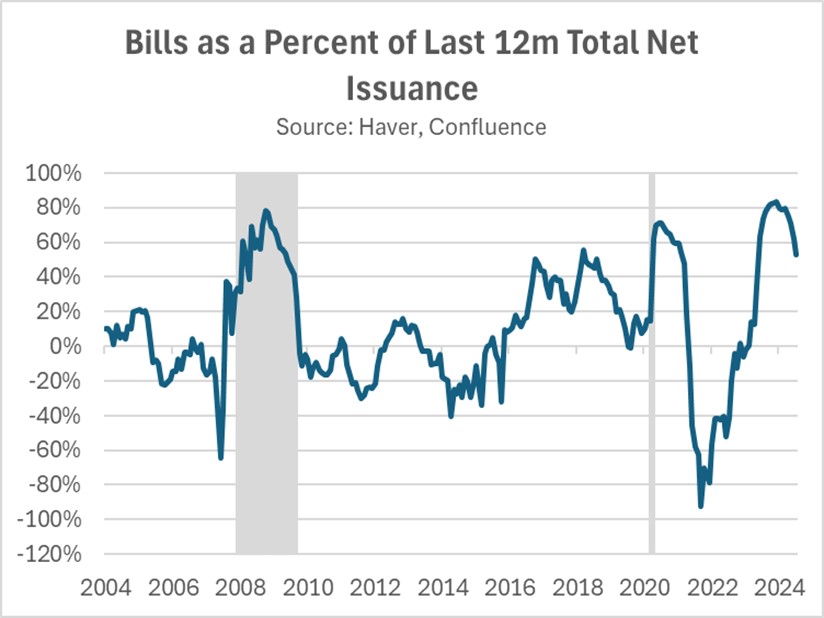
Roubini and Miran contend that the Treasury’s shift toward more bill issuance has counteracted the Fed’s effort to tighten monetary policy, contributing to the robust economic growth and elevated inflation seen in Q1 2024. According to Roubini and Miran, Treasury bills serve as a near-cash asset, enabling financial institutions, institutional investors, and corporations to secure loans by using them as collateral. In essence, the issuance of new Treasury bills can amplify the money supply through the money multiplier effect, which increases market liquidity.
While they acknowledge the typical shift toward shorter-term Treasury issuance in economic downturns, Roubini and Miran argue that the current pronounced bias for bills over notes is exceptional and may be politically motivated. By prioritizing bill issuance, the Treasury may have sought to avert a surge in long-term interest rates typically associated with bond sales. This strategy is credited with contributing to a decline in 10-year yields, which, in turn, has fueled risk appetites and inflated stock valuations in the lead-up to the election.
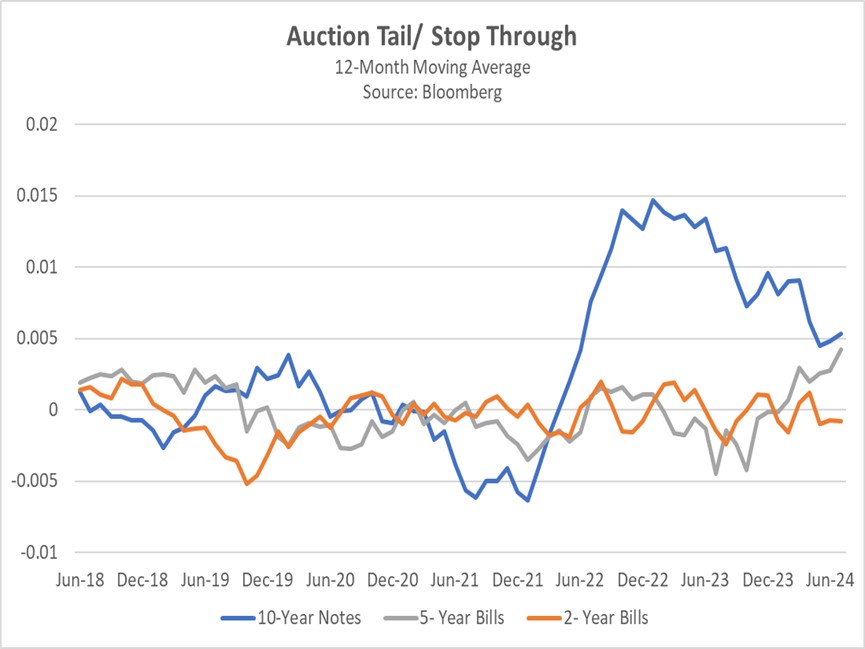
However, an alternative explanation for the Treasury’s issuance reallocation lies in the market’s response to rising interest rates. When the Fed initiated rate hikes in 2022, demand for longer-term bonds weakened due to increased interest rate risk. Conversely, demand for shorter-term Treasury bills surged, primarily driven by money market funds and institutional investors seeking higher yields on short-term assets. This market dynamic is reflected in the results of Treasury auctions, with 10-year bonds consistently undersubscribed and two-year bills frequently oversubscribed.
Moreover, the Treasury’s issuance strategy may not be as counterproductive as Roubini and Miran imply, since the sale of bills has mitigated the need for extraordinary Fed intervention in the economy. Prior to the change, the banking sector faced severe liquidity challenges following the collapse of Silicon Valley Bank in 2023 due to heavy investments in low-yielding, long-duration bonds. As interest rates rose, bond values fell and hindered banks’ ability to use them as collateral to meet short-term cash needs. In response, the Fed established new lending facilities, which helped address the immediate crisis but hampered its balance sheet reduction efforts.
By significantly increasing bill issuance, the Treasury provided the banking system with high-quality collateral, therefore mitigating the risk of a liquidity crunch within the repo market. This buffer has made it easier for the Fed to maintain its policy tightening without hurting the financial system. As interest rates begin to decline, the urgency of this allocation strategy will lessen, leading to a gradual reduction in Treasury bill issuance as a share of total issuance.
Contrary to Roubini and Miran’s assertion, the Treasury’s allocation strategy has actually seemed to support the Fed’s objectives. It has enabled the Fed to prolong quantitative tightening and maintain higher interest rates for an extended period and has increased the likelihood of a soft landing. However, this cooperative stance could potentially embolden the Fed to adopt a more gradual easing path, which would benefit short to intermediate bond yields.
Asset Allocation Bi-Weekly – Is the Sahm Rule Right? (August 12, 2024)
by the Asset Allocation Committee | PDF
While there has been some speculation that the US economy may be headed for a recession, one indicator suggests it has already begun. The “Sahm Rule,” a widely used metric for determining the early stages of recession, was triggered in July. Created by former Federal Reserve economist Claudia Sahm, this rule posits that the economy is in recession when the three-month average of the unemployment rate rises by at least 0.5 percentage points above its lowest level in the past year. In July, after five straight increases in the unemployment rate, the three-month moving average stood 0.53 percentage points above its low point over the last year. However, while the indicator has a strong track record of signaling when the economy is in recession, this time might be different.
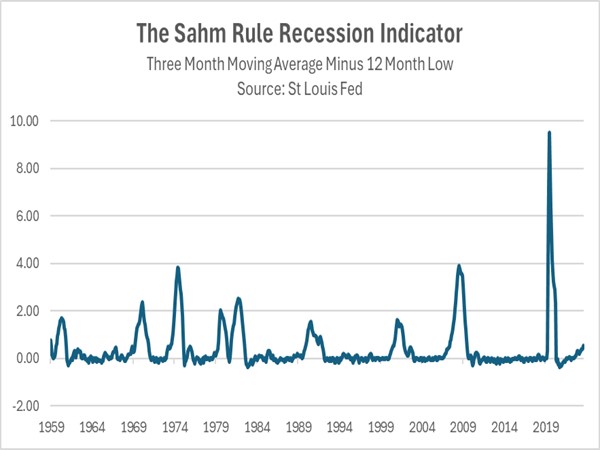
The Sahm Rule is a coincident recession measure, but other data suggests that the economy remains firmly in expansion as opposed to contraction. For example, the unemployment rate currently stands at 4.3%, below the noncyclical rate of 4.4%, and therefore still indicates full employment. Moreover, the latest report on gross domestic product showed that growth accelerated from an annualized rate of 1.4% in the first quarter to 2.8% in the second quarter. That contradicts the technical definition of a recession, which requires two consecutive quarters of economic contraction.
Doubts about the Sahm Rule’s veracity become more apparent when looking at the underlying drivers of the recent increase in joblessness. The reported increase was fueled in part by a dramatic surge in the number of people entering the civilian labor force — workers and those seeking employment. Notably, the number of new and re-entering workers has expanded by nearly 17% from a year ago, a sharp reversal from the pre-pandemic downtrend. Immigrants filling job vacancies were a strong driver of this growth, although women and retirees also contributed significantly to the increased labor force participation.
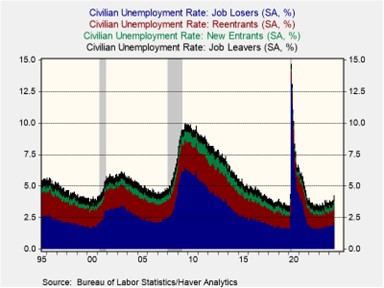
All the same, there are worrying signs within the labor market data. Job creation has decelerated sharply since the year began, with no net new hires in July compared to the previous year. Concurrently, job openings have been declining since 2022, and initial jobless claims are on an uptrend. Furthermore, while the share of job losers remains near historical averages, it has recently shown signs of increasing.
The Sahm Rule’s activation is a notable indicator of a cooling labor market. However, declaring a recession based solely on this metric would be premature, given overall employment levels and other indicators showing many economic sectors are still growing. Nevertheless, recent data may prompt the Fed to ease monetary policy more aggressively to prevent a hard landing. Consequently, an interest rate cut in September of 50 basis points now looks possible, with subsequent easing contingent on incoming data.
Note: There will not be an accompanying podcast for this report.
Asset Allocation Bi-Weekly – #123 “The Price of Central Bank Independence” (Posted 7/29/24)
Asset Allocation Bi-Weekly – The Price of Central Bank Independence (July 29, 2024)
by the Asset Allocation Committee | PDF
Despite the formal separation of the Federal Reserve and Treasury Department in 1951, the two bodies continued to collaborate closely on economic policy for nearly two decades. The coordination aimed to improve the effectiveness of initiatives like stimulating economic growth or preventing the overheating of the economy. While this balancing act worked well under Bretton Woods, the system’s collapse in the 1970s strained the relationship between the two institutions.
The end of the gold-dollar exchange system in the early 1970s left the United States struggling to maintain confidence in its currency. Foreign leaders, like Charles de Gaulle of France, had previously been critical of America’s inability to control spending and argued that it devalued the dollar held by other countries. This anxiety surrounding the dollar likely played a role in Saudi Arabia’s decision to hike oil prices and impose an oil embargo on the US in response to its involvement in the Arab-Israeli War. This move significantly contributed to a surge in US inflation.
To address this, President Jimmy Carter delivered his now-famous “malaise” speech and requested resignations from his White House staff and cabinet. As part of this reshuffle, he appointed Paul Volcker as Fed Chair. This decision, though, cost him his presidency and established a precedent for the Fed to prioritize its monetary policy goals, even if they diverged from fiscal policy during economic expansions.
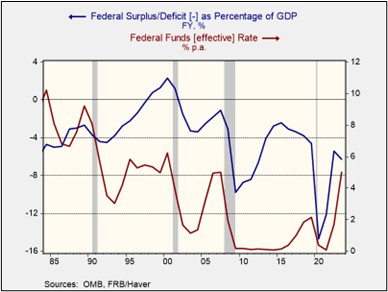
Investors tend to favor policies that nurture economic growth while also keeping inflation in check. This balancing act can be tricky, but the Federal Reserve’s approach exemplifies how it’s done. As the chart below shows, the Fed typically lowers interest rates during recessions to jumpstart the economy. Conversely, during economic booms, it usually tightens policy to slow borrowing and spending, keep the economy from overheating, and prevent inflation. This strategy resonates with investors because it ensures that they’re compensated for potential inflation and the risks associated with rising government debt.
However, what benefits financial markets doesn’t always translate to political popularity. Lawmakers, especially populists, have clashed with the Fed when its actions run counter to their agendas. Former President Donald Trump frequently lambasted the Fed for raising rates while he was working to stimulate economic growth through lower tax rates. Meanwhile, Massachusetts Senator Elizabeth Warren has accused the central bank of raising interest rates to the detriment of its inflation target, suggesting that its hiking cycle contributed to rising shelter and insurance prices.
Rising debt has further strained the relationship between the central bank and lawmakers. The gross federal debt as a percentage of GDP rose from 100.5% in 2019 to 126.4% in 2020. While some progress has been made in reducing the debt, Fed officials have warned that the government should do more to rein in its spending to prevent a rising debt problem. The Congressional Budget Office projects that weaker economic growth and higher interest rates could push the debt to 140% of GDP by 2034.
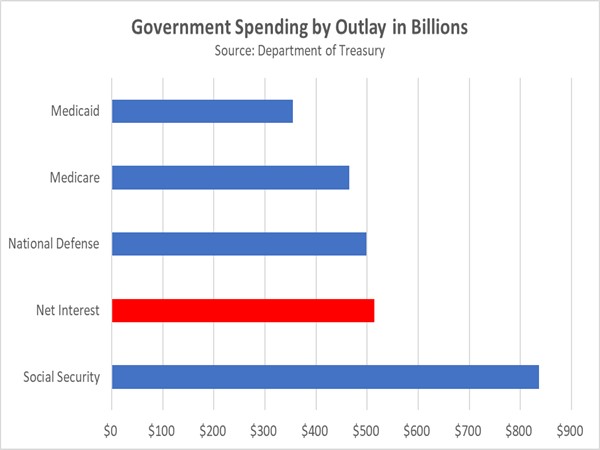
The government’s recent shift toward issuing more short-term bills exposes it to greater interest rate fluctuations, further complicating the Fed’s ability to shield itself from scrutiny. According to one estimate, the government issued 70% of its Treasury debt in bills this year. This means future rate hikes by the Fed could significantly increase the government’s borrowing costs. Highlighting the urgency of the issue, the cost of servicing the debt (net interest) has surpassed military spending in the first seven months of fiscal year 2024, as shown in the chart below.
The rising tensions between the Fed and the government have likely fueled concerns about the effectiveness of their independent roles, prompting some to question whether the Fed and the government should return to their pre-Volcker relationship. Some lawmakers have pushed for the executive branch to have more say in future monetary policy. The new framework would require central bankers to consult with the president on interest rate decisions and grant him the authority to dismiss the central bank head if he disapproves.
A weakened central bank could lose its ability to act as a critical check on excessive government spending. This scenario raises concerns for bondholders, who could face the brunt of rising inflation if fiscal spending spirals out of control. Further compounding the uncertainty, foreign entities may be hesitant to hold US dollars due to a perceived lack of clear policy direction. This could lead them to diversify their reserves, seeking assets like gold that might offer a more stable store of value.
Despite no direct challenges to Fed independence from the current presidential candidates, anxieties linger about potential meddling. This could dampen investor enthusiasm for US financial assets and exacerbate market volatility as the election nears. However, a silver lining exists for some. International companies and US companies with foreign currency exposure could benefit from a potentially weaker dollar, translating to higher returns.
Asset Allocation Bi-Weekly – #121 “Small Caps and the Hope for a Soft Landing” (Posted 6/24/24)
Asset Allocation Bi-Weekly – Small Caps and the Hope for a Soft Landing (June 24, 2024)
by the Asset Allocation Committee | PDF
They don’t call him Maestro for nothing. In the mid-1990s, Federal Reserve Chair Alan Greenspan achieved what was once thought of as impossible: an economic soft landing. As the US labor market showed signs of tightening, he raised interest rates from 3% to 6% in 1994 to preemptively combat inflation. In 1995, he lowered rates strategically to avoid a recession. The seamless transition from a tightening cycle to an easing cycle led some to believe the Fed could pull the strings in the economy in a way that could both prevent a recession and tame runaway inflation.
The market took notice. Greenspan’s policies helped quell investor anxieties about a repeat of the inflationary surges that plagued the 1970s and early 1980s. Emboldened by this newfound confidence, investors poured money into smaller, unproven companies with strong earnings growth potential. This sentiment was epitomized in 1995, when tech guru Marc Andreessen and his partner Jim Clark did the unthinkable by taking their company, Netscape, public before it had turned a profit, paving the way for what is now viewed as the dot-com bubble.
Today’s elevated interest rate environment has sparked nostalgia for another soft landing. Eager for a repeat of Greenspan’s success, investors were waiting for a decline in rates to re-enter the market. However, their hopes were dashed in June 2023. Not only did Fed policymakers raise rates following the collapse of Silicon Valley Bank, but they also signaled their intention for two additional hikes that year. This spooked markets as investors were concerned that the central bank may keep rates high for long enough to tank the economy.
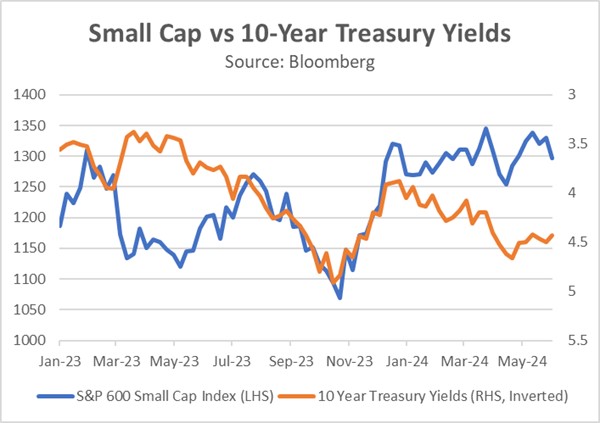
This commitment to raising interest rates discouraged investors from holding riskier assets, particularly those with floating rate exposure. Further pressuring the market were concerns about the rising national debt, which prompted Fitch to downgrade the US credit rating. Investors responded by offloading riskier assets within their portfolios. As a result, the 10-year Treasury yield soared to approximately 5%, a level not seen in over two decades, while the S&P SmallCap 600 Index plummeted to a nine-month low.
The tide began to turn in late October of last year. The US Treasury’s reallocation of bond issuance toward shorter maturities, coupled with Fed officials signaling an indefinite pause in rate hikes, significantly impacted market sentiment. Investors piled into longer-term bonds and risk assets in anticipation of the Fed’s next move, positioning themselves for an imminent rate cut, which they thought could take place in the first quarter of 2024. From October to December, the S&P SmallCap 600 Index outperformed the S&P 500, with a return of 21.5% compared to 13.7%, respectively.
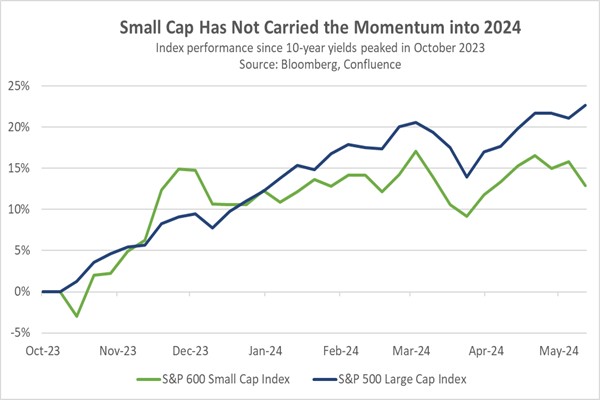
Unfortunately, the early strength of small caps faded quickly as the S&P 500 recaptured its leadership position at the beginning of 2024. This new weakness in small caps stemmed from concerns that the Fed wouldn’t cut interest rates as deeply as the market anticipated, following a series of strong Consumer Price Index reports in the first quarter and a persistently tight labor market. This situation led investors to reduce their holdings of longer-term Treasurys and refocus on large cap companies due to their relatively strong earnings potential and resilience to changes in financial conditions.
In fact, recognizing this trend early on prompted us to take action in the second quarter. We strategically reduced our exposure to small cap stocks within the conservative portfolios of our Asset Allocation program. This decision also reflected our growing concern that small cap stocks may face longer-term challenges due to certain structural market factors, including the rising popularity of passive funds that funnel money into large cap stocks and the increasing ability of private equity firms to acquire the most promising small cap startups. Hence, an emphasis on quality while screening for indicators such as profitability, leverage, and cash flow should mitigate some of these factors.
Currently, the S&P SmallCap 600 Index has been in a holding pattern as investors await signals regarding the Fed’s next policy move. Should Chair Powell manage to orchestrate another soft landing in the coming months, it could attract investors back to small cap stocks. With the current multiples for the S&P 500 outpacing those of the S&P SmallCap 600 by the widest margin since the dot-com era, small cap stocks present appealing valuations compared to their larger counterparts. With that in mind, we think small cap stock values could rebound in the coming months if US economic growth remains healthy and both inflation and interest rates fall.
Asset Allocation Bi-Weekly – #120 “Copper, Gold, Treasurys, and the New World” (Posted 6/10/24)
Asset Allocation Bi-Weekly – Copper, Gold, Treasurys, and the New World (June 10, 2024)
by the Asset Allocation Committee | PDF
Early 2023 served as a stark reminder that correlations can break down when least expected. Last year, a decline in the copper/gold ratio led many investors to anticipate a fall in longer-term yields, particularly for the 10-year Treasury note. However, these expectations were shattered as yields not only increased but surged to multi-decade highs by October. This episode underscores the challenge of relying too heavily on old assumptions. In this report, we’ll delve into the dynamics between the copper/gold ratio and 10-year yields and explore whether this historical connection has been permanently severed.
The copper-to-gold ratio is a closely watched indicator of investor risk sentiment. This ratio compares the price of copper, an industrial metal heavily used in construction and manufacturing, to the price of gold, a traditional safe-haven asset. A rising ratio generally signals investor optimism about economic growth. As economic activity picks up, demand for copper rises and pushes its price higher relative to gold. Conversely, a declining ratio suggests investor pessimism and a potential economic slowdown. This could be due to fears of recession or other economic troubles, leading investors to seek the perceived safety of gold.
As shown in the chart below, a rising copper-to-gold ratio has historically coincided with increasing long-term Treasury yields. This reflects investor expectations of accelerating economic growth, which can lead to inflation. To compensate for the potential erosion in bond values, investors demand higher yields on longer-term bonds. The relationship also works in the opposite direction. Investor fears of geopolitical risks or recession trigger a decline in both the copper/gold ratio and bond yields as investors seek safety in gold and US government bonds.
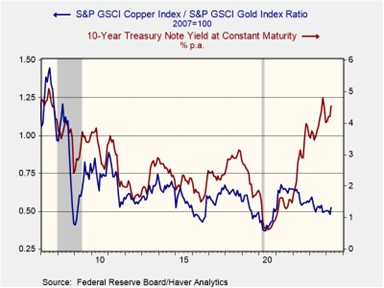
The once strong correlation between the copper/gold ratio and interest rates seems to be unraveling in the post-pandemic recovery. While the ratio initially surged with the global reopening, China’s economic slowdown has caused it to fall over the last couple of years. In contrast, the 10-year Treasury yield has climbed as stubbornly high inflation has prompted central banks to tighten monetary policy, leading to further interest rate increases. This disconnect between the traditional indicators suggests a potential shift in market dynamics.
Prior to the pandemic, investors largely operated under the assumption of a stable, low-inflation world. This fostered an environment where long-term investments were attractive, and there was minimal fear that duration risk would erode their value. Consequently, investors primarily focused on the long end of the yield curve only during periods of economic concern or during major events that might prompt the Fed to cut rates and stimulate growth. This preference for bonds during economic downturns mirrored that of gold — a safe-haven asset. As a result, both bond yields and the copper-to-gold ratio had previously moved counter-cyclically.
However, these market relationships started to change as government efforts to prevent a recession through the creation of massive deficits led to higher long-term interest rates. The issuance of new Treasurys pushed up interest rates as the market struggled to absorb the new bonds. A further contributing factor to this dynamic is the Federal Reserve’s hawkish monetary policy. The Fed’s tapering of its bond holdings has reduced a key source of demand. Additionally, recent interest rate hikes have discouraged investors from holding long-term bonds as short-term bonds offer more attractive yields.
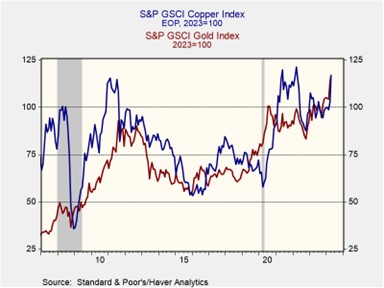
The metals market has also seen a transformation. So far this year, China’s modest industrial rebound has lifted copper prices from their 2023 lows, while the collective central bank buying of gold, spearheaded by China, has sent bullion prices skyrocketing. This unusual gold surge has offset the rise in copper prices, which explains why the ratio has been relatively subdued this year. While this trend may seem fleeting, evidence suggests emerging economies are accumulating gold as a potential hedge against the US government’s frequent use of sanctions tied to the dollar. As a result, it is possible that the copper/gold ratio could continue to move in the opposite direction of 10-year Treasury yields.
The breakdown in the relationship between the copper/gold ratio and 10-year Treasury yields likely stems from a new global economic reality. Higher deficits and inflation expectations have driven up long-term yields, while China’s slowdown and central bank gold purchases have suppressed the copper/gold ratio. A return to the prior correlation could occur if investors become confident in a return of price stability and if the accumulation of gold by foreign central banks proves temporary. However, we are doubtful of a near-term return, given persistent labor shortages, inflation pressures, and rising geopolitical tensions, particularly between the US and China.