

Tag: bitcoin
Asset Allocation Bi-Weekly – The Dip That Didn’t Bounce (March 2, 2026)
by Thomas Wash | PDF
Retail investors have emerged as a crucial stabilizing force behind the ascent of the “Magnificent 7” in recent years. Rather than displacing institutional or ETF demand, their participation has added a new, resilient layer of support. This cohort’s propensity to buy and hold mega-cap tech stocks, even through periods of market anxiety, has helped sustain momentum and enthusiasm for these names, insulating them to some degree from the sharper sentiment swings affecting the broader market.
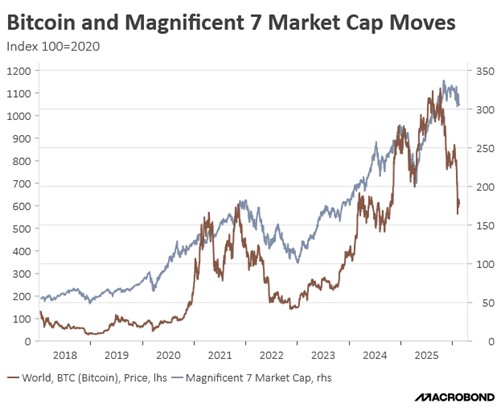
This distinct retail influence extends beyond equities, manifesting clearly in the behavior of Bitcoin. Estimates suggest that roughly two-thirds of Bitcoin’s supply remains in the hands of individual investors. Throughout 2024 and 2025, a notable correlation emerged, with Bitcoin and major tech and software names frequently moving in tandem. This parallel behavior reinforces the narrative that for many investors, particularly those with a higher risk appetite, mega-cap tech and crypto have effectively merged into a single, cohesive trade.
The sharp rise in Bitcoin and many tech-related stocks has coincided with a wave of new retail investors entering equity and crypto markets. This surge has been supported by pandemic-era stimulus payments, which boosted households’ risk-taking capacity, and by the rapid growth of easy-to-use, commission-free trading apps such as Robinhood, drawing many younger investors into markets for the first time. As a result of this new participation, the share of the daily trading volume of US equities attributable to individual investors went from the low single-digits pre-pandemic to nearly 20%.
This increased retail participation has pushed a larger share of market attention toward future growth potential and market themes, particularly in high‑growth technology and AI‑related names, rather than strictly traditional valuation metrics. Many retail investors have piled into rising tech stars, such as Nvidia, and into cryptocurrencies at the same time, often under the belief that prices would keep climbing, helping to cement a “buy‑the‑dip” mentality in which market pullbacks were frequently met with renewed retail buying.
This newer approach to investing has provided meaningful support to markets during periods of stress as it has been a source of incremental demand. Most notably, after President Trump’s “Liberation Day” tariff announcement sparked a sharp sell‑off, a strong wave of retail dip‑buying helped stabilize prices and fuel a powerful rebound. Also, brokerage and bank data indicate that retail investors’ returns around this episode and over 2025, as a whole, compared very favorably with many institutional strategies.
A major driver of this renewed wave of retail buying is the influx of younger investors into the market. Many of them have lived through a recession but have not experienced a deep, protracted equity downturn driven by widespread corporate failures. The only meaningful market pullback they recall is the 2022 episode, during which many of the hardest hit names later rebounded and went on to post extraordinary gains. As a result, many of these younger investors have held out hope that the equity market can help them accelerate their savings.
That said, retail investors — particularly younger cohorts — may prove to be a less reliable source of support for the market going forward. Using Bitcoin as a reference point, there are signs that individual traders have now become more risk‑averse, and this shift is starting to weigh on broader sentiment. This helps explain why the tech sector has seen limited upside so far this year, as investors continue to grapple with the true profitability of AI‑focused firms in light of their rising debt burdens and the threat they pose of triggering a broader “SaaS-pocalypse.”
While retail investors are likely to play a bigger role in markets over time, current uncertainty may prevent them from acting as buyers of last resort during future periods of stress. This growing risk aversion is especially likely to weigh on familiar large cap names in the technology sector. In our view, clients should pay closer attention to overlooked areas of the market as persistent pessimism toward mega‑cap tech could eventually drive a broader sector rotation as investors look to diversify into other industries.
The accompanying podcast for this report will be available later this week.
Asset Allocation Bi-Weekly – Stablecoin: Treasury’s Next Big Bet? (July 21, 2025)
by Thomas Wash | PDF
Mounting national debt and tightening financing conditions are pushing the US Treasury to rethink traditional funding strategies, and stablecoins have emerged as an unexpected contender.
Minutes from April’s Treasury Quarterly Refunding meeting reveal that officials are actively evaluating the use of stablecoins for buying US debt. This signals a strategic shift in government financing, blending innovation with necessity as the US recalibrates its fiscal approach in a changing global landscape.
Why Stablecoins?
Stablecoins are a type of cryptocurrency designed to maintain a stable value, typically by being pegged 1:1 to the US dollar, although any currency, in theory, could be used. Under the proposed GENIUS Act (recently passed by the House), the issued stablecoin must be supported by reserves that often include highly liquid assets like Treasury bills, insured bank deposits, and repurchase agreements (repos). Commercial paper has been used previously as a reserve, but if the legislation passes, then the reserve asset for stablecoins will be restricted.
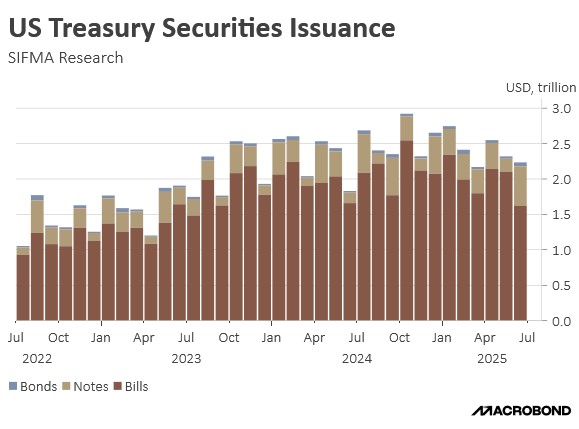
Widespread adoption of stablecoins could spur new demand for short-duration bonds, aligning with the Treasury’s recent pivot toward issuing shorter-term debt to fund spending. Currently, an estimated 80% of the stablecoin market, which represents about $200 billion, is invested in either Treasury bills or repos. Projections indicate this market could expand to $2 trillion by 2028 if legislation is enacted that creates a regulatory framework.
How Stablecoins Work
A stablecoin comes into being when a user exchanges another asset, such as fiat currency or a different cryptocurrency, with an issuer. Once the issuer receives this asset, they mint an equivalent amount of stablecoin and deposit it into the user’s account. These transactions are recorded on a distributed ledger (commonly known as a blockchain), which involves a network of participants.
The attractiveness of stablecoins lies in their use as a store of value. Their backing by real-world assets, such as fiat currency or other liquid instruments, allows the stablecoins to trade freely as a digital currency. This stability is maintained by the ability to convert the stablecoin back into its underlying reserve asset (e.g., US Treasurys) upon demand. In this way, stablecoins function similarly to money market funds with one important exception. Under current legislation, stablecoins cannot provide a yield to their holders. Doing so would make stablecoins a security.
Why Are Stablecoins Important?
Establishing a clear and enforceable regulatory framework is crucial for stablecoins to unlock their full potential as a reliable medium of exchange. As more individuals and businesses integrate stablecoins into their payment processes, a corresponding surge in demand for their underlying reserve assets, particularly US Treasury bills, is anticipated.
A core premise driving stablecoin adoption is their ability to offer individuals and entities worldwide exposure to the US dollar without requiring direct engagement with the traditional US banking system. This characteristic uniquely positions stablecoins as a potential alternative for efficient and cost-effective cross-border payments. By facilitating such transactions, stablecoins could further reinforce the US dollar’s dominant role in international trade and finance.
Market Ramifications
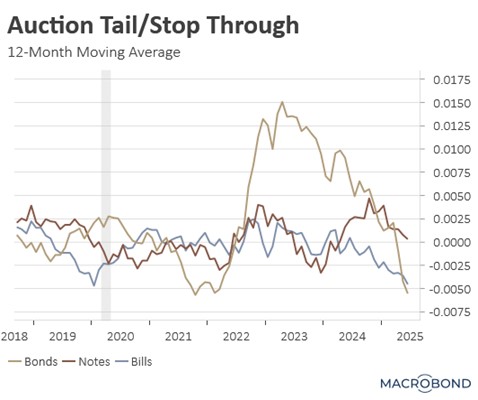
The increased use of stablecoins could facilitate the Treasury’s reallocation of funding away from long-term bonds in favor of shorter-duration instruments. This shift would not only improve Treasury auction performance but should also help exert downward pressure on long-term interest rates, thereby reducing overall borrowing costs across the economy.
The primary downside, however, is the possibility that stablecoins could attract capital that would typically flow into the traditional banking system, specifically money market funds, which have historically been a lynchpin of the financial system. Although, the inability of stablecoins to pay interest may reduce disintermediation. At the same time, the advent of stablecoins could force banks and money market funds to increase their yields. A significant concern we will monitor is the potential for stablecoin runs, given that some stablecoins have “broken the buck” during periods of uncertainty in recent years. This highlights the risk of instability if not properly managed.
Don’t miss our accompanying podcasts, available on our website and most podcast platforms: Apple | Spotify
Asset Allocation Bi-Weekly – #144 “Stablecoin: Treasury’s Next Big Bet?” (Posted 7/21/25)
Asset Allocation Weekly – #56 “Has Bitcoin Become a Substitute for Gold?” (Posted 10/8/21)
Asset Allocation Weekly (December 18, 2020)
by Asset Allocation Committee | PDF
(N.B. Due to the upcoming holiday season, this report will be the last Asset Allocation Weekly for 2020. The next report will be published on January 8, 2021.)
While 2020 was a year in which the word “unprecedented” has been used a lot, there are many areas where the term is appropriate. One area of interest is in the growth of liquidity. The chart below is one we have featured often, showing retail money market fund levels (RMMK) and the S&P 500.
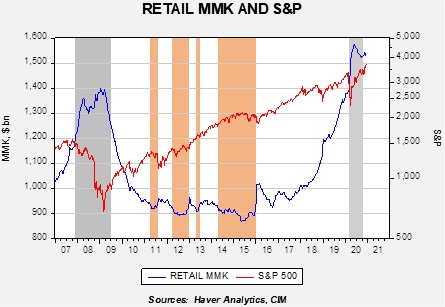
The gray bars show recessions, while the orange bars show periods where RMMK fell below $920 billion. Our position has been that when we are in the orange parts of the chart, there is a dearth of liquidity and equity markets tend to stall. On the other hand, periods of rapid RMMK accumulation have tended to be periods of equity weakness.
In 2018, as the trade war escalated, RMMK began to rise sharply. It continued to rise throughout 2019 into 2020. The pandemic led to another leg higher in RMMK. The level of RMMK has fallen from the highs set earlier in the year but it remains elevated. As noted above, when RMMK rises sharply, equities tend to suffer. We did see some evidence of that in 2018, but last year equities continued to trend higher despite the rise in RMMK. Pandemic worries and a brewing financial crisis led to a sharp selloff in the S&P 500, but the market turned as policymakers moved quickly to support the economy.
It is clear that the level of RMMK is high, but the difficulty is determining “how high.” For that, analysts usually try to scale the data to make it comparable across periods. A logical scale variable may be in comparing the level of RMMK to household financial assets. The problem with that variable is that it is very sensitive to the level of equities; in other works, cash levels seem to rise coincident with a fall in equity values. Most of the decline occurs due to the fall in equity values, not to cash accumulation. The other problem with scaling is finding the answer to the question at hand. What we want to know is if RMMK levels fall, will the funds go to stocks or elsewhere? We assume that RMMK is the closest asset to equities of fixed income; in other words, demand or savings deposits probably represent the desire to hold cash, whereas RMMK is where liquidated financial assets go before they are placed elsewhere.
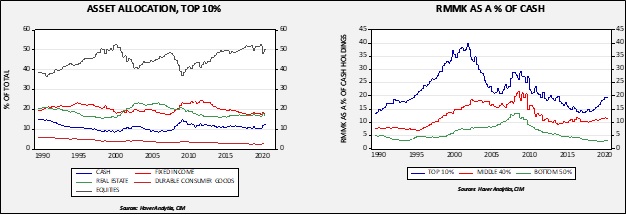
The chart on the left shows the asset allocation of the top 10% of households. Note that about 50% of this income group’s assets are in equities. That is far larger than the middle income group (89% to 51%), which holds 25% in equities, and the bottom 50%, which has equity holdings of 10%. The chart on the right shows that the RMMK holdings for the top 10% group rose from 15% to near 20% from 2018 to 2020, coinciding with the rise in RMMK shown in the first chart.
These charts suggest that most of the RMMK accumulation occurred in an income group most inclined to buy equities. Accordingly, the elevated level of RMMK should be supportive for equities. At the same time, in 2008, RMMK held by the top 10% reached nearly 30%. Thus, we may not see as large of a recovery as we saw during 2009-11. Still, there does appear to be ample liquidity available for stocks, and given the low level of interest rates, flows should continue to be supportive for equities.
Asset Allocation Weekly – #21 (Posted 12/11/20)
Asset Allocation Weekly (December 11, 2020)
by Asset Allocation Committee | PDF
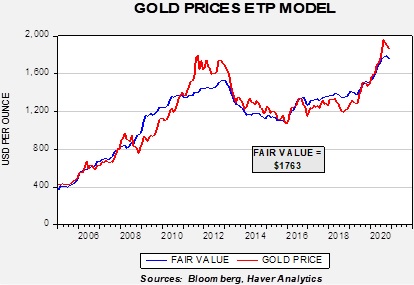
After peaking at $2,063 in early August, gold prices fell to $1,760 at the end of November. This is a notable decline and, because our asset allocation models have included precious metals since 2018, it makes sense to see if anything has changed. We have several different ways to examine the price of gold. In general, the outlook is mixed; the underlying fundamentals remain solid, but competition for investment flows is putting a damper on gold prices.
Based on our gold model, prices are attractive at current levels. The model uses real two-year Treasury yields, the EUR/USD exchange rate, the balance sheets of the Federal Reserve and the European Central Bank, and the U.S. fiscal account scaled to GDP. As the chart suggests, current prices are below the model’s forecast.

At the same time, a model based on the amount of gold held by exchange-traded products (ETPs) suggests gold isn’t attracting investment flows relative to its fundamental attractiveness.
Although optimism surrounding equities is likely diverting funds that may have gone into gold, the price action in bitcoin may also be having an impact. Bitcoin remains a controversial topic; its value appears to be ephemeral (in theory, one can create scarcity of anything, but it has little value without demand for it). Its initial construction suggested it was a digital currency designed for transactions. It has mostly failed in that endeavor, at least for legal transactions, but it has shown to have store-of-value characteristics. As such, it has similar characteristics to gold without the same issues of storage.[1] Recently, we have seen a sharp rise in bitcoin prices, which may be siphoning off demand that would usually go to gold.
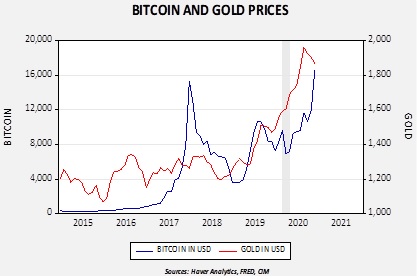
Since late 2014, gold and bitcoin prices are positively correlated at the 70.9% level. In 2017, we saw a spike in bitcoin that collapsed. The key question is whether we are seeing a repeat in the current situation or something different. It is difficult to tell, but the most likely situation is that bitcoin isn’t replacing gold but is a complement. Currently, bitcoin appears a bit expensive compared to gold (a simple model suggests bitcoin should be closer to 12,000), but it had been running below gold for most of this year. Thus, we view the recent rally as more corrective in nature, although the recent spike suggests bitcoin is now excessively valued. Another item of note is that when we had a financial crisis in February into late March, bitcoin plunged while gold maintained its value. The financial system was in a perilous position in late Q1 and bitcoin was not the safety asset of choice when there were high levels of fear. At the same time, we cannot discount the attractiveness of bitcoin and, if investable products are eventually created, it may have a place in portfolios.
Overall, we remain bullish on gold. The underlying fundamentals, as shown in our base model, are very attractive and suggest current prices are undervalued. We do think bitcoin has taken some of the luster from gold, but in the long run we believe the two assets are complementary. With monetary and fiscal policy remaining expansive, the case for commodities, in general, and gold, in particular, is favorable.
[1] Both assets require storage, but one is quite physical whereas the other has, in theory, unlimited storage capacity. For example, if one is trying to live in a failing state, gold may have little value due to its weight but a cryptocurrency that can be easily transferred is attractive.