Weekly Geopolitical Report – Post-Brexit (July 11, 2016)

by Bill O’Grady

On June 23rd, voters in the U.K. shocked global markets by voting to leave the EU.  In this report, we will examine the various paths the country may take in the coming months with regard to this issue, discuss the political lessons learned and the impact Brexit will have on other European nations.  As always, we will conclude with the potential impact on markets.

Brexit—Now What?
In the aftermath of the Brexit vote, PM Cameron announced he would be stepping down in September and the ruling Conservatives will select a new prime minister.  Over the past week, the Tories, who are members of Parliament (MPs), voted on potential replacements for Cameron.  The party started with five candidates and, through party voting and resignations, that group has narrowed to Home Secretary Theresa May.  Energy Minister Andrea Leadsom pulled out of the race today.  May is a member of the “remain” camp but has indicated that she will respect the will of the people expressed in the referendum vote.  Leadsom supported the “leave” campaign.  Thus, her exit from the campaign does have an impact on whether or not Brexit actually occurs.  It is unclear at this point, even though May is the only remaining candidate, whether the party will hold a membership vote in September to formally select her as the new prime minister.

View the full report

Asset Allocation Weekly (July 8, 2016)

by Asset Allocation Committee

One of the great characteristics about working in financial services is that there are always surprises.  Recently, we came across a situation in the S&P earnings data that we had not noticed before.  It is well known that earnings have two variations—as reported and operating.  As reported earnings include all costs.  Thus, the cost of shutting down a factory or an adverse legal judgement reduces earnings.  However, it could be argued that these costs are nonrecurring and don’t accurately reflect the costs of the ongoing business.  Operating earnings exclude nonrecurring expenses.

What surprised us is that there are at least two sources for operating earnings, Standard and Poor’s and Thomson-Reuters.  At times, the two series diverge.

This chart shows the two operating earnings series along with the ratio of the two numbers on the bottom of the chart.  About 28% of the time, the ratio is 1.05 or greater, indicating that the Thomson-Reuters operating earnings numbers are about 5% higher than the S&P operating earnings report.

There are two issues to examine.  First, it is apparent that the Thomson-Reuters numbers are usually higher than the S&P data; there are only 22 out of 90 quarters where the S&P number was higher and the average spread was only 50 cents per share.  According to analyst reports, Thomson-Reuters “fits” its series to more closely match analyst estimates (which its I/B/E/S division gathers).  Although neither series purports to be GAAP, most likely, the Thomson-Reuters series is less adherent than S&P.  Thus, any P/E calculated off the Thompson-Reuters data will tend to be understated.  The second issue, and perhaps the more important one, is the signal being sent by the divergence of the two series.  On the above chart, we have included vertical gray bars indicating recessions; note that when the two series diverge by 10% (1.10 on the above chart), the economy is in recession.  Thus, the current divergence is a concern.  There are several other business cycle indicators that suggest the economy is not in a downturn, but this indicator is clearly flashing a warning sign.

Which is the more accurate number?  Frankly, like so many other situations in life, it depends.  At this part of the business cycle, the S&P number is probably more informative.  In previous cycles, S&P’s weaker earnings were an indicator of an impending change in the business cycle.  That’s why the current divergence is a warning sign.  On the other hand, the Thomson-Reuters numbers are a more accurate representation of operating earnings during the recovery from recession.  Note on the above chart that the S&P earnings numbers tend to “catch up” with the Thomson-Reuters numbers as the recovery begins.

The P/E chart included at the end of our Daily Comment, which we update weekly, uses the S&P operating earnings data for historical earnings data.  The expectations data comes from I/B/E/S, so it comes ultimately from Thomson-Reuters.  This means our P/E may be somewhat understated, although not nearly as much as a pure forward-looking number would suggest using the Thomson-Reuters data.  Given where we are in the business cycle, the S&P numbers are probably a better reflection of operating earnings, meaning the forward P/E may be offering investors false comfort.

View the PDF

Asset Allocation Weekly (July 1, 2016)

by Asset Allocation Committee

The Brexit situation is dominating the financial news, and rightly so—such events are unusual and their outcomes are usually uncertain.  As part of our asset allocation process, we examine these types of issues and adjust our portfolios to account for them.

Although our process is cyclical, meaning we pay particular attention to the business cycle and its effect on markets and asset classes, there are factors that affect markets that go well beyond the business cycle.  Examples of such factors are demographics, inflation and growth policies, political coalitions, superpower dynamics, etc.  These influences have been background factors for the past several business cycles; when these background factors change, it can cause unexpected outcomes to financial markets that appear to be reactions beyond normal.  For example, the 2008 Financial Crisis was much worse than generally expected because the expansion of household debt, which had underpinned economic growth for nearly three decades and allowed the implementation of low inflation policies to coexist with acceptable economic growth, suddenly reached a point of unsustainability.  This was one of the primary reasons why what started out as a normal recession evolved into a massive contraction.  Household deleveraging continues to weigh on economic growth and, until the issue is addressed, will likely remain a damper on growth.

Brexit is part of another longer term political trend we have been discussing for several years.  We have been concerned that the U.S. is steadily relinquishing its superpower role.  The superpower provides key global public goods, mainly global security and the reserve currency.  The former requires a large military and heavy defense spending, while the latter means the nation is the global importer of last resort and must continually provide its currency to the world through trade deficits.  No superpower reigns indefinitely but history has shown that periods between superpowers tend to be difficult.  The lack of global leadership brings a surge of nationalism, leading to wars and economic dislocation.

The Brexit vote was an emotional appeal to British nationalism.  It could very well bring a resurgence of Scottish nationalism and may lead to the end of the United Kingdom.  Similar movements in other parts of Europe are based on nationalism as well.  In part, the campaigns of Donald Trump and Bernie Sanders are a rejection of the establishment project of globalization and deregulation.  After all, Trump’s campaign slogans of “Make America Great Again” and “America First” are appeals to nationalism.

What does this mean for asset allocation?  The twin policies of globalization and deregulation have been key background factors that have supported financial markets.  After the Berlin Wall fell, this policy pair was dubbed “the Washington Consensus,” which became the blueprint for how the world economy should work.  That policy consensus appears to be breaking down mostly because it requires a global hegemon to enforce the consensus.  The ill-advised Middle East wars and the unsustainable weaknesses of the Washington Consensus (which required excessive debt to compensate for the lack of income growth) have now called into question the entire policy project.  If the Washington Consensus fails and nations retreat into nationalism, inflation and global unrest will almost certainly follow.  Rising inflation would favor stocks and cash over bonds.  In addition, virtually everything we know about foreign investing has occurred with the U.S. playing the hegemon role.  If the U.S. no longer fully provides the public goods that come with being the superpower, foreign investing faces a new and difficult future with greater uncertainty.  Much of our asset allocation process is determining the interplay of shorter term and longer term factors.  The Brexit situation is another factor in that process.

View the PDF

Weekly Geopolitical Report – The 2016 Mid-Year Geopolitical Outlook (June 27, 2016)

by Bill O’Grady

As is our custom, we update our geopolitical outlook for the remainder of the year as the first half comes to a close.  This report is less a series of predictions as it is a list of potential geopolitical issues that we believe will dominate the international landscape for the rest of the year.  It is not designed to be exhaustive; instead, it focuses on the “big picture” conditions that we believe will affect policy and markets going forward.  They are listed in order of importance.

Issue #1: The Rise of Populism

Issue #2: The U.S. Elections

Issue #3: The South China Sea

Issue #4: Lone Wolf Islamic Terrorism

Issue #5: The New Oil World

View the full report

Asset Allocation Weekly (June 24, 2016)

by Asset Allocation Committee

Last week, St. Louis FRB President Bullard issued a position paper that represents a significant departure from what has been standard policy at the Federal Reserve.  Our first hint that something had changed was noticed in the dots chart.  First, there were two dots that indicated no change in policy in 2017 and 2018.  Second, there were only 16 forecasts for the “longer run.”  The unexpectedly low dots, shown below in the oval, were initially thought to be attributed to the known dovish members of the committee, such as Governor Brainard or Chicago FRB President Evans.  However, as part of the aforementioned paper, St. Louis FRB President Bullard “outed” himself as the lower dots.

Bullard argues that instead of viewing the economy as having a long-term structural equilibrium, there are a series of medium- to long-term “regimes.”  These regimes, although not necessarily permanent, are persistent, and thus monetary policy should be shaped to the regime and not some theoretical equilibrium.  The other important point is that regimes themselves are not forecastable.  In other words, Bullard assumes a regime in place will stay in place until there is clear evidence of change.  The current regime is characterized by real GDP growth of about 2%, unemployment around the current level of 4.7% and inflation in the area of 2% (using the Dallas FRB trimmed mean CPI).  This implies that productivity will likely remain low and, due primarily to abnormally large liquidity premiums on safe assets, fixed income returns will be low, as will interest rates.  He also assumes no recession on the horizon.

What does this mean?  Assuming the current regime stays in place, Bullard believes that the proper fed funds rate is 63 bps, suggesting a target range of 50-75 bps for fed funds, or a single rate hike for the next two years.  By design, if policymakers adopt the Bullard model, monetary policy will no longer be anticipatory, but will be adaptive to condition changes with a lag.  This is probably a more honest approach to policy but one we suspect will be rejected by the other 16 members of the FOMC or any future governors (there are two unfilled seats on the FOMC).  Why?  Because adopting this policy will undermine the “oracle” image that the Fed tries to project.  In other words, there will be no more “maestros,” the moniker given to Chairman Greenspan.

The problem with Bullard’s policy model will be at the point of regime change—when regimes change, the Fed will be playing catch up to the new regime which will probably require aggressive moves.  Understanding the new regime during its transition will take time.  On the other hand, Bullard’s program will end much of the speculation on policy; note that Bullard’s dots mostly follow the Eurodollar futures market.  In effect, the financial markets will likely set rates (which they really do anyway).

We would expect heated debates on Bullard’s position.  First, it undermines the whole Taylor Rule/Phillips Curve model narrative.  This model is one of the important tools the FOMC uses in setting policy.  Bullard’s notion of regimes could allow for the Taylor Rule to be used but would likely argue that its parameters would change based upon regime conditions.  Second, by design, when regimes change, major adjustments in interest rates are likely.  The Fed seems to want to avoid major moves, although this is probably impossible in practice.  Third, losing the oracle image carries risks in that there would be constant speculation on whether or not the current regime is in danger of ending.  If markets become convinced that the parameters of policy are fluid, it would add another layer of uncertainty.  For a FOMC that prizes transparency, this move would be difficult.  Finally, the dots chart becomes irrelevant because it can only be trusted as long as the current regime is maintained.  We will be watching carefully to see how much support Bullard receives for his position.  We suspect he will be mostly alone.  However, if Bullard’s position gains traction, the fixation on the Fed should wane over time which is probably a healthy long-term development.

View the PDF

Weekly Geopolitical Report – The Real Risk of Brexit (June 20, 2016)

by Bill O’Grady

In February, we presented an analysis of Brexit, which is shorthand for Britain’s potential departure from the European Union (EU).  The referendum is slated for June 23.[1]  In general, the points discussed in the aforementioned report on the economy, trade, regulatory policy, immigration and the U.K.’s geopolitical “footprint” all still hold.  There are potential risks to the U.K. political system and economy from leaving the EU.  However, there is also, in my opinion, an underappreciated risk to the EU as well.

The problem can be summed up in this question—what if the U.K. leaves the EU and prospers?  This has the potential to be a major problem for the postwar European political environment.  In this report, we will discuss the role of the EU in shaping the postwar geopolitical environment in Europe and the multiple threats Britain’s exit presents for the EU.  As always, we will conclude with the impact on financial and commodity markets.

View the full report

__________________________

[1] See WGR, 2/29/2016, Brexit.

Asset Allocation Weekly (June 17, 2016)

by Asset Allocation Committee

Our asset allocation process has generally favored longer duration fixed income instruments.  We have expected inflation to remain low due to continued globalization and deregulation.  Over time, low inflation brings low long-term interest rates.  In recent weeks, domestic long-term interest rates have declined significantly.  Although this isn’t a huge surprise to us, the factors behind the decline are worth examining.

Currently, the biggest factor affecting U.S. interest rates is probably the drop in international yields.

This chart shows U.S. and German 10-year sovereign yields since 1990.  The current spread is very wide; German yields have recently dipped below zero.  Why are German yields declining?  In part, low Eurozone inflation is to blame.  Despite aggressively accommodative monetary policy from the ECB, inflation remains very low.  Second, the ECB is conducting quantitative easing (QE) and has extended its purchases to include corporate bonds.  Given that German bonds are the preferred choice for European investors seeking safety, the lack of available bonds for QE has pushed German yields to historically low levels.

However, it should be noted that other factors are not quite so bullish for U.S. Treasuries.

This chart shows our basic 10-year T-note yield model.  It uses fed funds, an inflation trend proxy, oil prices, the yen’s exchange rate and German sovereign yields.  The lift in fed funds and higher oil prices are factors that raise the fair value yield and so, the current fair value yield is a bit higher than the current yield.

This model suggests that the fixed income markets may be overestimating the impact of falling overseas interest rates.  That doesn’t necessarily mean that our fixed income strategy will change significantly.  At present, although the yield is somewhat overvalued, it isn’t so low as to signal an overvalued market.  The lower line on the graph, which shows the deviation between fair value and current yields, is just a bit below that level.  Based on current fundamentals, the 10-year T-note would become overvalued at a yield of 1.10%.  Thus, barring some significant change in the data, there is no reason to adjust our current allocation position.

View the PDF

Weekly Geopolitical Report – The Trade Facilitation and Trade Enforcement Act (June 13, 2016)

by Bill O’Grady

In February, President Obama signed the Trade Facilitation and Trade Enforcement Act, a broad refresh of U.S. trade laws.  Title VII of this law concerns exchange rate and economic policies.  The earlier law, passed in 1988, required the Treasury Department to determine if a nation was “manipulating” its exchange rate.  If a country was found to be doing so, the Treasury could engage in consultations to change the policies of the manipulator.  In practice, the Treasury found few nations in violation of the earlier law.  China was tagged with this designation five times from 1992 to 1995, Taiwan twice, in 1988 and 1992, and South Korea in 1988.  In reality, being designated a manipulator didn’t trigger significant penalties.

In this report, we will discuss the history of exchange rate issues in trade, the new legislation and its potential impact on U.S. trading partners.  We will review the reserve currency role and explain why this role almost precludes any effective trade policy designed to punish foreign trade practices.  We will reflect on the new law in light of the current political situation in the U.S. and, as always, conclude with the impact on financial and commodity markets.

View the full report

Asset Allocation Weekly (June 10, 2016)

by Asset Allocation Committee

In our asset allocation process, we focus on cyclical trends—trends that tend to have three- to five-year time horizons.  Two examples of these sorts of trends are the business cycle and the monetary policy cycle.  Although both cycles can last longer or less than three to five years, in general, these types of trends have an impact on market activity and distinguish our process from strategic models, which tend to focus on very long-term cycles.  We believe that ignoring the cyclical trends can lead to short- to medium-term losses that can be avoided by taking shorter term factors into account.

However, this does not mean that longer term cycles are not important.  We view these longer term cycles as the overall market environment.  These factors include the geopolitical environment (especially related to the U.S. superpower role), inflation policy (which tends to last decades), debt cycles (which also have a long life span), and secular economic growth cycles (which tend to be affected by productivity, technology, demographics and debt).  Although the inflection points in these long-term cycles tend to occur infrequently, perhaps once or twice in a lifetime, they have significant effects on short-term cycles when they do occur.

We continue to monitor the long-term economic growth cycle.

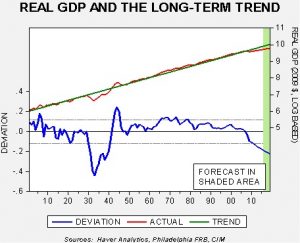
This chart shows GDP from 1901 and includes consensus forecasts for 2016 through 2019, using the Philadelphia FRB Survey of Professional Forecasters.  The key line is on the lower end of the chart showing the deviation from trend.  There are two periods that show a sharp negative deviation from trend, the Great Depression and the Great Recession.  In the Great Depression, the economy fell sharply but staged a strong recovery into the war years, with the exception of a pullback during the 1937 recession.  In the current downturn, the decline is much shallower, but, assuming the consensus forecast is correct, there is no strong recovery in the offing.  In other words, it is quite possible we have exchanged a deep, but shorter, economic decline for one that is shallower but interminable.

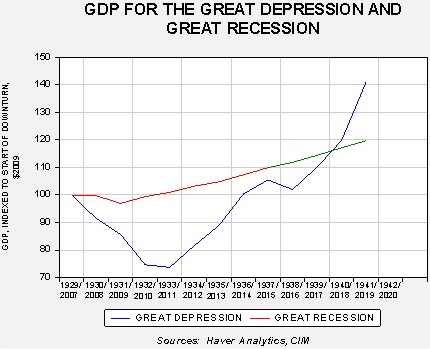
Here is another way of looking at the data.

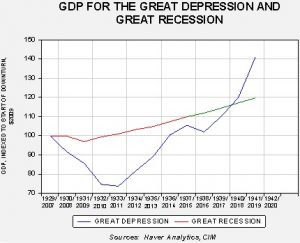
On this chart, we have indexed the level of real GDP beginning in 1929 and 2007.  In the Great Depression (shown as the blue line), GDP dropped by nearly 25% at the trough; in the Great Recession, the decline was a little over 3% (with the actual data shown in red, and the forecast in green).  However, the recovery from the Great Depression was quite strong, exceeding the previous peak by 1936 and, had the Roosevelt administration not derailed the improvement through an ill-advised fiscal tightening in 1937, the economy would have likely gathered even more momentum.  Meanwhile, if the Philadelphia FRB Survey of Professional Forecasters is accurate, by 2018, the recovery from the Great Depression will exceed the current cycle.  Of course, mobilization for WWII partly explains the expansion.  But, what it probably also shows is that if the current economy is ever going to recover to trend, it will likely take a large fiscal shock, such as a major war, to bring that about.

In the current environment, we don’t expect a major fiscal expansion to occur, although we note that given the populist tone of the current election cycle, deficit reduction doesn’t appear to be a major political factor.  Still, as the second chart shows, we are rapidly approaching the point where the current period of weak growth will extend past the period of the Great Depression.  In our asset allocation process, we have assumed that growth will remain lackluster, meaning that interest rates and inflation would stay low.  We continue to closely monitor the economic and political environment for evidence that subpar growth will be addressed by more radical measures.  But, thus far, there isn’t much evidence to suggest that significant change is in the offing.  Therefore, until we see signs of a change in the policy environment, we expect the current cyclical and secular trends to remain in place.

View the PDF