

Asset Allocation Weekly (July 8, 2016)
by Asset Allocation Committee
One of the great characteristics about working in financial services is that there are always surprises. Recently, we came across a situation in the S&P earnings data that we had not noticed before. It is well known that earnings have two variations—as reported and operating. As reported earnings include all costs. Thus, the cost of shutting down a factory or an adverse legal judgement reduces earnings. However, it could be argued that these costs are nonrecurring and don’t accurately reflect the costs of the ongoing business. Operating earnings exclude nonrecurring expenses.
What surprised us is that there are at least two sources for operating earnings, Standard and Poor’s and Thomson-Reuters. At times, the two series diverge.
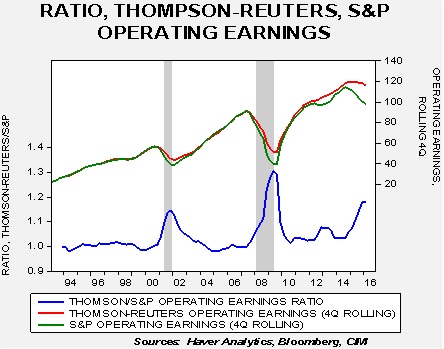
This chart shows the two operating earnings series along with the ratio of the two numbers on the bottom of the chart. About 28% of the time, the ratio is 1.05 or greater, indicating that the Thomson-Reuters operating earnings numbers are about 5% higher than the S&P operating earnings report.
There are two issues to examine. First, it is apparent that the Thomson-Reuters numbers are usually higher than the S&P data; there are only 22 out of 90 quarters where the S&P number was higher and the average spread was only 50 cents per share. According to analyst reports, Thomson-Reuters “fits” its series to more closely match analyst estimates (which its I/B/E/S division gathers). Although neither series purports to be GAAP, most likely, the Thomson-Reuters series is less adherent than S&P. Thus, any P/E calculated off the Thompson-Reuters data will tend to be understated. The second issue, and perhaps the more important one, is the signal being sent by the divergence of the two series. On the above chart, we have included vertical gray bars indicating recessions; note that when the two series diverge by 10% (1.10 on the above chart), the economy is in recession. Thus, the current divergence is a concern. There are several other business cycle indicators that suggest the economy is not in a downturn, but this indicator is clearly flashing a warning sign.
Which is the more accurate number? Frankly, like so many other situations in life, it depends. At this part of the business cycle, the S&P number is probably more informative. In previous cycles, S&P’s weaker earnings were an indicator of an impending change in the business cycle. That’s why the current divergence is a warning sign. On the other hand, the Thomson-Reuters numbers are a more accurate representation of operating earnings during the recovery from recession. Note on the above chart that the S&P earnings numbers tend to “catch up” with the Thomson-Reuters numbers as the recovery begins.
The P/E chart included at the end of our Daily Comment, which we update weekly, uses the S&P operating earnings data for historical earnings data. The expectations data comes from I/B/E/S, so it comes ultimately from Thomson-Reuters. This means our P/E may be somewhat understated, although not nearly as much as a pure forward-looking number would suggest using the Thomson-Reuters data. Given where we are in the business cycle, the S&P numbers are probably a better reflection of operating earnings, meaning the forward P/E may be offering investors false comfort.