Asset Allocation Weekly (November 4, 2016)

by Asset Allocation Committee

With the elections coming next week, it seems like a good time to look at how markets have historically performed during election cycles.  We will compare the current election cycle against previous cycles.

The blue line in the chart above shows the indexed market return for the period 1928-2015.  To create this average cycle, we use the weekly returns of the S&P 500 Index starting with the first week of the election year through the end of the fourth year of the presidential term.  The weekly dataset begins in 1928.  The average gain in the first year of the cycle is about 6%.  By Q3 of the second year of the cycle, the average return of the S&P 500 is approximately 13%.  Equity markets move sideways to lower into late Q3 of the third year and then, on average, stage a strong rally into the last year before the election cycle begins anew.  The rally that begins in year three is a fairly well documented phenomena; politicians want to be re-elected and thus create policies that boost growth and, on average, lift equity prices as well.  We have added the S&P 500 performance for the current cycle, indexed to the first Friday close of 2016 (red line).  Although the market has been volatile, its performance has been close to average since the dip in Q1.

To further analyze the data, we break the historical data into four categories: incumbent Democrat president, incumbent Republican president, new Democrat president and new Republican president.  We define incumbent as a consistent party in power.  For example, this means we had a Democratic incumbent from 1936 through 1951, which encompassed both Roosevelt and Truman.  Similarly, we had an incumbent GOP from 1984 through 1991 which included Reagan’s second term and Bush’s only term.

As the chart shows, markets have had the best outcome when an incumbent Democrat wins.   A new Republican president tends to track an incumbent Democrat until the year after the election, then underperforms.  A new Democrat has historically been the worst outcome for the market (excluding the late 4th year rally).  The current cycle is mostly following the incumbent Democrat/new Republican averages, suggesting that the equity market isn’t offering significant insights thus far.  However, it does imply that, regardless of the outcome on Tuesday, we will likely see a recovery into the New Year in that we will either have a new GOP president or an incumbent Democrat president.

Although most analysts are assuming a Clinton win based on polling, this analysis does suggest some equity market trepidation as we are currently underperforming both of the most probable outcomes.[1]  This underperformance could reflect the volatile nature of this election season or expectations of monetary policy tightening in December.  However, given the usual electoral pattern, we would not be surprised to see a stronger equity market into at least the first half of next year.

View the PDF

_________________________

[1] It is possible a third party could win, but highly improbable.  The most likely outcome is either an incumbent Democrat or a new Republican.

Weekly Geopolitical Report – The Geopolitics of the Reserve Currency: Part 2 (October 31, 2016)

by Bill O’Grady

In Part 1 of this report, we discussed how the reserve currency facilitates trade, provided a short history of the dollar’s evolution as the reserve currency and examined the theoretical backdrop of the reserve currency and its role as a global public good.

In this week’s report, we will conclude with the economics and geopolitics of the reserve currency and discuss potential market ramifications.

The Economics of the Reserve Currency
When the U.S. accepted the reserve currency role in 1944, the U.S. economy dwarfed the rest of the world.  However, the relative size of the American economy has declined, in part due to the success of U.S. policy in rebuilding the free world after WWII.  This situation accelerated with the development of China.  On a purchasing power parity basis, the U.S. is currently the second largest economy in the world, with China being the largest.

View the full report

Asset Allocation Weekly (October 28, 2016)

by Asset Allocation Committee

My weekend exercise is to take my dogs on long walks.  Both dogs seem to enjoy these walks and I use the time to listen to podcasts.  I recently listened to a long podcast that interviewed Sebastian Mallaby, a British journalist and senior fellow at the Council on Foreign Relations.  He has recently written a biography on Alan Greenspan, titled The Man Who Knew.  The FT Alphachat podcast[1] was an interview about that book.

Although I haven’t read the book yet (it’s on the list), a key takeaway from the podcast was that one of Greenspan’s attributes was that he was a savvy political operative.  He understood that the Federal Reserve operates in a political environment and that one of the Chair’s jobs is to manage the political system to maintain the central bank’s independence.  Mallaby suggested in the podcast that Greenspan was truly a “maestro” in managing the political situation.  However, as I listened, I wondered if managing the political situation meant that monetary policy was being framed to please the politically powerful.

This chart shows the Shiller Cyclically Adjusted Price Earnings ratio (CAPE).  We have placed a vertical line at December 1996 when Greenspan gave his famous “irrational exuberance” speech, raising questions about equity market valuations.  As the chart shows, the CAPE was approaching levels near the peak of the 1929 stock market bubble that was soon followed with a massive market crash.  Although Greenspan didn’t suggest that the Fed was about to change monetary policy to curb asset prices, equity markets around the world fell sharply on fears that Greenspan was about to use monetary policy to lower the stock market.  Greenspan faced heavy criticism for the speech.[2]  Being the consummate political operator, Greenspan’s Fed policy seemed to evolve into a form where asset market bubbles cannot be established in advance and the job of the central bank was to use monetary policy to repair the damage wrought to the real economy once the bubble collapses.

This chart overlays the Chicago FRB National Financial Conditions Index and the fed funds rate.  The index measures stress in the financial system.  The higher the reading, the greater the stress in the system.

The two series were closely correlated (85.1%) from 1973 through 1997, until the financial conditions index was created in 1998.  When fed funds rates rose, financial conditions deteriorated.  In some respects, financial conditions acted as a “force multiplier” for policy.  But, from 1998 to the present, the two series have become virtually independent.  After hearing Mallaby’s podcast, we suspect the FOMC may be trying to keep financial conditions calm, which could be construed as a reading under zero on the above chart.

This chart shows a model of household net worth regressed against nominal GDP.  Both series have been log-transformed.  Net worth was elevated into the early 1960s but steadily declined into the late 1970s.  It began to rise in 1995.  Note that since 1998, net worth has generally outpaced GDP except during recessions.

Currently, net worth relative to GDP is elevated.  It does appear that these increases in net worth that outpace the overall growth of the economy could be a function of monetary policy.  As investors become confident that the Federal Reserve will continue to suppress financial stress, it appears there is a tendency for asset prices to rise to lofty levels.  When valuations become unsustainable, often at the turn of the business cycle, it appears that sharp declines in net worth, caused by price declines in real and financial assets, leads to a fall in household net worth.

Mallaby’s research of Greenspan suggests he was inclined to allow asset prices to rise while striving to contain price inflation.  It is arguable that Greenspan’s policies with regard to financial system stress have been adopted by his successors.  If so, monetary policy is probably (although perhaps inadvertently) designed to aid asset prices.  As the last chart shows, net worth is elevated again at levels that have been difficult to sustain in the past.  We still believe that recessions are the primary triggers of market corrections and we closely monitor the economy for such events.  The current level of valuation makes this exercise even more critical.

View the PDF

______________________

[1] http://ftalphaville.ft.com/2016/10/21/2177678/podcast-our-chat-with-sebastian-mallaby-on-alan-greenspan/

[2] http://www.wsj.com/articles/SB95774078783030219

Keller Quarterly (October 2016)

Letter to Investors

In our July letter we wrote about the “is-ought problem,” the tendency to confuse the world we have with the world we wish we had.  As we noted then, this problem represents a major danger around election time for investors (and others).  The danger is that investors may be so consumed with the world that ought to be (i.e., one in which all their candidates win) that they fail to account for the world that is.  The world that is is usually a messy world, with divided governments and unsatisfying compromises.  This is the world in which we have to invest, regardless of who is president.  We at Confluence are concerned only with the world that is; that’s the world we have to wrestle with as investors.  We’ll leave the world that ought to be for political theorists and utopians.

It’s rare that all or most sides of a political debate agree on what ought to be regarding an issue; however, when it occurs, we must sit up and take notice.  We have actually seen that happen in this most contentious of political seasons.  The issue in question is trade; specifically (for the first time in my memory), both presidential candidates of the two major political parties stand in opposition to a major international trade treaty, the Trans-Pacific Partnership (TPP).  Trade pact news is usually buried on page A17 of most newspapers and is rarely the sort of issue that gets the political blood rushing.  While most voters are focused on other issues, here is one issue that both candidates seem to agree on, and that gets our attention.

Trade particularly gets our attention because the globalization of trade that has prevailed since the late 1970s has been, in our opinion, one of the major factors in reducing inflation, not just in the U.S., but around the world.  We don’t have time in this short letter to go into the reasons this is so or why the candidates have come out against the TPP.  (Our chief market strategist, Bill O’Grady, has written extensively on this in our Weekly Geopolitical Reports.) Suffice it to say that after blowing in the same direction for about 40 years, the trade winds have shifted.  The Brexit vote, wherein the British people voted to separate the United Kingdom from the European Union, is a comparable event and illustrates that this trend is not a U.S.-only phenomenon.  If this political trend in opposition to unfettered trade between nations becomes a consensus, then we may be looking at rising inflationary expectations (for the first time in 35 years).  Rising inflation would probably pressure interest rates up and stock valuation metrics down.

We don’t raise this issue to scare you, but to provide an example of what we look for as we analyze the political theater before us.  Agreement between candidates is rare, but when they agree on an issue that affects the portfolios of all investors, we must take notice.  There are powerful influences in both government and business that greatly favor the TPP and other trade pacts.  It’s not at all certain that either candidate could easily unwind the pro-trade consensus.  But we want you to know that we are paying close attention to this and possible implications of the political process, even if they’re on the back pages.

We appreciate your confidence in us.


Gratefully,

Mark A. Keller, CFA
CEO and Chief Investment Officer

View the PDF

Weekly Geopolitical Report – The Geopolitics of the Reserve Currency: Part 1 (October 24, 2016)

by Bill O’Grady

One of the more interesting developments in this presidential political cycle has been the near total abandonment of free trade.  Neither presidential candidate supports the Trans-Pacific Partnership (TTP) or the Transatlantic Trade and Investment Partnership (TTIP), the topic of last week’s report.  The primary reason for this backlash against free trade is the fear that U.S. employment is adversely affected by trade.

Some of the earliest work in economics was on trade.  For example, the trade theory of comparative advantage was developed by David Ricardo in 1817.  With perhaps the exception of Marxism,[1] most economists assume that trade is positive for economies.  Most polls seem to suggest Americans still support free trade, but clearly the political class has concluded that supporting free trade is a risky stance.  So, how did we get here?

We believe that the general misunderstanding of the U.S. superpower role is behind the backlash against free trade.  In pure theory, it’s hard to argue against free trade.  Most economists adhere to the position that efficiency is an undisputable good.  However, the way trade works in the real world isn’t exactly how it works in the classroom.  Often, political pundits will contend that the growing rejection of free trade is due to the fact that the benefits are broad but the costs fall disproportionately on workers who are adversely affected directly by import competition.  Although this is a partial explanation, it is critical to understand that the global hegemon faces specific costs that are generally unappreciated.

In this report, we will begin with a narrative describing the use of the reserve currency in trade.  Next, we will offer a short history of the dollar’s evolution as a reserve currency.  In the next section, we will examine the reserve currency as a global public good, provided by the superpower.  Next week, we will discuss the economics and geopolitics of the reserve currency and, as is our usual fashion, we will conclude with potential market ramifications.

View the full report

___________________________

[1] Some Marxists hold that trade is a form of imperialism and is another tool for capital to subjugate labor.

Asset Allocation Weekly (October 21, 2016)

by Asset Allocation Committee

The dollar has been strengthening over the past few weeks; we believe much of this appreciation is due to expectations of tighter monetary policy.  Fed funds futures suggest that there is a 60+% chance of a rate hike at the December FOMC meeting.  Although the FOMC is divided and there are prominent doves that oppose any tightening, the consensus on the committee seems to be leaning toward a 25 bps increase.  However, we also suspect that the next hike (following December) will be delayed for several months.  In other words, to placate the doves on the FOMC, Chair Yellen will need to promise a very slow path; to satisfy the hawks, she will need to raise rates in December.

There are at least four different ways to value currencies—relative inflation, relative interest rates, trade performance and relative productivity.  As a general rule, if any of the four performed consistently, the other three wouldn’t exist.  Of the four, relative inflation, so-called “purchasing power parity,” is the oldest.  Although most of the time it doesn’t give strong signals, it does tend to indicate when a currency pair is at an extreme.

This chart shows the purchasing power parity relationship between the dollar and the D-mark.  We use the legacy German currency and calculate its currency value based on its conversion rate at the time the euro was introduced.  We do this for two reasons; first, we have a consistent inflation history with Germany, and second, Germany is the dominant economy in the Eurozone, meaning the comparison with Germany is likely representative for the leading nations in the Eurozone.  In our opinion, parity models are only useful at extremes.  When the relationship becomes more than one standard error from parity, it tends to signal a problem with valuation.  Currently, the dollar is overvalued by more than one standard error.  There have only been two other periods when the dollar was stronger based on this measure.  And, we note that this degree of overvaluation has been in place since January 2015, indicating it has been overvalued for a rather long time.

It appears that this deviation from fair value is due to divergent monetary policy.  The spread between German and U.S. three-month LIBOR rates has widened in favor of the U.S.

These charts show the same data in two forms, a simple line graph and a scatter plot.  In 2014, as the markets began to discount future FOMC tightening, the LIBOR rate began to rise modestly.  At the same time, German rates fell sharply as the ECB tried to address deflation and weak economic growth; in fact, German three-month LIBOR remains in negative territory.

Although interest rate differentials are favoring the U.S., it is interesting to note that the explanatory power of interest rate differentials in the purchasing power parity model is modest at best.  In other words, in relation to the past 36 years, the current spread in interest rates should not be having this degree of impact.  The current spread is having an expanded impact mostly due to the current level of low rates.[1]

Complicating matters is that the U.S. three-month LIBOR rate has been rising due to changes in U.S. money market regulation.  There has been a sustained exodus of liquidity out of institutional prime money market funds and this has led to higher three-month LIBOR rates.  We doubt this level of LIBOR will be sustained over time, and so the U.S. side of the interest rate spread should ease.  In addition, German LIBOR rates have been negative for the past few months.  We doubt the ECB will maintain negative rates much longer and instead use QE for monetary stimulus.  Thus, we would expect the spread to narrow in the coming weeks.

In addition, there has been a marked change in market expectations toward FOMC monetary policy.

This chart shows the spread between the fed funds target and the two-year deferred Eurodollar futures contract.  The latter shows the market’s projection for future three-month LIBOR rates.  For much of the past two years, Eurodollar futures were projecting a terminal rate for fed funds of 1.50%; that has now declined to around 75 bps.  Simply put, the financial markets expect perhaps one or two more rate hikes over the next two years.  If this is all we get, we would expect the rate differentials between Germany and the U.S. to steadily contract.

It is worth noting that the current strength of the dollar appears based on the policy spread in 2014-15.  If so, once the market adjusts to a lower terminal fed funds target, we would expect some dollar weakness to develop.  In the second half of next year, a USD/EUR of 1.25 (a USD/DMK of 0.6410) would be likely.  A weaker dollar would be supportive for equities and commodities and bearish for debt and foreign equity markets, although this weakness would be partially offset by stronger foreign currencies.  In addition, emerging equities usually strengthen relative to developed markets when the dollar weakens.  Thus, in our asset allocation models, we have been slowly adding commodities and emerging equities to portfolios.  If the dollar weakens in 2017, we would likely build on these initial positions.

View the PDF

______________________

[1] Since 1970, the average spread between the U.S. and Germany is 69 bps, suggesting the current spread of 119 bps is rather wide.  However the standard deviation is 235 bps, meaning the current spread is within the normal range.

Weekly Geopolitical Report – The TTIP and the TPP: An Update (October 17, 2016)

by Bill O’Grady

In January 2014, we first discussed the Transatlantic Trade and Investment Partnership (TTIP) and the Trans-Pacific Partnership (TPP).[1]  Both pacts have moved from obscure trade proposals to highly controversial political issues.  In this report, we will begin by discussing the nations involved.  We will examine overall details of the proposals, focusing on how they are different from traditional trade agreements.  From there, we will present an analysis of the controversy surrounding these proposals.  A look at the geopolitical aims of the agreements will follow and the likelihood that these treaties will be enacted.  As always, we will conclude with potential market ramifications.

The TTIP and the TPP
The TTIP will include the U.S. and all the nations of the EU.[2]  The TPP, which initially started with four nations, Brunei, Chile, New Zealand and Singapore, has expanded to 12 nations.[3]  Taiwan expressed interest in the TPP last year, but it is unclear whether the current configuration is comfortable with engaging in the age-old dispute over Chinese sovereignty.  South Korea has also decided to hold talks about joining the TPP group.  Conspicuous in its absence is China.

View the full report

____________________________

[1] See WGR, The TTIP and the TPP, 1/27/2014.

[2] Austria, Belgium, Bulgaria, Croatia, Czech Republic, Denmark, Estonia, Finland, France, Germany, Greece, Hungary, Ireland, Italy, Latvia, Lithuania, Luxembourg, Malta, Netherlands, Poland, Portugal, Romania, Slovakia, Slovenia, Spain, Sweden and the U.K.

[3] Australia, Canada, Japan, Malaysia, Mexico, Peru, U.S., Vietnam, Chile, Brunei, Singapore and New Zealand.

Asset Allocation Quarterly (Fourth Quarter 2016)

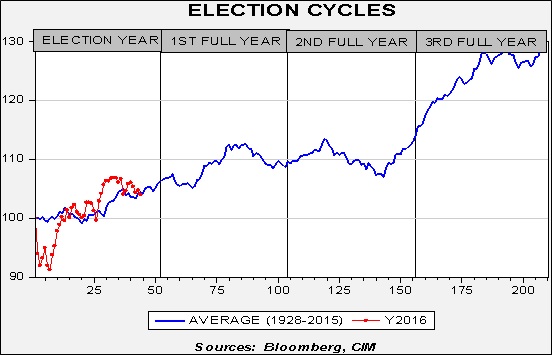
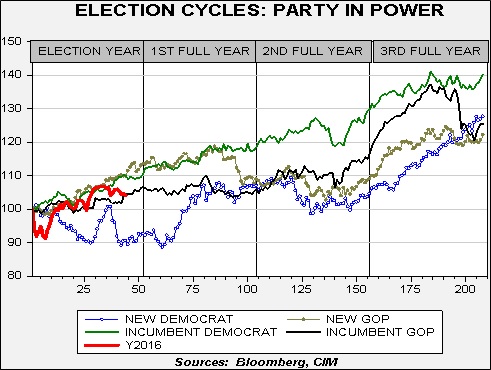
  • Although presidential elections gather a lot of attention from investors, we believe the specific person or party getting elected in this cycle may be less important than the forces driving the elections.
  • The Fed is likely to raise rates gradually and we don’t expect the tighter policy to create a recession.
  • Our equity allocations remain primarily domestic, although we believe emerging markets present an attractive return/risk opportunity for risk-tolerant investors.
  • We include a range of maturities in our fixed income allocations.
  • Our commodities allocation remains focused on gold to help address certain geopolitical and currency risks.
  • Our style guidance remains modestly in favor of growth over value at 60/40.

ECONOMIC VIEWPOINTS

For over 16 years, including many prior to forming Confluence, we’ve worked together providing quarterly reports about our asset allocation models. And every four years we face a presidential election that often attracts an outsized amount of attention from investors. We frame it as outsized because the outcome of most presidential elections alone is generally not of great consequence to the markets. Elections certainly do have broad consequences, but the financial markets usually adjust pretty quickly.

This isn’t to say presidential elections are insignificant. But right now, the specifics of who occupies the White House is perhaps less important than understanding the changing force voters are exerting on the U.S. political system. So, regardless of which party takes the helm, both are going to have to deal with this force, which we expect to continue and grow well beyond this election cycle. What does this force look like? It’s complex and multifaceted, but we think it’s essentially a transition. We believe our economic philosophy is shifting away from an emphasis on efficiency, and more toward one of equality. We expect this shift to take years, and last for perhaps decades. If we are near the beginning of the transition, as we believe we are, there a few things for an investor to monitor.

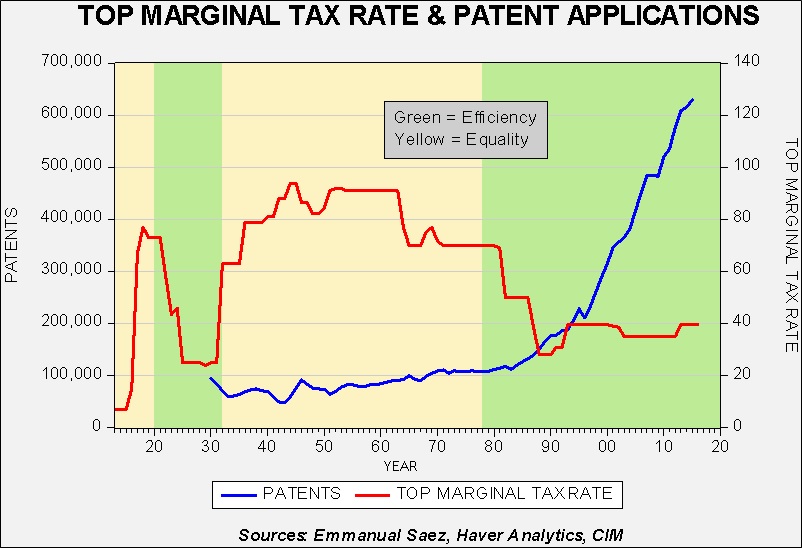
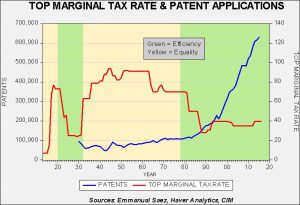
To begin, let’s consider what we mean by “efficiency” in the economy. With efficiency, tax rates and regulation are lower, fostering greater competition and innovation. Patent applications rise, along with technological developments that drive new products and processes. Business efficiency and profitability rise, while those building better mousetraps earn and keep significant wealth. Global trade rises as businesses seek to shift production to areas of lower cost, while simultaneously growing into new markets. Technology and globalization create obsolescence in the labor force, along with the creative destruction of existing plants, equipment and processes. Innovation and competition lower inflation, which benefits the broad population, but high returns on capital accrue disproportionately to those who have capital. In a nutshell, you get the Internet, iPhone and low prices, while workers are displaced and the wealthy become wealthier. We’ve been in the efficiency cycle for almost 40 years.

In contrast, with an “equality”-focused economy, tax rates and regulations rise, lowering incentives to innovate. Competition declines as a more rigid regulatory framework gains prominence. New product development declines, employment becomes more predictable and there’s less obsolescence. Global trade slows, creating more inflation. The income gap narrows between the wealthy and the poor. Here we see much longer cycles between the new iPhones, and they’re even more expensive with fewer meaningful upgrades. The retail industry is less threatened by Amazonian forces and participation in the labor market can stabilize and even grow. We may be heading into this environment. The chart on the next page illustrates the efficiency/equality transition.

A transition from efficiency to equality will take time and transcend several election cycles. The speed and depth of the transition are difficult to predict, but we feel the political parties are likely to feel ongoing pressure to change the established system of efficiency. Too many voters feel as though the current environment is unacceptable. Politicians and parties will adjust or lose their positions of governance.

Although we may be at the beginning of a transition, we don’t believe it’s likely to create a recession over our projected forecast period of three years.  On that front, we believe Fed policy is more immediately relevant.  Although the Fed has telegraphed a moderate pace of raising rates, forward interest rates indicate a broad expectation that the Fed will go even slower.  In this instance, our expectations are more aligned with the market, and we believe the economy is likely to continue along its path of slow growth for quite a while.

STOCK MARKET OUTLOOK

Although the aforementioned transition to equality may lower growth in corporate profits and increase inflation, we expect a gradual pace of change, allowing equities to perform reasonably well. Looking forward, we believe the return/risk profile of stocks is generally constructive and we continue to diversify across capitalization sizes. This quarter we trim the small cap exposure in some portfolios, recognizing its recent strong performance. We are also beginning to utilize emerging market equities across more portfolios as we see potential upside from favorable currency trends and low valuations.  Still, emerging market equities are highly volatile, so we utilize only a limited allocation, except where risk tolerance is high.

With regard to our large cap sector weights, we remain overweight energy but pare back the exposure after the sector’s very strong performance. We are also overweight the technology, industrial and consumer discretionary sectors, while being underweight financials, utilities and telecom. (We continue to allocate to real estate as a separate asset class; see comments in the Other Markets section below.) These sector views are formed from our work on valuations and industry fundamentals. Our growth/value posture remains at 60/40.

BOND MARKET OUTLOOK

As the economy shifts from efficiency to equality, we will be keeping close tabs on inflation, which tends to create significant risks for bond investors. However, we do not anticipate inflation to emerge quickly or without a measure of warning. Excess global supply capacity remains high for many industries and inflation is unlikely to build unless global trade is dialed down. Such a trend is possible but not yet in place. Accordingly, we continue to believe bond investors can utilize a combination of short, intermediate and long maturities in their portfolios. Bonds continue to provide excellent diversification and can help to address market volatility when combined with other asset classes.

At this point we do not anticipate a recession and do not expect large increases in bond defaults. Therefore, we continue to believe corporate bonds are relatively attractive. Still, our focus remains on investment grade corporate bonds, which we prefer over speculative grade bonds.

OTHER MARKETS

We expect real estate fundamentals to remain generally strong and believe this asset class can benefit from ongoing low interest rates. Still, this asset class has performed very well and we trim the exposure in some portfolios this quarter. Looking forward, the return/risk remains attractive, particularly where income is an objective.

Commodities continue to provide diversification and we focus our commodities allocation on gold. Gold helps to address some of the risks emerging from global central bank policies aimed at depreciating currencies. This precious metal can also help address certain geopolitical risks and can perform well in the event the U.S. dollar weakens relative to other major currencies.

View the complete PDF

Asset Allocation Weekly (October 14, 2016)

by Asset Allocation Committee

Given continued sluggish economic growth and fears that monetary policy has reached the point where it can no longer stimulate growth, a renewed attention has been brought to discretionary fiscal policy.  In the 1970s, discretionary fiscal policy fell out of favor due to a number of shortcomings:

  1. Public investment, if needed, should not be timed to offset recessions. In other words, if the Navy needs an aircraft carrier, one should be built without waiting for a recession.  Thus, public investment should be based on need, not designed as a countercyclical policy.
  2. Discretionary policy must pass through the legislative process. This tends to slow the outcome to the point that the recession may have passed by the time Congress allocates spending.
  3. Fiscal spending, especially fixed asset spending, can “crowd out” private spending. In functioning investment markets, investment spending should be generated by cutting interest rates rather than by directing public investment by government fiat.  In addition, private investment is forced to pass through the test of profitability, reducing the likelihood of malinvestment.

From the late 1970s, economists generally concluded that discretionary fiscal spending was unnecessary and that countercyclical monetary policy was sufficient to guide the economy through recessions.  Although there were occasional extraordinary fiscal measures taken during some downturns, such as tax rebates and extended unemployment insurance payments, for the most part, monetary policy was the measure of choice in terms of countercyclical policy.

However, the developed world now finds itself in a situation where monetary policy may have reached its point of diminishing returns.  The Bank of Japan (BOJ), the Swiss National Bank and the European Central Bank (ECB) have tried to implement negative interest rates.  In these cases, it appears that the damage to the banking system is offsetting any gains from lower rates.  Balance sheet expansions (QE) have been deployed by the aforementioned central banks and the Federal Reserve.  In general, balance sheet expansion has become less effective; a common complaint is that asset values have been extended in many markets without generating much economic growth.  Central banks are also struggling to find assets to purchase.  The BOJ has been buying equity ETFs and the ECB has added corporate bonds to its balance sheet, causing further financial market distortions.

This isn’t to say that the central banks have exhausted all their options, but the ones that remain cannot be implemented without help.  For example, central banks could implement quantitative easing by purchasing foreign bonds; this would likely lead to currency depreciation that would boost exports.  However, such “beggar thy neighbor” policies would likely bring retaliation and further reduce global trade.  The other option is “helicopter money,” which is the direct central bank financing of government spending.  Although this policy would be effective, it does require the participation of fiscal authorities.   In addition, central bank independence would almost certainly be compromised.

So, if fiscal policy is expanded, would we face the problems outlined above?  Generally speaking, the biggest risk would be point #2 above.  Getting spending plans through a divided Congress would be difficult.  In addition, avoiding malinvestment, regardless of whether it’s public or private, is always hard.  But in the current partisan environment, coming up with public investment that would foster future growth will be problematic.  However, there is evidence to suggest that public spending has been neglected for some time and that private investment is currently weak, reducing the problem of “crowding out”; in other words, concerns about points #1 and #3 are reduced.

This chart shows the net stock of fixed assets for both the public and private sectors.  We have log transformed the data and de-trended both series.  In general, a reading over zero indicates the net stock of fixed assets is above its long-term trend and vice versa.  Note that public sector assets were above trend from 1940 into the mid-1990s.  This was mostly due to elevated Cold War defense spending.  During this period, private sector fixed asset levels tended to remain under trend, although a surge that began in the mid-1960s did eventually lead to a rise above trend.  Note that the surge of both public and private spending on fixed assets in the 1970s probably led to crowding out and higher inflation.

Current conditions suggest that both private and public sector investment are well below trend.  In general, private sector investment tends to have a greater impact on future growth and would thus be preferred.  However, given an environment of weak asset formation from both sectors, the economy would likely benefit from increased investment in either sector.  Thus, promises of increased spending on infrastructure and defense would likely have a positive effect on the economy and be positive for equity markets.

View the PDF