Asset Allocation Weekly (November 17, 2017)

by Asset Allocation Committee

[Ed note: We will not publish an Asset Allocation Weekly Comment the week of November 24. The next comment will be published December 1.]

Over the past three weeks, we have seen a rise in the yields on high-yield bonds.  The Merrill Lynch High Yield bond effective index is up 40 bps since late October.[1]  There are a number of reasons for the sudden weakness.  They are:

  1. The tax bills in Congress may limit the deductibility of interest for corporations. Since many high-yield issuers are dependent on debt to fund their operations, a tax change could have an adverse effect on these companies and their high-yield issuance.  At the same time, we remain pessimistic that major tax reform is likely and so the final version of any tax changes will likely be limited.
  2. Telecom and health care sectors have suffered some weaker earnings growth. The failed merger talks between Sprint (S, $6.21) and T-Mobile (TMUS, $56.52) also dampened sentiment in the telecom sector.  Since these sectors are important issuers of high-yield debt, their problems have raised concerns.
  3. Spreads have narrowed significantly.

This chart shows the Merrill Lynch High Yield Master effective yield and the five-year T-note yield.  The lower lines on the chart show the average spread and the standard deviation lines.  The narrowing spread, by itself, doesn’t necessarily signal an imminent problem.  As the above chart shows, spreads can remain at the lower deviation for an extended period of time.  However, a spread at the lower deviation also suggests a market that is richly valued.

  1. The relationship of high yield to monetary policy suggests that major reversals in the high-yield spread tend to occur well into a tightening cycle.

This chart shows the high-yield spread and the fed funds target.  Major spikes in the spread are more likely after policy has already been tightened.  In addition, the spread often continues to widen after policy easing has commenced.  This pattern indicates that the spread is very sensitive to financial stress; in fact, most financial stress indices include both high-yield bonds and high-yield spreads in their construction.

Although there has been much press in the financial media on the recent backup in yields, the most recent change is barely visible on the spread.  There isn’t any obvious increase in financial stress, and monetary policy, while tightening, is not at a level that indicates it is near the end of the cycle nor is it at a level that should be causing stress.  In our Asset Allocation portfolios, we have been reducing our exposure to high-yield bonds in the income-oriented programs due to high-yield spreads falling to the lower deviation.  However, we don’t expect that the recent rise in yields signifies the onset of a financial crisis.  Obviously, we will continue to monitor the situation but, for now, we are comfortable with our current allocations to this asset class.

View the PDF


[1] https://fred.stlouisfed.org/series/BAMLH0A0HYM2EY

Weekly Geopolitical Report – The Situation in Catalonia: Part II (November 13, 2017)

by Thomas Wash

In Part I of our report, we examined the historical background of the Catalan independence movement.  This week, we will continue our discussion by summarizing the constitutional crisis, identifying the significant players and their motives, noting the possible outcomes and concluding with market ramifications.

Constitutional Crisis: A Summary
In addition to the historical differences mentioned in Part I, the Catalan separatist movement can be partially attributed to the vagueness of the Spanish constitution.  Although the constitution states that Spain is made up of 17 autonomous communities, the term “autonomous community” is loosely defined.  According to the constitution, an autonomous community is a self-governing region in which people share “…common historic, cultural and economic characteristics.”[1]  Furthermore, the preamble of the Spanish constitution fails to group people under the same nationality.  For example, the preamble of the U.S. constitution states, “We the people of the United States,” whereas the Spanish preamble states that the constitution “protects all Spaniards and peoples of Spain.”  As a result, the constitution’s recognition of ethnic regions and its failure to establish a unified Spanish identity have bolstered ethnic pride at the expense of national identity.

The constitution’s vagueness has also led to tensions between the autonomous community governments and the central government.  Autonomous communities like Catalonia frequently ask for additional powers and greater independence from the central government.  To the Catalan separatists, Catalans are not “Spaniards” but rather a “people of Spain.”  This sentiment is expressed in the Catalan constitution, which refers to Catalans and Spaniards as separate groups, although both groups have the same rights.

View the full report


[1] Spanish Constitution, Section 143, Part 1

Asset Allocation Weekly (November 10, 2017)

by Asset Allocation Committee

Last week, we discussed our views of the debt markets.  However, one item we didn’t examine was the dynamics of the yield curve.  The U.S. Treasury market has both a domestic and an international component.  While all sovereign debt markets have a domestic component, the international component is especially a factor for the U.S. because the dollar is the reserve currency.  In our Treasury model, we use inflation expectations and fed funds for domestic elements.  For foreign elements, we use the yen/dollar exchange rate, German bund yields and oil prices.  Our model suggests that the dynamics of the yield curve are affected primarily by the domestic component.

Shifts in the yield curve are driven mostly by a combination of monetary policy and inflation expectations.  As a general rule, short-duration instruments are more sensitive to monetary policy and less to inflation expectations.  Long-duration instruments have the opposite characteristics.   When we model the two-year Treasury and the 10-year Treasury, these characteristics are confirmed.

These are the coefficients of our Treasury model.  The impact of the inflation variable has more than twice the impact on the 10-year Treasury compared to the two-year Treasury.  At the same time, the impact of fed funds is more than twice as important to the two-year Treasury compared to the 10-year Treasury.

Our inflation variable is really about measuring inflation expectations.  We use the 15-year moving average of the yearly change in CPI and developed this variable based on Milton Friedman’s research.  He postulated that inflation expectations are formed over a long period of time.  This is our proxy for inflation expectations; although this moving average works reasonably well over time, we do realize that inflation expectations can have sudden shifts.

This chart shows the 15-year average of inflation compared to the implied five-year forward inflation rate from TIPS.  Although the moving average isn’t a perfect proxy for inflation expectations, it has worked as a measure of central tendency since 2009.  And, since the instruments haven’t been around for very long, it’s difficult to know how the average compares over a longer time frame.  But, for our purposes, it is a workable proxy.

When inflation expectations become volatile, policymakers describe these conditions as times when inflation expectations become “unanchored.”  These periods can make the conduct of monetary policy difficult.  If inflation expectations rise, policymakers are likely to raise rates aggressively to contain those fears.  At the same time, a decline in expectations can be just as problematic.  If the FOMC is raising the target for fed funds while inflation expectations are falling, the yield curve will flatten.  The FOMC would generally prefer a steeper yield curve.  The Federal Reserve doesn’t do a good job of explaining why it wants “higher inflation,” which would seem to be a goal worth avoiding.  What it really means is that it wants steady to modestly higher inflation expectations when it is raising the policy rate; otherwise, the yield curve will flatten and increase the likelihood of a recession.

Currently, the two-year versus 10-year Treasury yield spread is above zero but the curve is clearly flattening.  If the FOMC continues to tighten into stable (or perhaps falling) inflation expectations, the yield curve could invert and perhaps signal the end of this long business expansion.

The recent flattening of the yield curve suggests that inflation expectations are probably declining.  If the Federal Reserve raises rates as much as planned and inflation expectations remain anchored at around 2%, we estimate the yield curve will fall under 50 bps.  However, if inflation expectations decline, policymakers could overshoot rate hikes and increase the risk of recession.  Our base case is that central bankers will remain cautious but it is a factor we will be watching closely next year, especially as the new composition of the Fed’s Board of Governors becomes apparent.

View the PDF

Weekly Geopolitical Report – The Situation in Catalonia: Part I (November 6, 2017)

by Thomas Wash

On October 27, Spanish Prime Minister Mariano Rajoy triggered Article 155 of Spain’s constitution.  This allowed him to dissolve the Catalan Parliament, also known as the Generalitat, and hold new regional elections on December 21, 2017.  Tensions between the Catalan government and the Spanish government reached a boiling point following the Catalan government’s decision to hold an illegal referendum for Catalan independence on October 1.

On the day of the referendum, Prime Minister Rajoy ordered the national police and the civil guards to close polling stations by any means necessary.  Images of the violent clashes between voters and Spanish authorities circulated around the world, without denouncement from the European Union.  Following the results of the referendum, in which the Catalan government claimed that 90% of Catalans voted to leave Spain, Catalan President Carles Puigdemont vowed to begin the process of Catalan secession.  Spanish equity markets have been volatile since the referendum, but have recently calmed after an agreement between the Catalan political parties to take part in the new election.

In Part I, we will discuss the history of Catalonia.  We will give a broad overview of how the Spanish state was created, look at its history under Spanish rule and close with a summary of the revival of the Catalan independence movement.  Next week, in Part II, we will look into the current constitutional crisis as a result of the referendum and conclude with market ramifications.

View the full report

Asset Allocation Weekly (November 3, 2017)

by Asset Allocation Committee

The 10-year Treasury yield has recently been trending upward.

Since early September, yields have risen from 2.06% to 2.46%.  What’s behind this rise and do we expect it to continue?

We use our 10-year T-note model for guidance.  It estimates the fair value level of the 10-year T-note yield based on the long-term average of inflation, fed funds, German long-dated sovereign yields, the yen/dollar exchange rate and oil prices.

Based on these factors, the current fair value is 2.24%, a bit lower than the current yield.  At the end of 2016, fair value was 1.96%, so the fair value rate has been moving higher.  The primary reason has been a modest rise in German yields, rising fed funds and higher oil prices.

What do we see going forward?  The two independent variables that have the most potential for pushing the fair value higher in the near term are fed funds and German yields.  If the fed funds target rises to 2.25% by the end of next year and nothing else changes, the fair value yield would rise to 2.78%.  If German bunds were to rise in yield to 0.75% at the same time, the fair value yield would rise to 2.80%.  Thus, the primary worry is monetary policy.  As we discussed last week, given the FOMC’s voting roster next year, the FOMC will be unusually hawkish in 2018, so the odds of higher yields are rising.

What about tax policy?  Would larger deficits boost yields?  The impact of deficits on interest rates is mixed.  Perhaps the best way to think about this is with the savings identity.[1]  The identity is: (private saving) + (public saving) + (foreign saving) = 0.  In theory, if tax cuts result in a deficit of public saving, it must either be offset by rising private saving (saving>investment) or rising foreign saving (otherwise known as a current account deficit).  If the public deficit is resolved by private saving, interest rates usually rise.  But, if it is offset by foreign saving, domestic interest rates become a function of foreign interest rates.  In other words, if foreign interest rates are low, domestic interest rates may not necessarily rise.  In practice, large deficits usually occur during recessions and private saving is rising anyway as consumption falls.  Thus, there will be talk about tax cuts boosting interest rates but the evidence isn’t clear to support such statements.

The long-term risk for fixed income is inflation expectations.  We use the 15-year average of CPI as a proxy for inflation expectations.   Although we still expect inflation expectations to remain low, if populism leads to reregulation and/or deglobalization of the economy, inflation and expectations of future inflation would likely increase.  If policymakers conclude that inequality must be reduced by restricting the introduction of new technology and restraining trade, greater inefficiencies will likely bring higher inflation.  If such policies develop, we will become more defensive on fixed income.

View the PDF


[1] For a deeper discussion, see WGRs from May 2017, Reflections on Trade: Parts I-IV.

Weekly Geopolitical Report – North Korea and China: A Difficult History, Part III (October 30, 2017)

by Bill O’Grady

In Part I of our report, we reviewed the Minsaengdan Incident and a broad examination of the Korean War.  In Part II, we completed our analysis of the war, discussed the Kim regime’s autarkic policy of Juche and outlined the impact of the Cultural Revolution on North Korean/Chinese relations.

This week, Part III will cover the controversy surrounding North Korea’s dynastic succession, the end of the Cold War and the ideological issues with Deng Xiaoping.  Finally, we will recap the key insights from this history and the impact on American policy toward the DPRK.  We will conclude, as always, with market ramifications.

View the full report

Asset Allocation Weekly (October 27, 2017)

by Asset Allocation Committee

It is expected that over the next two weeks President Trump is going to appoint a new Federal Reserve Open Market Committee (FOMC) chair and vice chair.  In this report, we will build scenarios of how policy could change depending upon whom the president appoints.

This spreadsheet details our estimate of policy preference, with one being the most hawkish and five the most dovish.

(Sources: Federal Reserve, CIM)

The first column shows the members of the FOMC with the chair in green and vice chair in blue.  We have Fischer still on the roster even though he is now leaving.  The “all” column lists our estimates of policy bias.  The Fed has eight permanent voters—the seven governors and the New York Federal Reserve Bank (FRB) president.  The other 11 regional FRB presidents rotate into a voting position roughly every two to three years.  The last row shows the average of our hawk/dove rankings.  The current voting roster is more dovish than the FOMC as a whole.  Scenario #1 assumes no changes to the chair and vice chair roles, although we know that Fischer is leaving so this scenario is purely hypothetical.  This is to show that even with no changes at the governor level, next year’s voting roster would have been markedly more hawkish regardless, with an average ranking of 2.70 compared to the current ranking of 3.20.

Scenario #2 assumes Jerome Powell, a current governor, is appointed to chair with John Taylor as vice chair.  Powell’s seat is assumed to remain vacant for the foreseeable future, which leads to an even more hawkish FOMC, with an average of 2.33.

Interestingly enough, the FOMC voters are just about as hawkish under the next most likely scenario, with John Taylor as chair and Kevin Warsh as vice chair (Powell remains as a governor).  Finally, if Trump re-appoints Yellen but adds Taylor as vice chair, the average is 2.40; again, not a significant change in policy stance.

So, what is the most likely outcome?  Currently, Powell is considered the front-runner[1] and would be the safest candidate.  He is a moderate like Yellen and would probably maintain the current arc of policy.  According to reports, President Trump had a good meeting with John Taylor and he might select him for vice chair.  There is no indication at this point who would be selected to fill out the rest of the three open seats if Powell is appointed.  It’s possible that Kevin Warsh could be offered one as a consolation prize but, for now, we would not expect the remaining vacancies to be filled until much later in 2018.

The bottom line is that next year’s FOMC will take on a decidedly more hawkish stance due mostly to the hawkish lineup of regional bank presidents.  This is a factor that will affect our outlook for next year.

View the PDF


[1] https://www.predictit.org/Market/3306/Who-will-be-Senate-confirmed-Fed-Chair-on-February-4%2c-2018

Asset Allocation Quarterly (Fourth Quarter 2017)

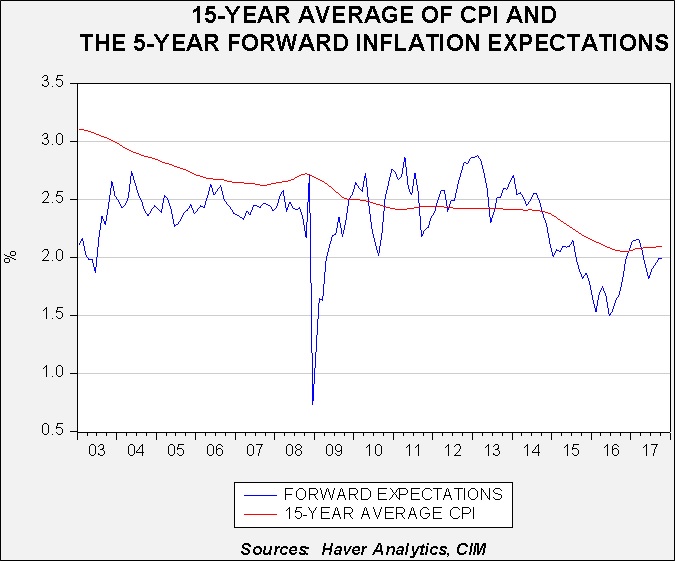
  • Our inflation outlook remains benign and economic data continues to be modestly positive.
  • We do not anticipate a recession in the near term.
  • Though the composition of the Fed will change over the next four months, we expect policy to continue toward tightening through increases in the fed funds rate and a reduction in the size of the Fed’s balance sheet.
  • The larger allocation to intermediate-term investment grade bonds remains intact. However, we reduce exposure to speculative grade bonds due to spreads grinding to their tightest post-recession levels.
  • Our growth/value even weight of 50/50 remains unchanged.
  • We increase our exposure to non-U.S. developed and emerging market equities, the former with a tilt toward Europe, due to expectations for continued U.S. dollar softness and attractive valuations overseas.

View the complete PDF

ECONOMIC VIEWPOINTS

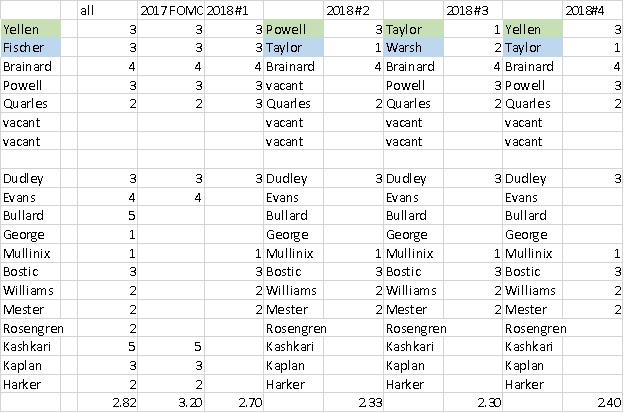
There are a number of potential pending changes to the policy and complexion of the U.S. Federal Reserve as of this writing. First, there are currently three, and soon to be four, open positions on the Board of Governors, the most important of which is the Fed chair. Though we are not expecting a dramatic near-term shift in the trajectory the current Fed has taken, the new arrangement could alter its policies as it is absorbed over the next few quarters. Second, the process of normalizing the nearly $4.5 trillion balance sheet is expected to commence in October as the Fed begins to slowly stop reinvesting the proceeds it receives from maturing bonds. Though the Fed stated it will start with a reduction of just $10 billion a month, over the next year the Fed’s current intention is to increase the amount to $50 billion each month. As this chart illustrates, a level of $50 billion each month will soon have the effect of shrinking the balance sheet.

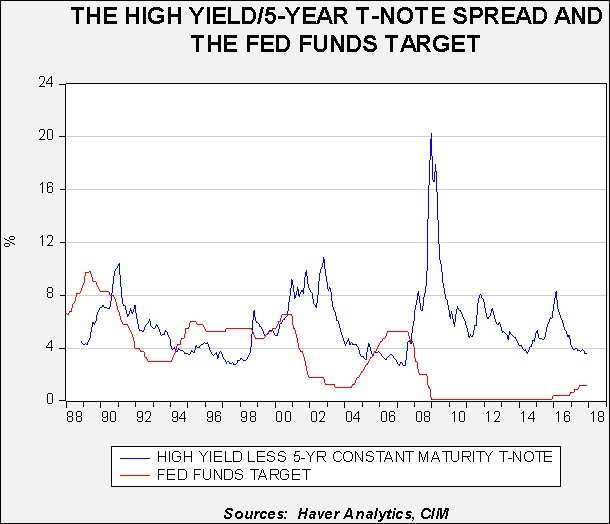
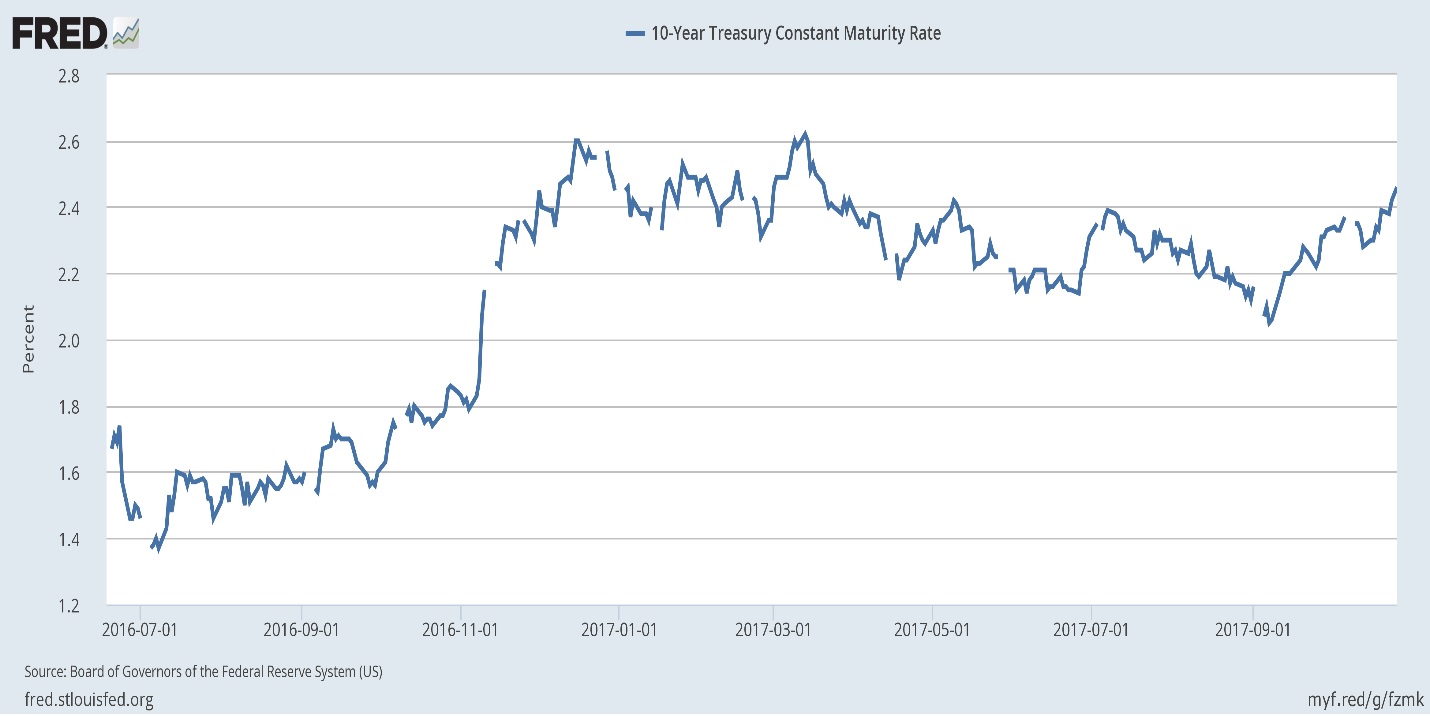
With the recent publication of the Fed’s minutes from the September meeting, the near-term trajectory seems fairly certain with expectations for another hike in the fed funds rate in December already priced into the market. Fed fund futures currently have an implied 80% probability of  a December rate hike. However, the prospect for increases in the rate through 2018 as well as further implementation of quantitative tightening through the reduction in the balance sheet are dependent upon the composition of the Fed’s board. Given the Trump administration’s desire to strike a more populist appeal, it would not be surprising if the Fed adopts a more dovish posture in 2018. Such a pose would imply an extension of softness for the U.S. dollar versus other currencies.

Regarding other domestic economic themes, inflation and unemployment remain at low levels, while consumer and business sentiment are elevated. Although the effects of the disastrous hurricane season and wildfires in northern California will likely weigh on GDP and employment over the next several quarters, we believe the dislocations will prove temporary.

Outside the U.S., the European Central Bank (ECB) announced its intention to begin tapering the amount of its bond purchase program, but also indicated it would be extended further by nine months. We view this as the ECB maintaining its accommodative positioning while recognizing the strength in the underlying economy. It also underscores the ECB’s caution toward the myriad political developments in Europe, including Brexit, German and Austrian election results, the separatist movement in Spain and Italian elections in early 2018. The consequent economic impact holds a large degree of uncertainty, leading the ECB to lengthen its stimulus timeline.

In the realm of geopolitics, though concerns attract headlines, we do not think the current issues hold meaningful implications for asset prices. Naturally, the prospect of armed conflicts with North Korea and/or Iran, or a complete revision of NAFTA, would have tremendous economic impact, but at this stage we do not find reason to be less than sanguine. Accordingly, our allocation of assets among each of the strategies currently reflects an accommodation of risk.

STOCK MARKET OUTLOOK

The benign inflationary environment has been a positive backdrop for equity valuations and our expectations are that it should remain favorable. Though this year’s equity market advances thus far have been stronger than many experts expected,  we remain positive on the outlook for equities over the forecast period absent an exogenous event or a surprising change in inflation expectations. While we recognize that equity pricing, particularly in large caps, remains close to historical highs as measured by traditional valuation metrics of Price/Earnings, Price/Book and Price/Cash Flow, we remain optimistic over the near term. Moreover, we harbor some concerns that equity markets could exhibit a “melt up” over the next 1-2 years as investors who have remained on the sidelines since the beginning of this bull market capitulate and put their excess cash to work, thereby fueling demand for equities and inflating prices further.

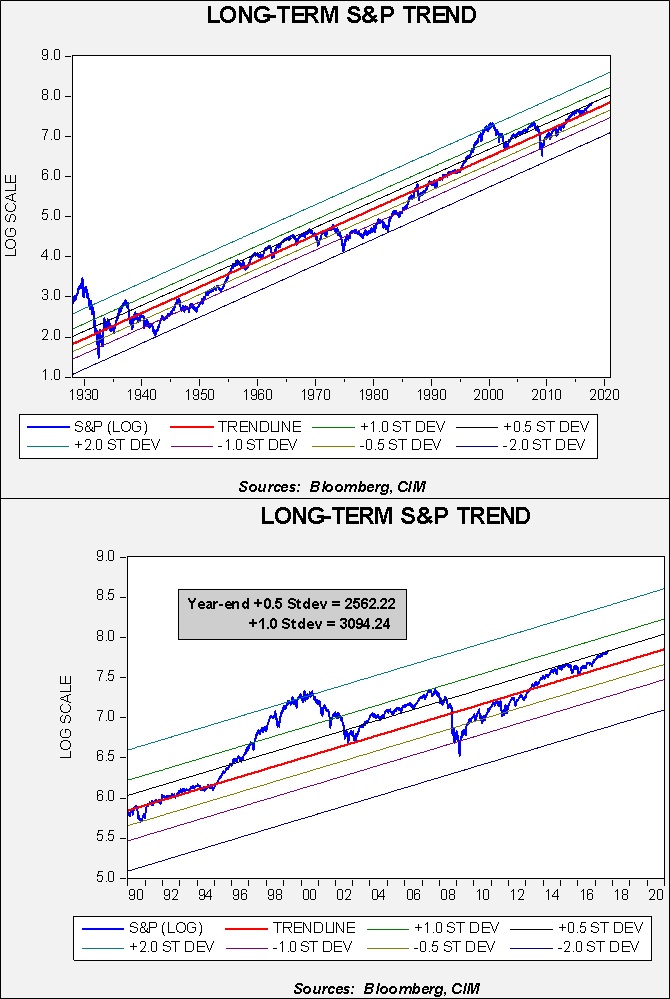
As we recently published in our Asset Allocation Weekly (10/13/17), the parameters surrounding long-term S&P 500 trends remain supportive. Although a recession or geopolitical event would carry consequent risk to equity prices, the regression trend lines on the accompanying charts indicate that the S&P 500 is trading within one-half standard error of the 6% average yearly trend. For context, the top chart displays log-transformed weekly Friday closes of index data since 1929, while the lower chart shows a more recent period beginning in 1990. The same regression trend lines are used on both charts.

The Confluence Asset Allocation Committee recognizes that the U.S. economy is well advanced in terms of the economic cycle. In fact, the end of October will mark the 100th month for the current economic expansion, making this the third longest on record. However, economic conditions and associated market values fail to conform to the rigor of a calendar. We remain cognizant of the length of the expansion and are wary of the potential of a slowdown in economic growth over the forecast period.  Nevertheless, as equity markets continue to advance, the Confluence Cyclical Asset Allocation strategies retain their historically high allocations to equities, inclusive of non-U.S. equities. It should be noted that this quarter’s rebalance further increases non-U.S. equity exposure, owing to the committee’s prevailing view that there is a likelihood of continued softness in the U.S. dollar coupled with favorable non-U.S. equity valuation metrics as compared to U.S. counterparts.

Within U.S. large caps, we favor energy, health care, industrials and materials and underweight telecom, utilities and consumer staples. We maintain a neutral growth/value style bias.

BOND MARKET OUTLOOK

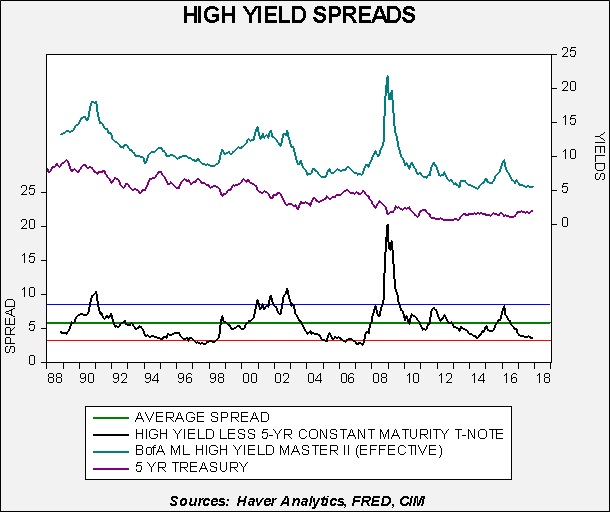
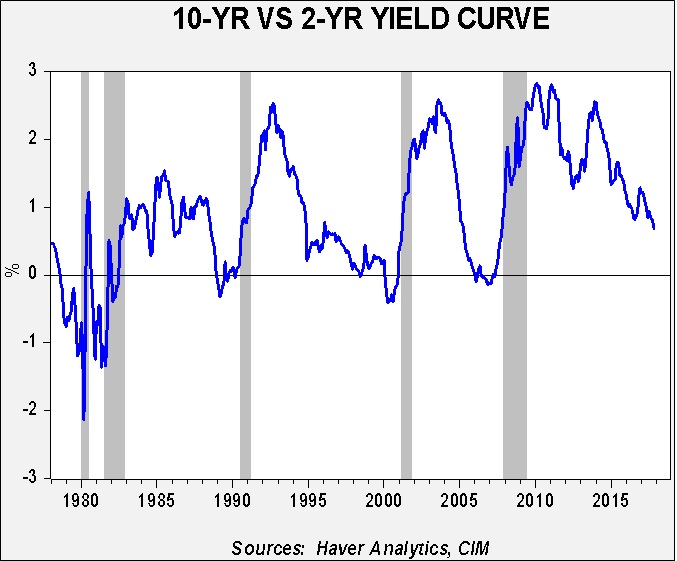
Despite the Fed’s decision to leave the fed funds rate unchanged at its September meeting, the probability for a 0.25% hike in December has increased. Over the forecast period, we envision the terminal rate of fed funds to be between 1.75% and 2.50%, with the differential dependent upon the make-up of the Fed’s Board of Governors and overall economic conditions. Given these expectations, there is the increased likelihood of a continued flattening of the Treasury yield curve due to tighter monetary conditions. Among corporate bonds, spreads for both investment grade and speculative grade bonds versus maturity equivalent Treasuries have tightened to post-recession lows.

Considering current conditions and expectations, we lengthen the overall duration slightly, though with an increase in Treasury exposure and a continued concentration in the intermediate segment of the yield curve. In addition, we decrease the overall exposure to speculative grade bonds, a position we find appropriate given tighter spreads and as the Fed embarks upon normalizing its balance sheet.

OTHER MARKETS

Similar to last quarter, we determined that commodities do not hold near-term appeal. Commodities can be helpful to a diversified portfolio in an environment of faster economic growth and/or a surge in inflation expectations; however, as these conditions remain absent, commodities are not currently represented in the strategies.

View the complete PDF

Weekly Geopolitical Report – North Korea and China: A Difficult History, Part II (October 23, 2017)

by Bill O’Grady

Last week, we examined the Minsaengdan Incident and the onset of the Korean War.  This week, we will discuss the final phase of the Korean War, the ceasefire, the introduction of Juche and the impact of the Cultural Revolution.

The Korean War: The Latter Stages of the War and the Ceasefire
Among the issues that caused tensions between China and Korea was the management of the railroads during the war.  Chinese troops encountered difficulties when using roads to supply their forces.  The roads were not in good shape and their war materials were vulnerable to American air attacks.  Given that most of the rolling stock and crews were Chinese, Chinese Volunteer Army (CVA) Commander Peng Dehuai wanted to gain control over the railroads to deliver war materials.  However, Kim Il-sung didn’t want China to take over North Korea’s rail system for two reasons.  First, the regime was trying to start reconstruction and didn’t want to divert rolling stock for war materials, and second, Kim was offended by the loss of sovereignty.  Nevertheless, China and the U.S.S.R. coerced the North Koreans into giving up control of their railways to China for the duration of the war.

The final indignity the Kim government had to face was the ceasefire determination.  Stalin and Mao wanted to keep the war going.  Both wanted to keep the U.S. occupied with the fighting in Korea as this would reduce America’s ability to defend other parts of the world.  In addition, Mao was receiving military aid from the Soviets and feared that the war’s end would end the flow of aid.  On the other hand, Kim wanted a ceasefire.  His country was being steadily bombed by the U.S. and North Korea couldn’t really begin reconstruction without an end to hostilities.

A second issue involved prisoners of war (POWs).  Chinese troops didn’t aggressively capture POWs.  Their military experience was mostly derived in the Chinese Civil War where they didn’t pursue POWs and they continued that behavior during the Korean War.  On the other hand, the Korean People’s Army (KPA) tried to capture as many prisoners as they could with the idea that they would be used as forced labor for reconstruction.[1]  Thus, the sides couldn’t agree on how to resolve the return of POWs; it wasn’t important for China, but it was critical for the Democratic People’s Republic of Korea (DPRK).

View the full report


[1] Zhihua, S. (2004.) Sino-North Korean Conflict and its Resolution during the Korean War. Cold War International History Project Bulletin, Winter/Spring (Issue 14/15), page 20.