Asset Allocation Weekly (February 8, 2019)

by Asset Allocation Committee

Gold is considered by some to be a commodity, but we treat it as a non-liability-backed currency.  In other words, gold isn’t created because someone makes a loan.  Instead, it is created by mining.  In addition, most commodities are consumed but much of the gold refined through the ages still exists.  In other words, gold may be “lost” but it is rarely consumed.  Even in jewelry, it can return to its bullion state with modest effort.

Instead, gold provides one of the three functions of money.  It is rarely used as a medium of exchange and we don’t price things in ounces of gold, so it isn’t a numeraire.  But, it does act as a store of value.  Thus, gold demand tends to rise during periods of monetary instability.  Monetary instability is partially described as rapid increases in the money supply, currency depreciation and negative real interest rates.  When any of these three events occur, they tend to be supportive for gold prices.  In other words, gold prices tend to react to excessive money growth, dollar weakness and falling real short-term interest rates.

Our gold model uses the central bank balance sheets of the Federal Reserve and the European Central Bank, the two most frequently used currencies for foreign reserves.  We also add the EUR/USD exchange rate as a proxy for the dollar and the real two-year T-note yield.

The model’s current fair value is $1,414, suggesting the current price is undervalued.  We have seen the fair value decline recently.  This is due to the explanatory variables adjusting in a bearish fashion; the Fed’s balance sheet is contracting, short-term real interest rates have increased and the dollar has strengthened.  However, even taking these issues into account, gold prices still appear cheap.  If our expectations of dollar weakness this year come to pass, the fair value for gold will likely rise.  However, given the level of undervaluation, gold should have further upside potential in the coming months.

View the PDF

Weekly Geopolitical Report – What to do with China: Part II (February 4, 2019)

by Bill O’Grady

In Part I of this report, we laid out the two narratives that the U.S. and China are using to frame relations between the two countries.  This week, we will summarize the two positions and examine the potential for war using the historical examples of British policy toward the U.S. and Germany, offering our take on which analogy fits best.  There will be a discussion of current American views on hegemony as well.  As always, we will conclude with market ramifications.

The Views in Conflict
From the U.S. perspective, China’s historic economic expansion has come because it finally shunned Marxism and adopted capitalism.  All that remains now for China to achieve its final leg of development is to become a multi-party democracy and give up the single-party rule of the CPC.

From the Chinese perspective, China’s rise was due to the unity created by the wise rule of the CPC.  Calls for democracy are nothing more than foreigners trying to create divisions within Chinese society for them to exploit and use, like the British did, to constrain and contain China’s development.

View the full report

Asset Allocation Weekly (February 1, 2019)

by Asset Allocation Committee

In our analysis, both small caps and mid-caps are undervalued relative to their large cap cousins.

These charts compare mid-caps and small caps to large cap stocks.  We log-transform the data and use a time trend to scale the transformed indices as well.  The lower line on both charts indicate that small caps and especially mid-caps are deeply underperforming large caps.

Why is this occurring?  One clue is the relative underperformance in the last recession.  Smaller capitalization stocks tend to be more sensitive to the economic cycle.  Thus, monetary policy tightening can raise fears of recession and encourage investors to move to larger companies that would better withstand economic weakness.  Note that both of the smaller capitalization indices underperformed large caps during the slowdown in late 2015 into 2016.  However, when recession was avoided, both recovered strongly.  In addition, both the smaller capitalization groups are mildly inversely correlated to the broad P/E multiple; using the CAPE, a rising multiple tends to benefit large cap stocks more than the smaller caps, although the impact is rather modest.  Since the CAPE has been contracting, this factor should contribute to our expected smaller capitalization rebound.

Thus, given the deep level of undervaluation relative to large caps, we tend to favor both small and mid-caps.  This position assumes that a recession will be avoided over the next year to 18 months.  However, if the economy stumbles into recession, large caps will likely continue to outperform their smaller capitalization brethren.

View the PDF

Weekly Geopolitical Report – What to do with China: Part I (January 28, 2019)

by Bill O’Grady

Graham Allison published a controversial book in 2017 in which he argued that the probability for a major war increases when an established hegemon faces an emerging power that threatens the hegemon’s position.  He used Thucydides, the Greek historian who wrote a history of the war between Sparta and Athens, as his model for superpower competition.[1]

Over the past few years, we have noted steady changes in American views toward China, and vice versa, that will likely lead to superpower competition and the potential for conflict.  In Part I of this report, we will discuss the American and Chinese viewpoints.  In Part II, we will summarize the two positions and examine the potential for war using the historical examples of British policy toward the U.S. and Germany, offering our take on which analogy best fits.  There will be a discussion of current American views on hegemony as well.  As always, we will conclude with market ramifications.

View the full report


[1] Allison, G. (2017). Destined for War: Can America and China Escape Thucydides’s Trap? New York, NY: Houghton Mifflin Harcourt Publishing Company. See also: the Confluence Reading List.

Asset Allocation Weekly (January 25, 2019)

by Asset Allocation Committee

One of the important unknown factors for 2019 is whether slowing global growth will have a negative impact on the U.S. economy.  Or, put another way, can the world lead the U.S. into recession?  For the most part, history suggests the answer is no—the U.S. can bring down the world but the world can’t bring down the U.S.

The upper two lines show the yearly change in U.S. GDP and World ex-U.S. GDP.  The lower line shows the difference.  World and U.S. GDP are positively correlated at the 70% level, suggesting they are sensitive to each other.  Since the U.S. provides the reserve currency it would make sense that a stronger U.S. economy would also support imports from abroad which would foster foreign economic growth.  However, the U.S. doesn’t export as much relative to its size as other nations do, so it follows that stronger U.S. growth would support higher world growth but better growth in the rest of the world wouldn’t necessarily lead to better American growth.

A couple of examples show this pattern.  In the late 1990s, world GDP growth fell sharply while the U.S. was unaffected.  The Asian Economic Crisis and the Russian debt default did not derail the U.S. economy.  In 2005, the U.S. economy began to slump due to the deflating housing bubble.  World growth did hold up into 2008 but eventually succumbed to follow the U.S. into recession.

At the same time, this analysis doesn’t mean policymakers should ignore the world.  In theory, the Federal Reserve’s mandate is full employment and low inflation.  Since these goals can be mutually exclusive at times, the Fed has tended to leave both specifically undefined.  That has changed; the Fed now has a semiformal[1] 2% core PCE goal, which means the full employment goal is even more amorphous.  When asked about the world, Fed officials are usually circumspect but do say they will address the issue if overseas events affect the U.S. economy.  The above research suggests this comment is something of a “fudge”; the world rarely affects the U.S. directly.  But, there are times when the Fed does appear to move policy in light of world events.

A couple of events are notable, where the Fed appeared to have adjusted policy due to global events.  In the early 1980s, the Fed was still managing interest rates by focusing on the money supply.  However, the high level of interest rates led Mexico to default and caused cascading debt crises throughout the region.  The Volcker and Greenspan Feds reacted by cutting interest rates from 11% to 6% and the spread between U.S. and global growth narrowed.  The Greenspan Fed eventually cut rates during the Asian Economic Crisis and the Russian debt default in the late 1990s, although the Long-Term Capital Management debacle contributed to that move.  We also note that the Fed continued to reduce rates into 2004 even though the recession had ended; while weak global growth may have contributed, as we discussed two weeks ago, high equity market volatility probably contributed as well.

If the FOMC is looking for an excuse to ease policy, it could certainly use concerns about global growth affecting the U.S. economy as a reason.  Although we doubt that the weak global economy will bring down American growth, concerns about it could allow the Fed to lower rates and maintain credibility.  So far, we have not seen any indication that this factor is affecting policy, but it would not be a stretch to see the reason pop up in comments and statements from the U.S. central bank to at least justify a sustained pause in rate hikes.

View the PDF


[1] It’s semiformal because Congress hasn’t given the Fed an exact mandate.

Keller Quarterly (January 2019)

Letter to Investors

If you’re like most investors, you’re probably delighted to see 2018 in the rearview mirror.  It was a year in which the stock market began on a euphoric note, in a January that proved to be the last month of a nearly two-year rising market.  Indeed, from February 2016 to late January 2018 the S&P 500 rose 59% (bottom-tick to top), without even so much as a 5% pullback along the way.  It was enough to turn even a confirmed old bear into a frolicking bull.

But after that high on January 26, the market spent the next nine months seesawing back and forth.  There were three corrections of 12%, 9%, and 12 %, respectively, with nice little rallies in between.  One of those rallies lasted six months, travelled 15%, and even took the market to a new high.  As we noted in our October letter, that sort of volatility, though rare in recent years, is actually normal market behavior for those with a multi-decade point of view.  But then came December…

From its intraday high on December 3 to its low on the morning of December 26, the market (basis the S&P 500) fell 16%.  From the September 21 peak, this decline totaled 20%.  This was a much greater than normal sell-off, and caused many investors (perhaps you) to wonder if a recession was upon us.  Many conversations with both advisors and clients indicated to us that is exactly what many were worried about; in particular, many were (and, perhaps, still are) worried about a return to 2008.  Is that likely?

In our opinion, no.  Not only do we not see a recession on the near-term horizon, whatever its character, but it most likely will not look anything like 2008.  That recession was triggered by a national decline in residential real estate prices, preceded by record household debt levels (as a percentage of income), and exacerbated by a lack of liquidity (i.e., cash) throughout the economy and financial system.  What’s the situation today?  Real estate prices are declining in several previously “hot” markets, but that’s not unusual and it’s certainly not a national problem.  (Come to St. Louis!)  Household debt as a percentage of disposable income is down more than 20% from its 2008 peak, and cash is “stacked high” as banks, corporations, and households hold large quantities of cash.

This state of affairs does not mean a recession is impossible, just that it’s most unlikely that a 2008-style liquidity crisis is upon us.  The next recession will more than likely be similar to those of 1991 and 2002, when prior bad investments went sour on a broad scale (commercial real estate in the former, telecom/internet investment in the latter).  These recessions hurt wealthy investors, but did not produce injury to average Americans on the scale of 2008-09.  We worry about recessions (a lot!), but we really don’t see one in 2019.

As noted above, the sharp sell-off last month was unusual.  In fact, it’s the only 20% sell-off of the S&P 500 in the absence of a recession since 1987.  That was some year!  In the space of two months, the market dropped 36%; in five days it dropped 31%.  It dropped 20% in one day!  What do I remember most about that sell-off (besides the knot in my stomach)?  It was one of the best buying opportunities of my lifetime.  Sharp, steep, emotion-laden sell-offs in the absence of recessions typically produce outstanding opportunities to buy high-quality, long-term investments at quite reasonable prices, which happens to be what we at Confluence enjoy doing most.  It’s emotionally difficult to be a buyer in the face of such fear, but, historically, it’s the smart thing to do.

We appreciate your confidence in us.


Gratefully,

Mark A. Keller, CFA
CEO and Chief Investment Officer

View the PDF

Asset Allocation Weekly (January 18, 2019)

by Asset Allocation Committee

Equity markets struggled in 2018; although new highs were achieved twice during the year, volatility was elevated compared to 2017.

This is a chart of the CBOE VIX index, a measure of implied volatility from the equity options market.  An elevated VIX means implied volatility is high, which implies a wider dispersion of expected outcomes for future equity index outcomes.  As fear rises, it would make sense for investors to react.  As the chart shows, for most of 2017, the VIX ranged between 10 and 15.  Last year, the range was significantly wider.   As fear rose, investors reacted by accumulating higher levels of cash.

This chart shows the weekly close for the S&P 500 along with the level of retail money market funds.  We have highlighted the 2007-09 recession in gray.  The tan areas show periods when the level of money market funds fell below $920 bn.  In this bull market, we have tended to see the upside momentum wane once money market funds fell below the aforementioned level.  In other words, the market ran out of “dry powder.”

What is occurring now is completely different.  Money market levels are nearly $1.2 trillion.  They are rising in a manner closely resembling what we observed before the Great Recession.  It appears that the level and rise of money market funds is consistent with the financial markets’ expectations of a recession.  If a recession is avoided—if the trade conflict with China cools and the FOMC avoids overtightening—then odds likely favor a recovery in equities.  The retail money market data suggests there is ample liquidity to support a significant rally.  Of course, not all those money market funds will necessarily move back to equities.  Given higher interest rates, some of it could stay in money markets.  But, the key point is that financial markets appear to be in recession mode now.  If recession is avoided in 2019, as we expect, the odds of a significant rally in equities is likely.

View the PDF

Asset Allocation Quarterly (First Quarter 2019)

  • Our expectations are that the U.S. economy will continue to grow, albeit at a more modest pace of 2.7%
  • While we anticipate the current economic expansion will become the longest on record this March, the risk of a downturn rises toward the end of our three-year forecast period
  • We expect the Fed to suspend its recent string of rate increases and even pause its efforts to shrink its balance sheet
  • Though unemployment remains low, the employment/population ratio indicates continued slack in the labor force, thereby blunting the full impact of wage growth on inflation
  • We retain the high relative weightings to equities given economic health and expectations for continued GDP growth. However, our style guidance has shifted to 50/50 growth/value.
  • We eliminate exposures to equities outside the U.S. due to our expectations for a slowdown in global growth and difficulties in particular domiciles, notably continental Europe and the U.K.

View the complete PDF

ECONOMIC VIEWPOINTS

Despite sentiment indicators ticking down slightly over the past month, the U.S. economy continues to expand. A continuation of this expansion through March will lead it to become the longest on record. Though one often hears that the U.S. economy is in the latter innings of its growth cycle, which stretches back to June 2009, we believe the economy will grow into extra innings. The growth trajectory, however, should become more muted, with our forecast at 2.7% GDP growth for 2019.

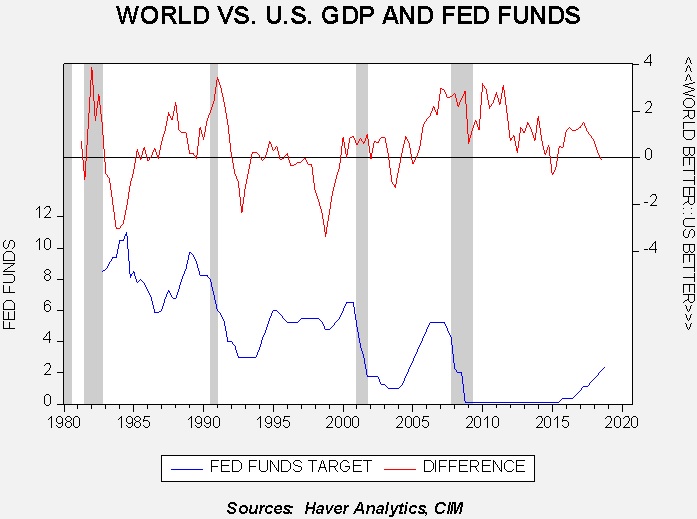
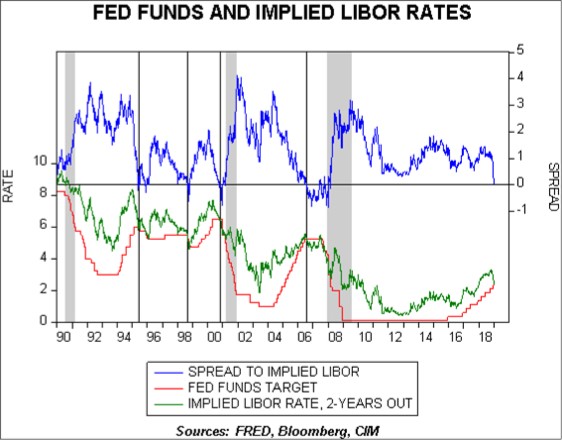
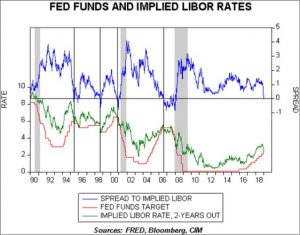
Underpinning our forecast is not simply sentiment and growth, but our belief that the Fed will suspend its vector of raising the fed funds rate as well as its aggressive reduction of its balance sheet. Regarding the former, as the accompanying chart displays, the spread between two-year forward LIBOR and the fed funds target rate tightened dramatically over the past month. This chart illustrates the reason that recent rhetoric from members of the FOMC has been markedly dovish. Relative to the balance sheet, since October the Fed has been shrinking its holdings by $50 billion each month, or at an annual rate of $600 billion. While we think they will allow the $385 billion maturing in 2019 and the $284 billion in 2020 to roll off, we don’t anticipate outright sales of securities from their portfolio. In addition, we expect they will reinvest prepayments on their agency mortgage-backed securities holdings back into the long end of their portfolio, principally in agency mortgage-backed securities. The potential for a hiatus on tightening by the Fed could conceivably be extended through the 2020 election season.

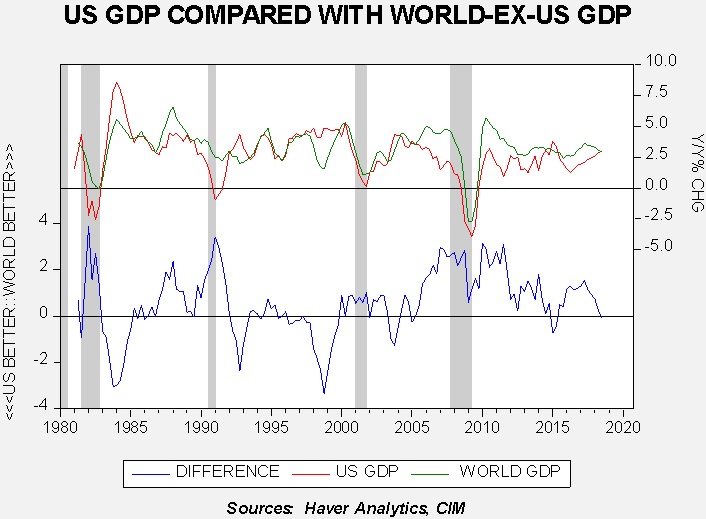
Worldwide, we are forecasting reduced global growth, especially in light of expected tightening by the European Central Bank and the Bank of Japan toward the back half of the year, as well as a slowing of growth rates from China and economic challenges facing Britain and continental Europe. Although we expect weakness in the U.S. dollar relative to other major currencies, which would be beneficial for U.S.-based investors, the challenges and diminished growth offset near-term advantages of exposure to non-U.S. equities.

STOCK MARKET OUTLOOK

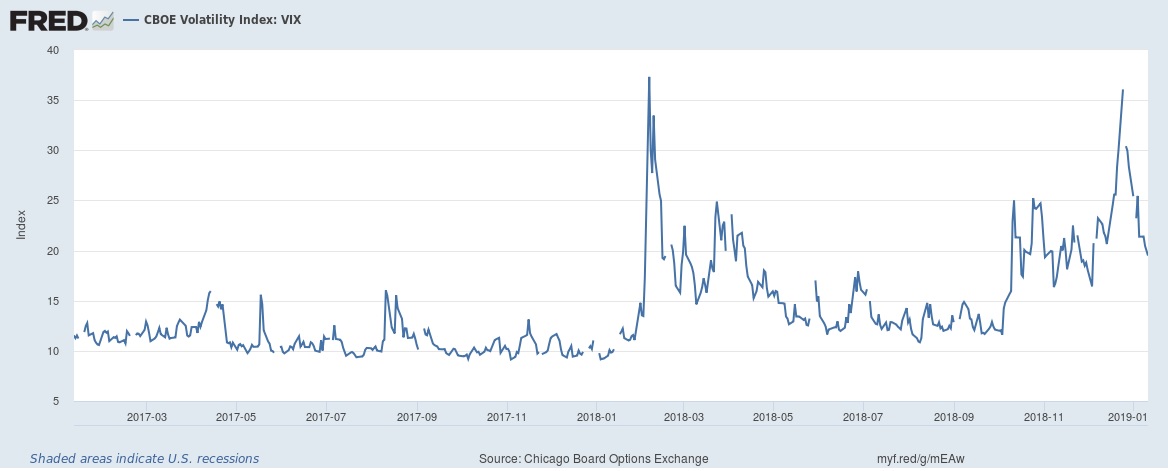
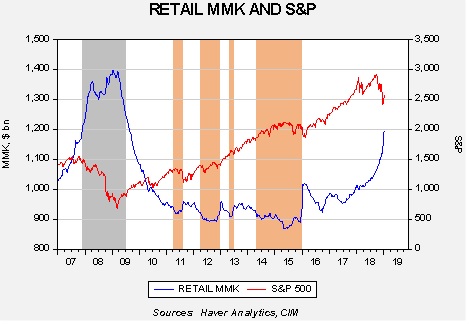
While the growth in profitability for U.S. corporations will slow relative to last year’s torrid pace stemming from corporate tax reform, growth will nevertheless be positive. Confluence’s estimate for S&P earnings in 2019 is $160.93, representing a 4.2% increase over our estimate for the full year of 2018.[1] The most significant influence will be market sentiment as reflected in the price to earnings [P/E] ratio. The equity market correction in the fourth quarter of 2018 caused the trailing P/E on the S&P 500 to decline to 17.2x by the end of the year. Our base case, given the Fed’s posture and the prospect for market sentiment to improve, is a rebound to a P/E of 18.6x. The spike in retail money market balances to over $1.15 trillion provides further buying potential for equities among retail investors, buoying our favorable outlook.

Regarding style and sectors, our former tilt to growth that existed for nearly two years has been brought back to an equal split between growth and value. This is due principally to our more muted forecast for GDP growth and complemented by the relatively extreme valuation differentials between growth and value equities. As an example, based upon year-end 2018 prices, the P/E for the S&P 500 Value Index stood at 13.5x as compared to the 22.3x for the S&P 500 Growth Index. Similarly, the price-to-book [P/B] ratio was 2.0x for value versus 4.6x for growth. While the sizable valuation differential can persist for an extended period, especially as markets advance, we find it prudent to eliminate the overweight to growth. Among sectors, we retain the prior overweights to Energy and Materials, while the former overweight to Financials is replaced by an overweight to Healthcare.

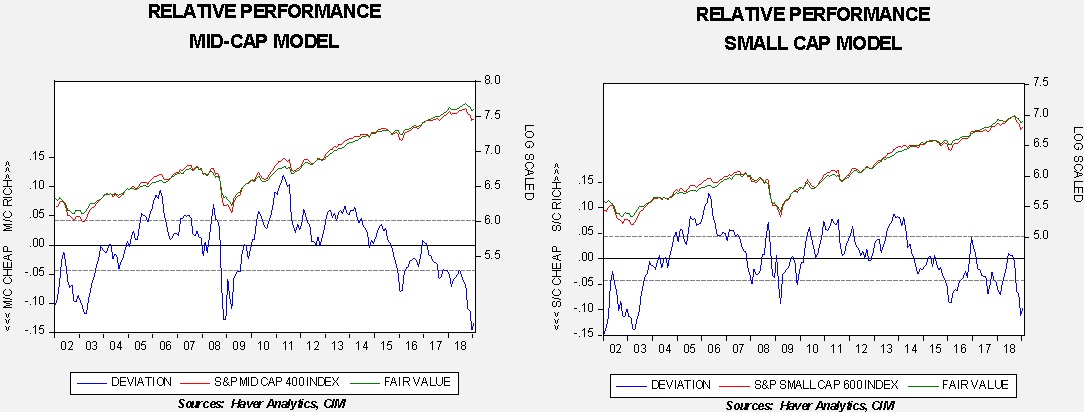
Among capitalizations, our bias is an overweight to both mid-caps and small caps due to more attractive traditional fundamental valuation measures of P/E and P/B. Moreover, the IRS’s finalization of rules announced on 12/18/2018 regarding repatriation of foreign earnings of foreign subsidiaries of U.S. companies should prove beneficial for prices of companies classified as mid-cap and small cap as well as in the lower strata of large cap, by virtue of increased M&A activity. Accordingly, all of our asset allocation portfolios have historically high levels of equity exposure and in the portfolios where it is risk appropriate we include express overweights to mid-cap and small cap equities.

In contrast to our sanguine view of U.S. equities, we find that the risks outweigh the potential for non-U.S. equities. Though comparative valuations are attractive, the expectations for a slowdown in global growth combined with complications stemming from the EU and Britain lead us to a cautious near-term stance. Brexit, Italy’s budget plans, a new head of the ECB, a new German Chancellor and elections in the European Parliament conspire to make us cautious on overseas exposure. While a weaker U.S. dollar would be a tailwind for U.S.-based investors, we are more comfortable avoiding non-U.S. equities for at least the first portion of the year.

[1] The earnings estimates are based on Standard & Poor’s methodology for determining S&P earnings, which differs from Thompson/Reuters I/B/E/S by 7%.

BOND MARKET OUTLOOK

Our premise for the Fed’s suspension of tightening for a period of time, perhaps stretching through the 2020 election cycle, naturally leads to the expectation that short rates will be anchored. What is murky is the continuation of the global appetite for yield, the initiation and pace of tightening by the ECB and BOJ and their potential effects on U.S. rates, and the domestic inflation outlook, especially with a more dovish Fed. Adding to this murkiness is the effect upon corporate spreads of $3 trillion of corporate debt maturing before 2022, coupled with the change in interest expense deductibility in 2022 from 30% of EBITDA to 30% EBIT. Given the uncertainties for the intermediate and long segments of the Treasury and corporate curves, we retain the laddered bond positioning we introduced a year ago. In addition, exposure to speculative grade bonds remains at historically low levels in the portfolios despite the sizable widening of spreads over the last quarter. Although speculative bonds are more attractively valued than they were three months ago, we are cautious about embedded risk.

OTHER MARKETS

We maintain the allocation to REITs in the more income-oriented portfolio due to attractive and improving dividend yields and the diversified income stream they afford. Relative to speculative bonds, we find the potential risk/reward to be superior in REITs.

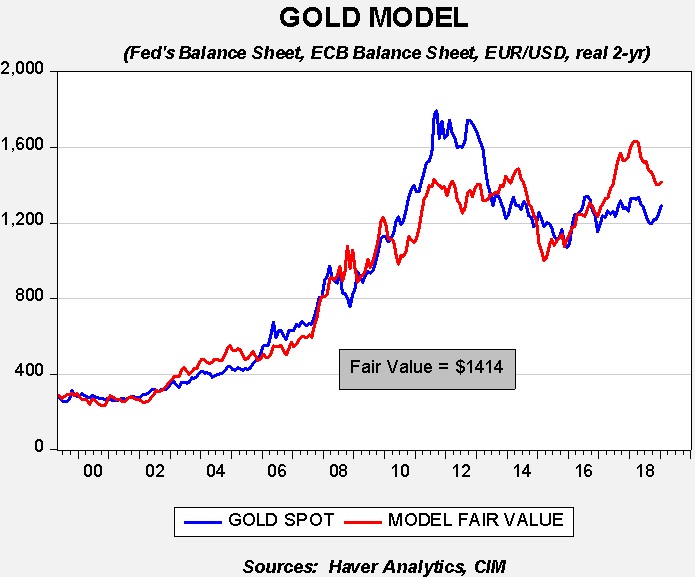
We also retain the modest allocation to gold owing to the combination of its ability to offer a hedge against geopolitical risk and the safe haven it can afford during an uncertain climate for the U.S. dollar.

View the complete PDF

Weekly Geopolitical Report – Reflections on Inflections: Part II (January 14, 2019)

by Bill O’Grady

(N.B. Due to Martin Luther King Jr. Day, the next issue of this report will be published on January 28.)

In Part I of this report, we discussed the issues surrounding predicting inflection points, which are defined as reversals of long-term trends.  In this week’s issue, we will examine two long-term trends that we believe are approaching inflection points and offer guideposts that we think will signal further progress toward inflection.  For regular readers, these two trends should sound familiar as they are topics of frequent discussion.  Some often consider them the same issue, while, in reality, they are separate but affect each other.  By discussing them separately, this confusion should be laid to rest.  As is our normal practice, we will offer market ramifications.  Since an inflection of these two points is significant, this section will be larger than usual.

Inflection Point #1: The End of U.S. Hegemony

Inflection Point #2: The Efficiency Cycle Ends and Equality Cycle Commences

View the full report