

Asset Allocation Weekly (January 18, 2019)
by Asset Allocation Committee
Equity markets struggled in 2018; although new highs were achieved twice during the year, volatility was elevated compared to 2017.
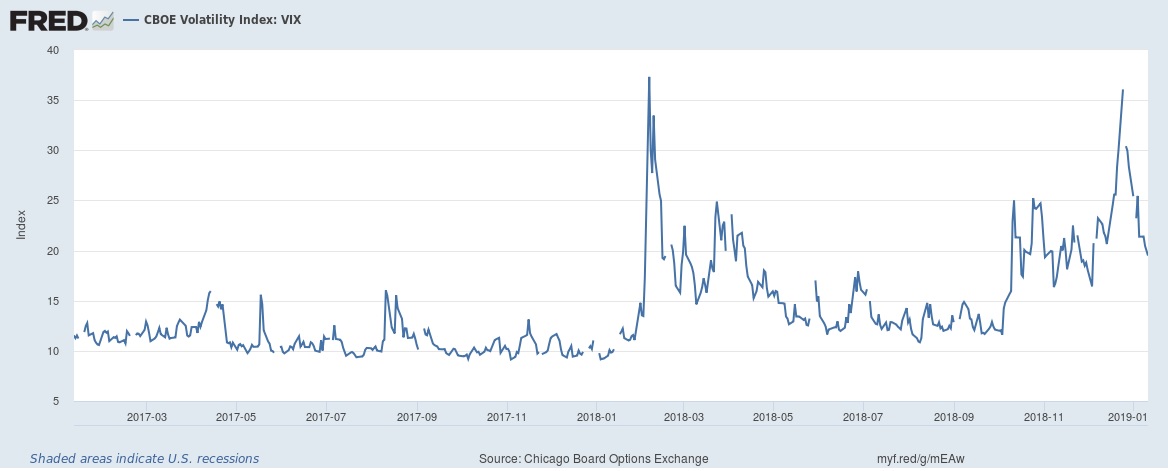
This is a chart of the CBOE VIX index, a measure of implied volatility from the equity options market. An elevated VIX means implied volatility is high, which implies a wider dispersion of expected outcomes for future equity index outcomes. As fear rises, it would make sense for investors to react. As the chart shows, for most of 2017, the VIX ranged between 10 and 15. Last year, the range was significantly wider. As fear rose, investors reacted by accumulating higher levels of cash.
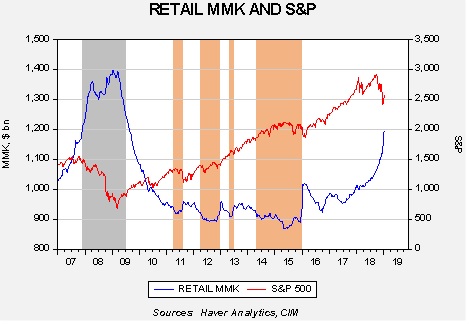
This chart shows the weekly close for the S&P 500 along with the level of retail money market funds. We have highlighted the 2007-09 recession in gray. The tan areas show periods when the level of money market funds fell below $920 bn. In this bull market, we have tended to see the upside momentum wane once money market funds fell below the aforementioned level. In other words, the market ran out of “dry powder.”
What is occurring now is completely different. Money market levels are nearly $1.2 trillion. They are rising in a manner closely resembling what we observed before the Great Recession. It appears that the level and rise of money market funds is consistent with the financial markets’ expectations of a recession. If a recession is avoided—if the trade conflict with China cools and the FOMC avoids overtightening—then odds likely favor a recovery in equities. The retail money market data suggests there is ample liquidity to support a significant rally. Of course, not all those money market funds will necessarily move back to equities. Given higher interest rates, some of it could stay in money markets. But, the key point is that financial markets appear to be in recession mode now. If recession is avoided in 2019, as we expect, the odds of a significant rally in equities is likely.