

Asset Allocation Weekly (February 1, 2019)
by Asset Allocation Committee
In our analysis, both small caps and mid-caps are undervalued relative to their large cap cousins.
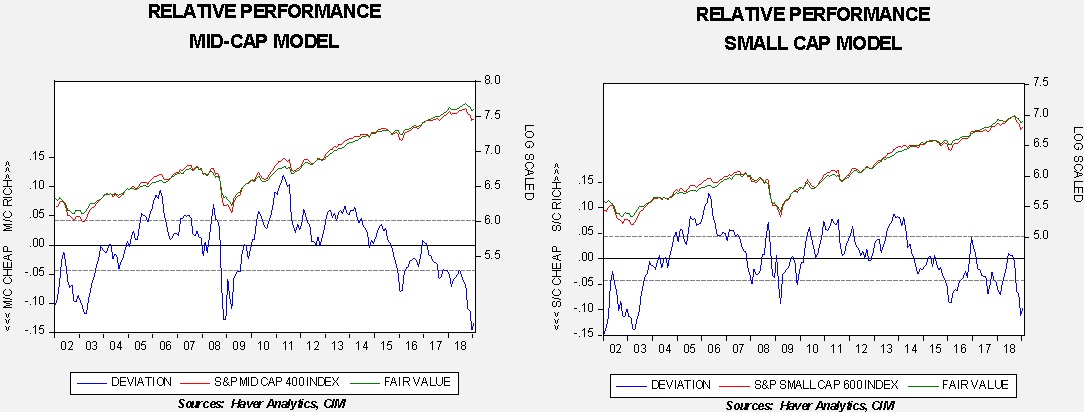
These charts compare mid-caps and small caps to large cap stocks. We log-transform the data and use a time trend to scale the transformed indices as well. The lower line on both charts indicate that small caps and especially mid-caps are deeply underperforming large caps.
Why is this occurring? One clue is the relative underperformance in the last recession. Smaller capitalization stocks tend to be more sensitive to the economic cycle. Thus, monetary policy tightening can raise fears of recession and encourage investors to move to larger companies that would better withstand economic weakness. Note that both of the smaller capitalization indices underperformed large caps during the slowdown in late 2015 into 2016. However, when recession was avoided, both recovered strongly. In addition, both the smaller capitalization groups are mildly inversely correlated to the broad P/E multiple; using the CAPE, a rising multiple tends to benefit large cap stocks more than the smaller caps, although the impact is rather modest. Since the CAPE has been contracting, this factor should contribute to our expected smaller capitalization rebound.
Thus, given the deep level of undervaluation relative to large caps, we tend to favor both small and mid-caps. This position assumes that a recession will be avoided over the next year to 18 months. However, if the economy stumbles into recession, large caps will likely continue to outperform their smaller capitalization brethren.