Asset Allocation Weekly (December 13, 2019)

by Asset Allocation Committee

The recent employment report was very strong, with payroll growth rising more than forecast and the unemployment rate declining more than expected.  One uncertainty that develops when labor markets tighten is the point at which wage growth begins to lift inflation.

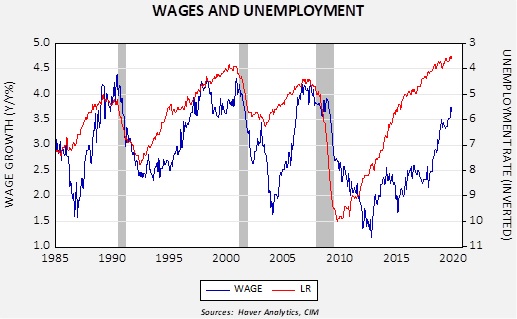
This chart shows yearly wage growth and the unemployment rate (inverted scale).  In the past three cycles, an unemployment rate at this level would have been consistent with wage growth in excess of 4.0%.  Although wages have been increasing, the growth rate remains below the 4.0% level.

The reason wage growth remains modest is complicated, but a contributing factor is that the labor force continues to increase.  A key function in that process has been that citizens who were not part of the labor force have been steadily finding jobs.  The chart below shows the 12-month rolling total of those who have been out of the labor force and found employment.  This number has been increasing in this expansion.

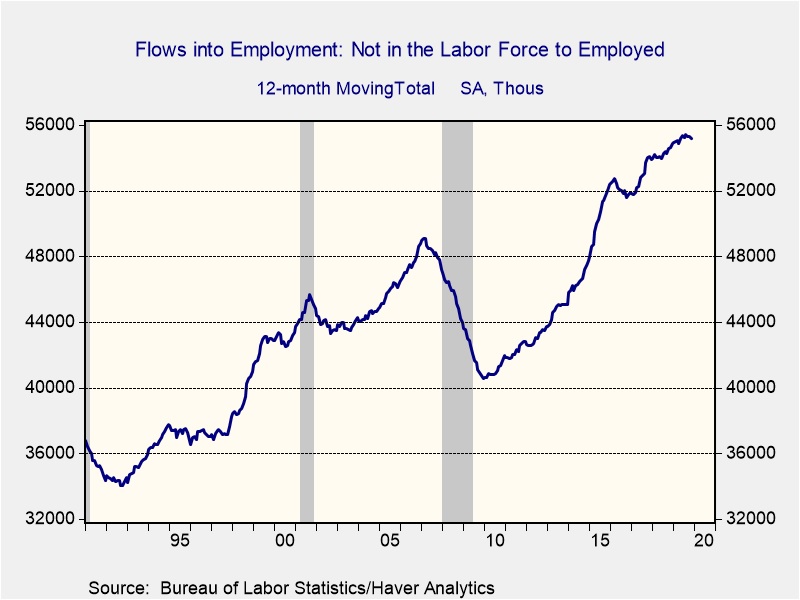
At the same time, the pace of these flows is beginning to slow.  If this source of new employees declines, in theory, it would tend to lift wages at an increasing pace until employment growth slows.  Nevertheless, for now, the labor market appears to be strong enough to attract new entrants into the labor force and employment, without excessive wage growth, which is a positive development for the economy.

View the PDF

Weekly Geopolitical Report – Ukraine Under Zelensky (December 9, 2019)

by Patrick Fearon-Hernandez, CFA

Because of the congressional impeachment inquiry into President Trump, people are hearing a lot about Ukraine and its new president, Volodymyr Zelensky.  However, it’s important to remember that Ukraine and its new leader are significant in their own right.  Russia has been keeping Ukraine under intense geopolitical pressure for the last five years, seizing part of its territory and supporting ethnic Russian separatists in the country’s east.  These developments have created an important test of the world’s resolve in maintaining geopolitical order.  They have also created a test for Ukraine’s ability to reform and strengthen itself.

In this week’s report, we’ll review the history of Ukraine since its independence from the Soviet Union in 1991, and we’ll discuss the challenges President Zelensky faces in terms of national security and sovereignty, domestic corruption and the rule of law, and economic reform.  As always, we’ll end with a discussion of the implications for investors.

View the full report

Asset Allocation Weekly (December 6, 2019)

by Asset Allocation Committee

In 2017, we introduced an indicator of the basic health of the economy and added it to the many charts we monitor to gauge market conditions.  The indicator is constructed using commodity prices, initial claims and consumer confidence.  The thesis behind this indicator is that these three components should offer a simple and clear picture of the economy; in other words, rising initial claims coupled with falling commodity prices and consumer confidence is a warning that a downturn may be imminent.  The opposite condition should support further economic recovery.  In this report, we will update the indicator with November data.

This chart shows the results of the indicator and the S&P 500 since 1995.  The updated chart shows that the upward momentum in the economy slowed last year but it does remain well above zero.  We have placed vertical lines at certain points when the indicator fell below zero.  It works fairly well as a signal that equities are turning lower, but there is a lag.  In other words, by the time this indicator suggests the economy is in trouble, either the recession is imminent or we are already in a downturn and the equity markets have started their decline.

To make the indicator more sensitive, we took the 18-month change and put the signal threshold at minus 1.0.  This provides an earlier bearish signal and also eliminates the false positives that the zero threshold generates.  Nevertheless, the fact that this variation of the indicator is below zero raises caution.

What does the indicator say now?  The economy has decelerated but is not yet at a point where investors should become overly defensive.  At the same time, the 18-month change in the indicator has fallen below zero; in 2016, this situation led to several months of sideways market activity.  If we continue to see the lower chart hover around zero, then the likelihood is greater that equities will flatten.  Thus, reducing equity risk by rebalancing for a more defensive equity sector exposure would be prudent.

View the PDF

Weekly Geopolitical Report – Lebanon and its “Revolution of the Millennials” (December 2, 2019)

by Patrick Fearon-Hernandez, CFA

Working at NATO Headquarters in Brussels in the 1990s was a diverse experience: my coworker was Belgian, my boss was British, his boss was French and our secretary was Turkish.  But what felt especially exotic were my weekends in eastern Belgium, on the Dutch border, with my Turkish, Egyptian and Lebanese friends.  Many nights were spent in the clubs of Liège, Leuven and Maastricht!  I wonder how much hearing I lost to the throbbing beat of Eurotech and World Pop.  There I got my first taste of flamenco-rock and the intoxicating, wavering Arabic stars like Lebanon’s Haifa Wehbe.  It felt like I was reliving Beirut in its heyday.

But that Beirut was already gone, destroyed by Lebanon’s 1975-1990 civil war.  My Lebanese friends were refugees who might never go home.  Although a fragile peace may have been put into place, the country was not healed.  And now, throughout the autumn of 2019, mass political protests have paralyzed the country and highlighted its continuing problems.  In this report, we’ll explain what’s behind the turmoil and why it may continue.  As always, we’ll conclude with the ramifications for investors.

View the full report

Business Cycle Report (November 27, 2019)

by Thomas Wash

The business cycle has a major impact on financial markets; recessions usually accompany bear markets in equities.  We have created this report to keep our readers apprised of the potential for recession, which we plan to update on a monthly basis.  Although it isn’t the final word on our views about recession, it is part of our process in signaling the potential for a downturn.

In October, Q3 earnings came in stronger than expected, the Federal Reserve cut rates for a third time this year and the U.S. and China continued to negotiate what is being called a “phase-one” trade deal. Meanwhile, the manufacturing sector continued to show signs of weakness and consumer confidence slowed. Currently, our diffusion index shows that seven out of 11 indicators are in expansion territory, with several indicators approaching negative territory. The index for October fell 60 bps from +0.575 in the prior month to +0.515.

The chart above shows the Confluence Diffusion Index. It uses a three-month moving average of 11 leading indicators to track the state of the business cycle. The red line signals when the business cycle is headed toward a contraction, while the blue line signals when the business cycle is headed toward a recovery. On average, the diffusion index is currently providing about six months of lead time for a contraction and five months of lead time for a recovery. Continue reading for a more in-depth understanding of how the indicators are performing and refer to our Glossary of Charts at the back of this report for a description of each chart and what it measures. A chart title listed in red designates that indicator is signaling recession.

View the complete PDF

Asset Allocation Weekly (November 22, 2019)

by Asset Allocation Committee

(NB: Due to the Thanksgiving holiday, the next report will be published on December 6.)

The health of the consumer is critical to the future path of economic growth.  For the most part, consumption is accounting for most of the growth in the economy.

This chart shows the four-quarter average of the contribution to real GDP from consumption compared to the net of the contribution from government, investment and net exports.  Over recent business cycles, the contribution outside of consumption has diminished.  The other sign from the data is that the risk of recession rises when consumption’s contribution declines below 2%.

Household debt plays a role in consumption.  The New York FRB has a data series on consumer debt that has just been recently updated.  The balance of household debt is now $13.95 trillion, a new record high.  However, on a per capita basis, we remain below the previous record.

From its peak of $53.0k in Q3 2008, this measure of debt declined to $44.5k in Q3 2013.  Since then, it has gradually increased.  However, it has not reached levels that would trigger significant concern.  In the last expansion, per capita debt growth was 10.9%; in this expansion the average growth is -0.4%.

As a percentage of the total, housing debt has been declining relative to auto and student loans.

In 2012, housing represented about 76.9% of outstanding household loans; it now stands at 70.5%.  Both student and auto loans have increased.  The median credit score for mortgages is a rather strong 763.

Auto loans is a bit lower, at 710, but credit quality has been improving, mostly a reflection of higher delinquencies.  Lenders appear to be increasing their caution.

Overall, the data suggests that the areas of greatest concern are auto and student loans; lenders do appear to be addressing the auto loan issue by becoming more selective in granting credit.  Student loans, which have a 90+-day delinquency rate of around 10% since 2012, are ultimately a public policy issue, but until this issue is resolved these loans will have an adverse impact on spending.  If there is going to be a financial crisis, this data would suggest it probably won’t come from the household sector.

View the PDF

Weekly Geopolitical Report – Thirty Years Since the Fall of the Berlin Wall: A Retrospective, Part II (November 18, 2019)

by Bill O’Grady

(Due to the Thanksgiving holiday, the next report will be published on Dec. 2.)

In Part I of this report, we presented the first two of four ideas about the post-Cold War era and how well they fared.  This week, we will cover the remaining two ideas and conclude with market ramifications.

Idea #3: The German Problem
Modern Germany sits in the center of Europe.  It has few natural barriers, meaning it is nearly perfect for commerce and impossible to defend.  The country was formed in the wake of the Franco-Prussian War of 1870.  Germany was fashioned by Prussian leaders coalescing other independent regions in the area that were formerly part of the Holy Roman Empire.  The decision to create a nation was due, in part, to prevent another military power from conquering the various principalities as Napoleon did and to take full advantage of the industrial revolution.

View the full report

Asset Allocation Weekly (November 15, 2019)

by Asset Allocation Committee

The yield curve has steepened since the FOMC started cutting rates, raising hope that a recession can be avoided.  In this report, we will examine whether these hopes make sense.

The above chart shows two recession indicators from two different regional Federal Reserve banks, Atlanta and New York.  The former is a GDP-based indicator and the latter is based on the yield curve.  The New York indicator is designed to signal economic activity a year into the future.  We like to combine the two indicators because the Atlanta indicator tends to give false positives.  However, in the past, when the New York indicator has moved above 30 followed by an Atlanta indicator rising above 40, a recession has been unavoidable.

Fed funds show us that easing doesn’t necessarily protect the economy from a downturn.  Even though the FOMC has usually cut rates as the New York FRB indicator penetrated 30, it was not enough to fend off a downturn.  Thus, even with the recent rate cuts, the risk of recession remains elevated.

The good news is that the Atlanta indicator is at a level where a recession isn’t imminent.  The bad news is that the New York indicator has signaled a downturn is coming.  Since the 1969-70 recession, the average lead time from the New York recession indicator has been 10 months, with a range of five to 15 months.  Thus, by next spring, we could see evidence of a downturn.  However, if we use the Atlanta indicator as a signal-confirming device, we should have a better idea of when a recession is actually underway.  So, for now, investors should not become overly cautious but, by the end of Q1, increased vigilance will likely be warranted.

View the PDF