Weekly Energy Update (March 5, 2020)

by Bill O’Grady, Thomas Wash, and Patrick Fearon-Hernandez, CFA

Crude oil inventories rose 0.8 mb compared to the forecast rise of 3.0 mb.

In the details, U.S. crude oil production rose 0.1 mbpd to a new record of 13.1 mbpd.  Exports rose 0.5 mbpd, while imports were unchanged.  The inventory build was less than forecast due to rising exports and steady imports.

(Sources: DOE, CIM)

This chart shows the annual seasonal pattern for crude oil inventories.  This week’s report was less than the usual seasonal patterns, and the gap between the normal pace of inventory accumulation and the actual widened modestly.

Based on our oil inventory/price model, fair value is $59.19; using the euro/price model, fair value is $46.44.  The combined model, a broader analysis of the oil price, generates a fair value of $50.08.  Oil prices have stabilized this week.  OPEC has reportedly agreed to a 1.5 mbpd production cut; it is unclear if Russia is participating.  This decision comes not a moment too soon as we are hearing reports that tankers are being used for floating storage, a clear sign of oversupply.

View the PDF

Weekly Geopolitical Report – Investment Implications of Changing Demographics: Part III (March 2, 2020)

by Patrick Fearon-Hernandez, CFA

In Part I of this report, we looked at current key global population trends.  The report discussed how plunging birth rates have been weighing on population growth and boosting average ages all over the world, with a potentially huge impact on the distribution of geopolitical power, economic prospects and future investment returns.  In Part II, we showed how these demographic trends are playing out for the world’s sole superpower and most important economy: the United States.

This week, in the final segment of this report, we’ll dive deeper into the economic implications of slowing population growth and an aging population.  Our analysis will show that these demographic trends are likely to weigh heavily on future economic growth and inflation.  The trends may well impact standards of living and constrain monetary and fiscal policy in important ways.  We’ll conclude with a discussion of the long-term ramifications for investors, although it’s important to remember that many other forces can have a greater impact on investment returns in the short term.

View the full report

Asset Allocation Weekly (February 28, 2020)

by Asset Allocation Committee

Since the end of the Financial Crisis, there has been a steady deterioration in investment-grade credit quality.

This chart shows the percentage of investment-grade bonds rated at BBB.  Since late 2018, this portion has represented half of outstanding investment-grade credit.  This rating is the lowest end of investment-grade credit, so the dominance of this segment raises questions about the stability of these corporate bonds under deteriorating financial conditions.

History tends to show that monetary policy has the most significant impact on the percentage of BBB debt.

A rising policy rate between 2004 into 2006 coincided with a sizeable decline in the percentage of BBB-rated debt in the investment-grade category.  Low rates since 2008 led to a steady rise in the percentage of BBB-rated debt.  Most notably, the policy tightening from 2016 into last year did not slow the rise, suggesting investors did not believe that monetary policy would lead to concerns about credit quality.

This data suggests a couple of issues.  First, the current high level of low-rated debt in investment-grade is a concern if the economy weakens or policymakers overtighten.  Second, investors appear confident that neither outcome is likely in the short run and, if anything, the FOMC will react quickly to protect the economy from trouble.  The risk, of course, is that either this confidence is misplaced or a circumstance will develop to which no amount of policy stimulus can prevent credit deterioration.

In response to this deterioration of credit quality, we have reduced our overall exposure to investment-grade credit in our allocations to fixed income.  However, we remain overweight to investment-grade, in part, due to expectations that a recession or a credit event isn’t imminent.

View the PDF

Business Cycle Report (February 27, 2020)

by Thomas Wash

The business cycle has a major impact on financial markets; recessions usually accompany bear markets in equities.  We have created this report to keep our readers apprised of the potential for recession, which we plan to update on a monthly basis.  Although it isn’t the final word on our views about recession, it is part of our process in signaling the potential for a downturn.

January saw broad improvement in the economic data. The signing of the “Phase One” trade deal offered reassurance that the impact of the trade war would be limited in 2020. Several sentiment indicators surged, likely in response to the development. The NFIB Small Business Optimism Index, Chicago National Activity Index, Philly Manufacturing Outlook and Consumer Confidence, which is featured in the diffusion index, all improved during the month. In addition, financial markets offered mixed signals about the resiliency of the economic expansion due to growing uncertainty about the global economy. Conflict between the U.S. and Iran following the death of Qassem Soleimani and the COVID-19 outbreak in China reignited fears of the U.S. economy’s exposure to geopolitical risks. As a result, there was a slight deterioration in the gains made in equities and flattening along certain areas of the yield curve. Nevertheless, positive gains in employment and improvement in manufacturing activity suggests the economy remains strong. Our diffusion index has improved from the previous month with nine out of 11 indicators in expansion territory. The reading for January rose to +0.636 from +0.576.

The chart above shows the Confluence Diffusion Index. It uses a three-month moving average of 11 leading indicators to track the state of the business cycle. The red line signals when the business cycle is headed toward a contraction, while the blue line signals when the business cycle is headed toward a recovery. On average, the diffusion index is currently providing about six months of lead time for a contraction and five months of lead time for a recovery. Continue reading for a more in-depth understanding of how the indicators are performing and refer to our Glossary of Charts at the back of this report for a description of each chart and what it measures. A chart title listed in red indicates that indicator is signaling recession.

View the complete PDF

Weekly Geopolitical Report – Investment Implications of Changing Demographics: Part II (February 24, 2020)

by Patrick Fearon-Hernandez, CFA

In Part I of this report, we looked at current key global population trends.  The report showed how plunging birth rates have been weighing on population growth and boosting average ages all over the world, potentially having a huge impact on the distribution of geopolitical power, economic prospects and future investment returns.  An important countertrend is that urbanization is accelerating, with city populations growing relatively faster while rural populations stagnate or decline.  Part I noted that stronger innovation and productivity could help offset the negative impact of slowing population growth and population aging, but the world’s education systems are not rising to the occasion so far.

This week, in Part II, we will show how these demographic trends are playing out for the world’s sole superpower and most important economy: the United States.  Part III will dive deeper into the economic impact of slowing population growth and population aging, and, as always, conclude with a discussion of the ramifications for investors.

View the full report

Asset Allocation Weekly (February 21, 2020)

by Asset Allocation Committee

In 2017, we introduced an indicator of the basic health of the economy and added it to the many charts we monitor to gauge market conditions.  The indicator is constructed using commodity prices, initial claims and consumer confidence.  The thesis behind this indicator is that these three components should offer a simple and clear picture of the economy; in other words, rising initial claims coupled with falling commodity prices and consumer confidence is a warning that a downturn may be imminent.  The opposite condition should support further economic recovery.  In this report, we will update the indicator with January data.

This chart shows the results of the indicator and the S&P 500 since 1995.  The updated chart shows that the upward momentum in the economy has slowed but remains well above zero.  We have placed gray bars to indicate recessions.  The indicator was coincident with the 2001 recession but didn’t turn negative until June 2008, when the recession was well underway.  Unfortunately, in its raw form, it signals trouble when the equity markets are already well into their decline.

To make the indicator more sensitive, we took the 18-month change and put the signal threshold at minus 1.0.  This provides an earlier bearish signal and also eliminates the false positives that the zero threshold generates.  Nevertheless, the fact that this variation of the indicator is below zero raises caution.

What does the indicator say now?  The economy has been decelerating but conditions have improved over the past three months, lifting this indicator back to near-zero.  Thus, the improvement does suggest that investors should remain in equities based on the idea that economic conditions remain supportive.  In past updates, we have expressed caution that at least rebalancing of portfolios was in order.  This update would indicate that further defensive action should be put on hold for now.

View the PDF

Asset Allocation Weekly (February 14, 2020)

by Asset Allocation Committee

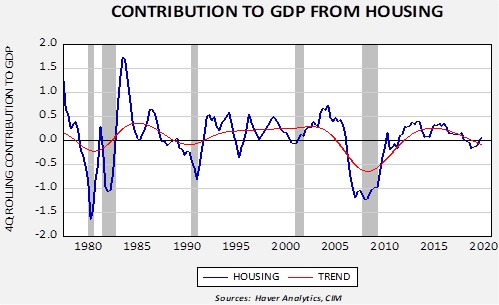
The data on U.S. residential real estate has been improving in recent months.  Housing tends to have an outsized effect on the economy.  Not only do housing purchases trigger follow-on buying of consumer durable goods (e.g., furniture and furnishings, etc.) but non-durables as well (e.g., basic household items).  A house is an asset and there is a wealth effect that affects future spending as well.  The direct impact on GDP is rather modest; the average contribution to GDP from residential real estate is only 0.08% per quarter.  However, there is evidence that a weak housing market has been a precursor to recession.

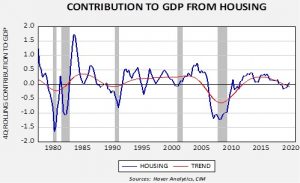
This chart shows the four-quarter rolling contribution to GDP from residential real estate.  We have applied a Hodrick-Prescott Filter to the data to establish the underlying trend.  Since 1980, with one exception, a negative reading on the trend has been a warning of eventual recession.  The only exception was the 2001 recession which was an unusually mild downturn.  In Q1 of last year, the trend indicator turned negative.  Although it can take a long time from signal to recession (it turned negative in Q1 2005, for example), it has been a reliable signal of economic weakness.  However, some housing indicators have shown notable improvement recently, which may lead to the trend rising later this year.  Here are a couple indicators we are watching.

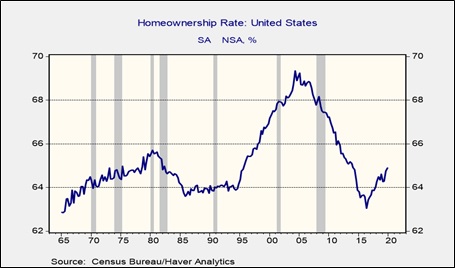
Home ownership rates have been rising rapidly.

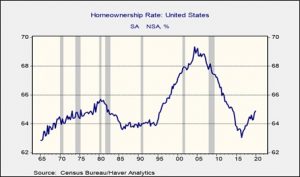
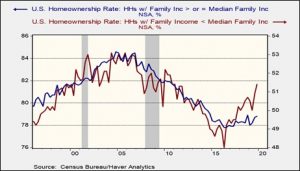
In 1995, the government began to aggressively support home ownership.  Credit restrictions were eased, and refinancing was encouraged.  The home ownership rate peaked at 69.3% of occupied homes in 2004.  The housing crisis led to a collapse in this metric, reaching a trough of 63.1% in 2015.  As the chart shows, the homeownership rate has been rising rapidly since, reaching a new cycle high of 64.9%.  The rise in home ownership rates has increased the most among households earning less than median family income.

Although there is a potential credit quality issue with less affluent home buyers, the rise should be supportive for economic growth.

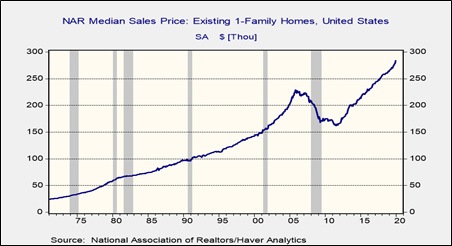
The only “fly in the ointment” has been that home prices have been rising rapidly.  Although it hasn’t adversely affected affordability due to low mortgage rates, it will make the housing market increasingly sensitive to interest rates.

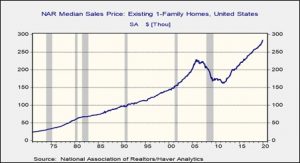
Ideally, rising prices for existing homes should spur new building.  Housing starts are beginning to accelerate, which is a good sign.  If housing continues to accelerate, our estimates for GDP this year may be overly conservative.

View the PDF

Weekly Geopolitical Report – Investment Implications of Changing Demographics: Part I (February 10, 2020)

by Patrick Fearon-Hernandez, CFA

(Note: Due to the President’s Day holiday, our next report will be published on February 24.)

In the 1960s and 1970s, people worried a lot about rapid population growth.  According to the United Nations, the world’s population was growing at an average annual rate of more than 1.9% during those decades, jumping from 3.0 billion in 1960 to 4.5 billion in 1980.  That created a lot of concern about the implications for the environment, social stability, and the economy.  However, many people don’t realize that population growth has slowed dramatically since then.  The global population is expected to grow only about 1.05% in 2020, and growth is projected to slow all the way to zero by 2200.  This dramatic slowing and the associated aging of the population are already having a big impact on society.

In theory and practice, population trends should affect investment returns, even if it’s hard to separate their impact from other, shorter-term economic and financial factors.  This three-part series aims to lay out the broad contours of today’s global population story, with a focus on last year’s updated forecasts from the UN Population Division.

Part I of the report will focus on the broad contours of today’s global population trends and what they mean for relative geopolitical power in the coming decades.  In two weeks, Part II will focus on specific demographic trends in the United States.  The following week, Part III will examine the economic impact of these trends.  Many other forces will have a greater impact on investments in the short run, but Part III will conclude with a discussion of how these demographic trends are likely to affect the financial markets in the long run.

View the full report