by Bill O’Grady, Thomas Wash, and Patrick Fearon-Hernandez, CFA
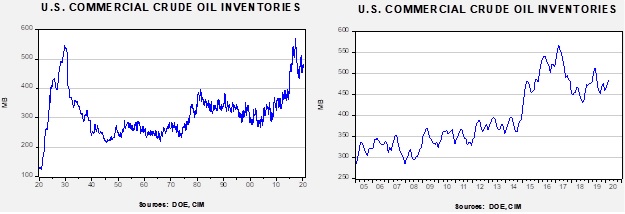
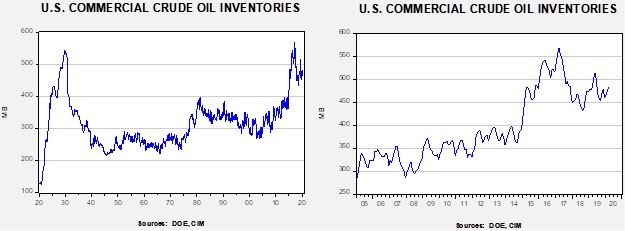
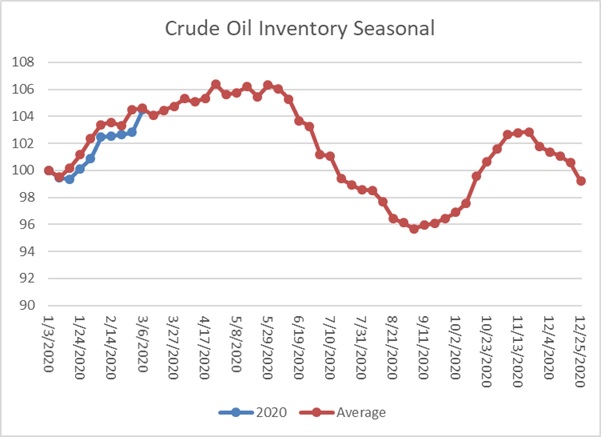
Crude oil inventories rose 2.0 mb compared to the forecast rise of 3.5 mb.
In the details, U.S. crude oil production rose 0.1 mbpd to 13.1 mbpd. Exports rose 1.0 mbpd, while imports rose 0.1 mbpd. The inventory build was less than forecast due to the rise in exports.
(Sources: DOE, CIM)
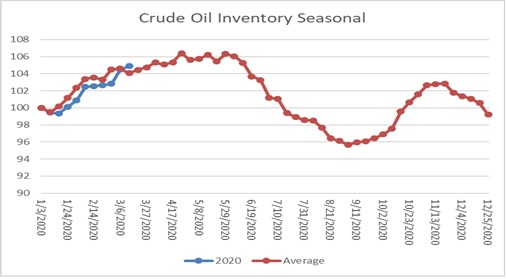
The above chart shows the annual seasonal pattern for crude oil inventories. This week’s report put inventory accumulation modestly above seasonal norms. Inventories will be expected to rise steady into late May. We will be watching this chart closely in the coming weeks for signs that inventories are rising abnormally due to the market share war described below.
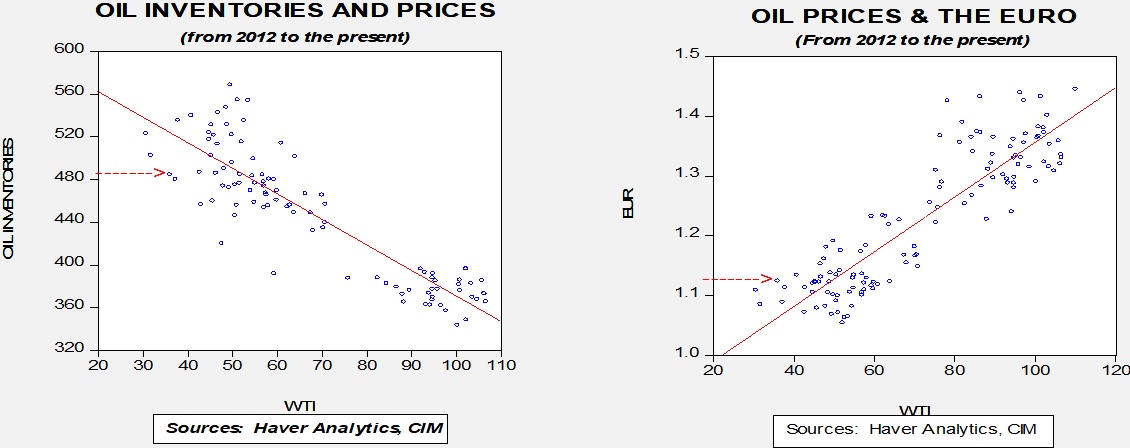
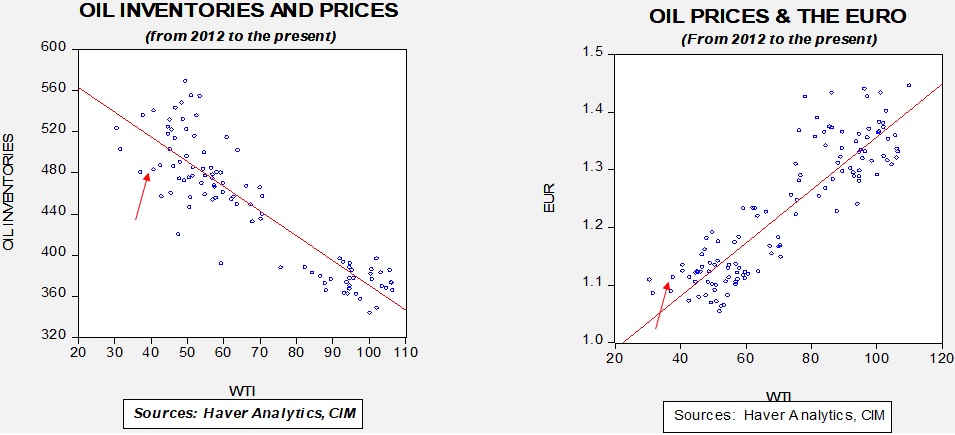
Based on our oil inventory/price model, fair value is $55.77; using the euro/price model, fair value is $53.14. The combined model, a broader analysis of the oil price, generates a fair value of $53.26. As we noted last week, the model output is less relevant unless Russia and the Kingdom of Saudi Arabia (KSA) come to an agreement on supply.
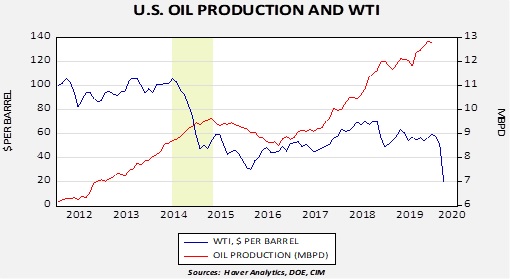
Needless to say, our forecast for oil prices was reasonably accurate in terms of level but far too conservative in terms of time. WTI has declined under $21 per barrel since our last report. The combination of increased KSA supply and rising Russian output, combined with falling demand, is putting significant negative pressure on prices. U.S. oil producers in the shale patch are already signaling layoffs. The U.S. industry is more competitive and better hedged than in 2015; although bankruptcies are unavoidable, production will likely remain elevated for some time regardless of how low prices fall.
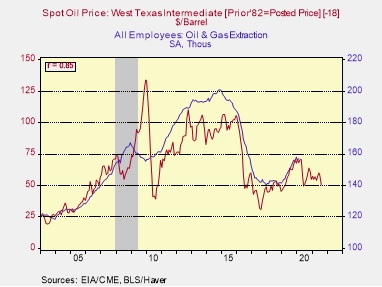
This chart shows WTI oil prices with U.S. crude oil production.[1] We have highlighted the area from the peak in oil prices in 2014 to the peak in production in 2015. The lag between these two periods was 10 months. Thus, we would not expect any significant declines in U.S. output until late Q4 at the earliest. If Russia and the KSA continue to fight for market share, oil prices will remain under further pressure for the foreseeable future.
When financial markets get caught up in a crisis like the ongoing coronavirus panic, one underappreciated risk for investors is that they can get too distracted to notice other, longer-term problems that might be brewing. That’s why we take such a disciplined approach to monitoring geopolitical, economic, social and market events all around the world. While we continue working hard to understand the coronavirus epidemic and anticipate its trajectory, we’re also paying close attention to the latest flare up in the Syrian civil war.
In this week’s report, we discuss the Syrian government’s effort to finish off the last remaining rebels in the northwest part of the country, and we show why Turkey recently launched a counteroffensive against that effort. We explain what the various players in the drama are hoping to achieve and how their actions could draw in outside forces like Russia and the U.S. Importantly, we also discuss how the situation could produce another destabilizing migrant crisis for the Europeans. As always, we conclude with investment implications.
The last three weeks of financial market turbulence have been among the most harrowing I’ve ever seen. To my memory it’s been a combination of October 1987 and October 2008, two months I’d prefer to forget. While the stock market was dropping sharply and quickly, U.S. Treasury bonds were soaring almost as fast.[1] In my last two quarterly letters I’ve noted the impossibility of seeing into the future. I think we’ve now established beyond a reasonable doubt that neither we nor anyone else can forecast future events. Within a surprisingly short period of time, the U.S. economy (and the global economy) has moved from a period of steady growth and low unemployment to a position of great vulnerability. How did this happen? Three things have quickly conspired to bring us to this point. The first two were both new and invisible until quite recently. The third was a known concern lurking out of sight (but always there in a long economic expansion). These three causes of our troubles are:
The coronavirus known as SARS-CoV-2, which produces a serious and sometimes fatal disease known as COVID-19, has spread around the world. This virus began in China in December 2019 and began moving across that country in the first two months of this year. From there the virus moved east and west across the world (as almost all viruses do). This virus has proven to be particularly dangerous because it is virtually as contagious as the common cold but has a mortality factor somewhat worse than seasonal influenza. Our chief market strategist, Bill O’Grady, and his team have been tracking the path of this virus since January. As it has neared the U.S. it has become apparent that it will cause an economic slowdown here, since the most effective way to combat this virus is social isolation, which translates to much lower economic activity. Because the virus seems to have an arc of virulence roughly two to three months in length, it has been our view that the virus alone was not enough to cause a recession here or cause lasting economic damage. Over the last week, that view has changed due to the second causal factor.
An oil price war has broken out between OPEC, led by the Kingdom of Saudi Arabia (KSA), and the Russian government. Both governments are oil-dependent and thus benefit from higher (but not too high) oil prices. This mutual goal has been frustrated in the last decade by increasing oil supplies from outside of OPEC and Russia, mostly from the United States. In a meeting that concluded on March 7, the KSA tried to convince Russia to agree to a set of production cuts that would keep prices high. Russia declined to reduce oil production and instead announced its intention to increase production to drive prices down. The KSA has since also announced production increases. These two petrostates appear to be intent on driving prices down in order to: a) maintain and grow market share in China, the world’s #1 importer, and b) reduce U.S. shale producers’ share of world markets by moving oil prices below their costs of production. Once relieved of the U.S.’s large oil production, they hope that prices will rise more permanently. This is a high-stakes game, where the loser is the U.S. oil industry. If the U.S. government cannot force the end of this price war quickly, the probability of a recession in the U.S. rises substantially when combined with the virus-related slowdown. It so happens that right now the U.S. is vulnerable to a recession for a very ordinary reason, our third factor.
Private sector debt always grows as an economic expansion ages. The reason for this is that investors and businesspeople become more bold as an expansion gets old. The further a recession recedes into the rear-view mirror, the more people believe it won’t happen again. Thus, they become bolder in their investments. We are fortunate that, unlike 2008, the debt growth this time is not concentrated in the consumer sector like it was then. Twelve years ago, residential mortgage debt was the big problem. This time the debt problem is corporate debt. This has been something we’ve been monitoring for a while. Both our Market Strategy team and our Asset Allocation team have noted a heightened probability of economic difficulties in their recent publications.[2] Much of this debt, especially that below-investment grade, is tied to the energy industry. Thus, the price war in oil has increased the probability of financial troubles in the oil patch and on Wall Street. Much of this debt is outside of the U.S. banking system. Post-2008 reforms required U.S. banks to hold higher levels of equity capital and reserves, reducing their ability to lend. The demand for debt capital grew, however, as both the economy and the energy industry grew. Non-bank lenders grew dramatically over this decade to meet the demand for money, with the result that financial risk also grew. The “staying power” of energy companies through this likely oil price “valley” is thus reduced by their debt loads, and the lenders who serve them could become impaired as well.
In my opinion, any one of these factors would have been unlikely to produce a recession. For instance, factor #2 did occur just five years ago, when oil prices declined from near $100 per barrel to about $30 over 15 months. While the oil industry suffered its own recession, the U.S. avoided a general recession. The coincidence of all three of these factors within the same short time frame raises substantially and quickly the probability of a recession.
Bill O’Grady publishes every Friday an Asset Allocation Weekly report that is appended to the end of the Confluence Daily Comment. This past Friday Bill published one of the most important pieces he’s ever written.[3] In this report Bill explained why, within the space of a week, the probability of a recession this year has risen from low to high. In a lengthier 2020 Outlook Update published today we explain how the three factors noted above have changed our base case for the year to one of recession.[4] The sharp sell-off in the stock market and the rise in the treasury bond market were not simply due to panic about the coronavirus. We presume that we were not alone in ratcheting up dramatically our expectation of a recession last week. The result is that the U.S. stock market, basis the S&P 500, has dropped 27.0% from its top-tick on February 19 to its bottom tick on March 12. It presently stands at 2711, or 20.1% below its high. Bill’s work (in the AAW report noted) indicates a likely low of about 2300, which is 15.2% below our current level. This estimate presumes a recession of normal length and depth, which is our current expectation. Given that estimate, the market would appear to have, in a period of about three weeks, sold off roughly two-thirds of what we would have expected for the entire cyclical bear market. This is consistent with market behavior over the last few decades, wherein market discounting for rapid changes in expectations has become an extremely quick affair.
What is Confluence doing? Confluence provides both equity strategies (utilizing individual stocks) and asset allocation strategies (utilizing exchange-traded funds, or ETFs). Our equity strategies are fully invested strategies with low turnover, which we believe provide long-term investors (those with a greater than five-year time horizon) the best opportunity to build wealth. We do not asset allocate within an equity portfolio, which means we do not target cash to “time the market.” We don’t do that because we deem it impossible to do so successfully and consistently. This means that our equity portfolios do usually decline in price when the general market heads south. Our goal is not to sit out bear markets, but to survive them by owning shares in companies that not only survive recessions but come out of them with stronger competitive positions. For long-term taxable investors, this strategy is especially valuable, in our opinion.
While we always emphasize company quality according to specific and proprietary guidelines, as the probability of a recession rises, we test each position again regarding its survivability in the sort of recession we anticipate. Any companies that concern us are removed and replaced, even if bought in recent months. In other cases, shares of outstanding businesses we do not own because of prohibitively high valuations become available to us at what we consider to be bargain prices. Thus, again, we will sell shares of companies we consider to be lesser businesses and replace them with what we believe is a quality upgrade. Investors are sometimes troubled when we sell a stock in a down market, even at a loss, but when we do so we have the eventual economic recovery in mind. The goal is to put the portfolio in an optimal position to benefit from that recovery. As a wise old investor once said, “The goal in a falling market is to own tennis balls rather than tomatoes.” Economies and stock markets do recover. We aim to both give up as little as possible on the downside and to pick up as much as possible on the upside.
Confluence’s asset allocation strategies take a medium-term view of investing, that is, a three-year forward time frame. In an era when changes in market prices occur quickly and severely as economic outlooks change, asset allocation is an investor’s best tool to protect oneself. This is a preventative, rather than tactical, maneuver, but it’s by far the most effective. An investor should set a balance between asset classes that fits his or her risk profile when markets are tranquil. After markets have adjusted dramatically, such as at present, it makes sense to reevaluate the asset allocation. If an investor’s risk profile is unchanged, it makes sense for most investors to rebalance the asset allocation.
For clients in our asset allocation and balanced strategies, an investor, with the counsel of their financial advisor, can select the appropriate asset allocation at the outset. If personal circumstances change, the asset allocation can be changed by giving us instructions. Otherwise, we manage the asset allocation according to our investment team’s outlook. When markets move dramatically, the rebalancing occurs automatically in our asset allocation and balanced portfolios.
Given an increasingly dour outlook in recent quarters, we increased the relative duration and investment quality of our fixed income allocations and have increased our allocations to gold in those strategies for which commodity allocations are appropriate. These allocations have cushioned some, but not all, of the downside in the equity allocations. At some point in the economic cycle, we expect to reverse some of those moves. Until that time, rebalancing asset allocations will still occur.
Regardless of the strategy, our investment teams are attentive to the rapid changes that have occurred and are occurring. As noted above, we cannot forecast the future, but new and, sometimes, unexpected changes are par for the course. When dramatically new challenges occur, we react accordingly, if necessary. We encourage you to stay in touch with the changing investment landscape by reading our Daily Comment and other publications on our website.
We appreciate your confidence in us.
Gratefully,
Mark A. Keller, CFA CEO and Chief Investment Officer
Our baseline position has been that the COVID-19 virus would have a significant impact in terms of magnitude but be of limited duration and thus would probably not put the economy into recession. Over the past week, two events have occurred which put this position into question. The first is the oil market collapse triggered by a market share war between Russia and Saudi Arabia.[1] The second issue is that the financial system is exhibiting symptoms of liquidity problems.
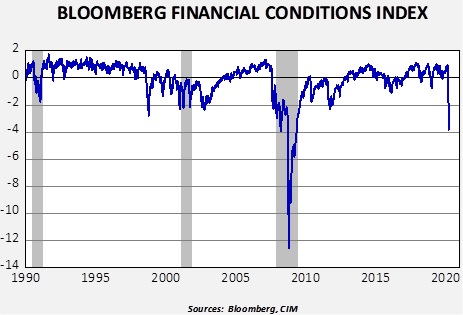
We have noted a sudden decline in financial conditions as measured by the Bloomberg Financial Conditions Index for the U.S.
Our data uses the Friday closes for the index. The index is composed of eight variables[2] which are standardized and totaled. The more negative the reading, the greater the level of financial stress. The index was positive until the last week of February. The current level of stress is about on par with March 2008 during the collapse of Bear Stearns.
This data suggests a serious level of financial problems in the financial system. We have noted difficulties in the funding markets since September. Although the Fed has consistently claimed there was nothing systemic in the rise of repo rates, the persistence of the funding shortages despite the expansion of the Fed’s balance sheet by $400 billion argues otherwise.
What is the nature of the financial stress? Its roots most likely lay with interest rates being too low for too long; investors had to extend their portfolio risk to find attractive yields. The financial services industry took steps to provide financial products with more attractive yields. Some of this product creation went to the non-bank financing system which funds itself in the repo markets. If repo markets are disrupted, they can no longer service the debt they used to own the higher yielding assets and liquidations occur. If no liquid market exists for these products, the owners may be forced to sell other assets (gold, Treasuries, equities, investment grade bonds) to find necessary liquidity. Recent weakness in “risk off” assets would tend to confirm rising levels of financial stress. A contributing factor is the plunge in oil prices, which raises default risk among energy companies.
The Federal Reserve should be able to corral this problem if it moves aggressively enough to force liquidity into the financial system. Unfortunately, as we saw in 2008, it may be difficult to pinpoint exactly where the funding problems lie. But, the key lesson from 2008 is that enforcing moral hazard is a bad idea; we doubt such a policy will be executed in this event. Although a few of our economic indicators have moved to signal recession, the preponderance have not. On the other hand, the yield curve did invert last year, and we have been on “recession watch” for some time.[3]
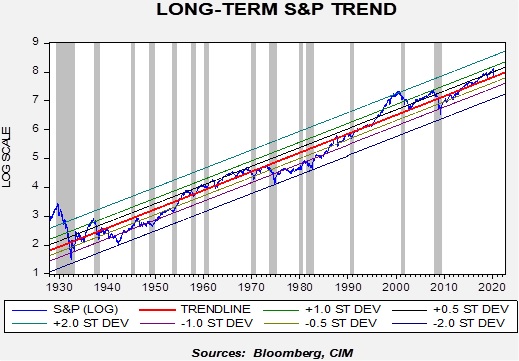
How does all this affect equity markets? The chart below can offer some guidance. This chart shows the weekly close of the S&P 500 going back to late 1927. We log-transform the index and regress a time trend through the data. The parallel lines represent various standard error levels from trend; the gray bars show recessions. It is obvious that, with the exception of 1945, every recession has led to some degree of stock market weakness.
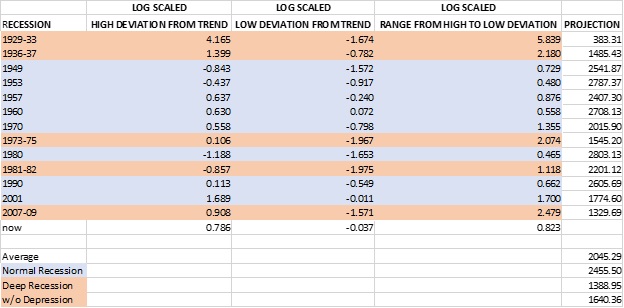
To compare recessions, we measured the high reached before the recession to the low in the index during the downturn in terms of movements in standard errors. Here is a table of the events.
Range represents the change in standard error from high to low. So, the Great Depression saw the market fall nearly six standard errors, a true “six-sigma” event. The current decline is consistent with a normal recession, so if policymakers can secure the financial system and absorb the quarantine effect of COVID-19, then equity markets should stabilize soon. A deep recession (but not including the Great Depression) would put the S&P 500 around 1640, a much more profound decline.
The postwar experience doesn’t support two consecutive deep recessions, which is why we have argued that another 2008 is unlikely. Of course, we did have consecutive deep recessions in the 1930s: the 1936-37 recession was caused by profoundly inept policy when the Roosevelt administration tightened fiscal policy while the Federal Reserve raised rates. The odds of a similar event occurring in the current situation is improbable; both fiscal and monetary policy are accommodative and will almost certainly become more so. About the only way we have a deep recession is if the policy response is strikingly underwhelming. Although possible, that is a low probability outcome.
So, the bottom line is that we will likely see a few weeks of churning and perhaps a decline toward 2300, but the worst of this downturn is probably over. Liquidity injections and the natural waning of COVID-19 should improve sentiment over time. We are probably very close to the low in terms of price but not in terms of time. It will probably take a few weeks of basing before a durable recovery can develop.
[2] TED spread, LIBOR/OIS spread, commercial paper/T-bill spread, Baa/10-year T-Note spread, Muni/10-year T-Note spread, swap volatility, the S&P 500 and the VIX. There are other similar indices with a larger set of variables, but the Bloomberg variation is calculated daily, whereas the others are calculated weekly or monthly.
[3] Hence the title of our outlook for 2020, “Storm Watch.”
by Bill O’Grady, Thomas Wash, and Patrick Fearon-Hernandez, CFA
Crude oil inventories rose 7.7 mb compared to the forecast rise of 1.7 mb.
In the details, U.S. crude oil production fell 0.1 mbpd to 13.0 mbpd. Exports fell 0.7 mbpd, while imports rose 0.2 mbpd. The inventory build was more than forecast due to falling exports and rising imports.
(Sources: DOE, CIM)
This chart shows the annual seasonal pattern for crude oil inventories. This week’s report rose to seasonal norms. Inventories will be expected to rise steady into late May. We will be watching the above chart closely in the coming weeks for signs that inventories are rising abnormally due to the market share war described below.
Based on our oil inventory/price model, fair value is $56.46; using the euro/price model, fair value is $53.22. The combined model, a broader analysis of the oil price, generates a fair value of $53.57. The model has lifted its fair value calculations due to dollar weakness; however, under current circumstances, the model output is less relevant unless Russia and the Kingdom of Saudi Arabia (KSA) come to an agreement on supply.
The big news in oil is the market share war that has emerged from the recent OPEC+Russia meeting. The KSA was unable to convince Russia to contribute to supply restrictions and Riyadh has announced an all-out supply war. Prices plunged this week in response.
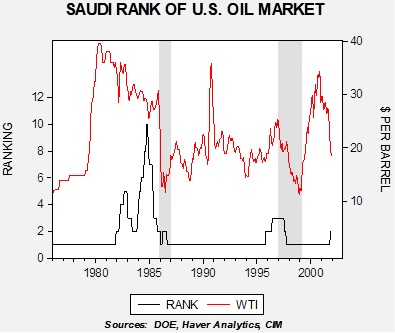
The following two charts show the KSA’s thinking. The Saudis have, in their history, had one market they keyed on where they wanted either to be the largest or second largest supplier. In the 1970s through the 1990s, that market was the U.S. There were two reasons for this. The U.S. was the largest importer of crude oil and provided security for the KSA. Thus, the kingdom did not want to lose share in the U.S. because (a) it was the most important market in the world, and (b) it feared the U.S. would view providing security as less critical if the KSA was seen as less important. During two previous market share wars, in 1986 and 1997-99, the loss of share was a triggering event. The chart below shows WTI along with the Saudi rank as foreign supplier to the U.S. market. The gray bars are designated as market share wars.
Until 1986, the KSA acted as “swing producer” for OPEC.[1] This led to a near-catastrophic loss of market share in the U.S. In December 1985, the KSA signaled it was abandoning the swing producer role and would retake market share. Oil prices fell from the low $30s to near $10 per barrel before the rest of OPEC capitulated and agreed to output cuts. In the mid-to-late 1990s, the KSA was losing market share in the U.S. to Venezuela, which had invited foreign company oil investment in order to boost output capacity. The KSA retaliated with supply increases into the Asian Financial Crisis. Prices fell from the mid-$20s to near $10. The war ended when Venezuelan President-elect Hugo Chavez signaled an end to the supply war, eventually ending the policy of using foreign investment to lift capacity. Prices rapidly recovered.
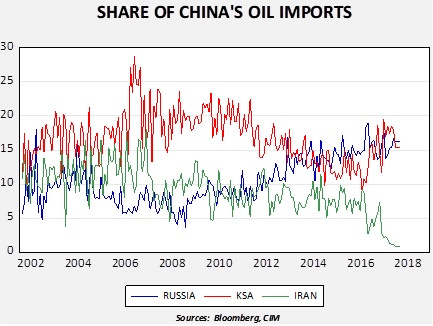
This time around, the U.S. is not the target of the KSA. The U.S. has made it clear that it is reducing its security footprint in the Middle East and, with the onset of shale production and a “captured” Canadian oil market,[2] the KSA can’t really defend its U.S. share. Instead, it has staked its future on rising Chinese oil demand, and likely hopes that, at some point, it will be able to receive security support from China as well.[3] Therefore, the KSA is committed to be the preeminent oil supplier to Beijing. Russia is threatening that position.
This chart shows the share of China’s oil imports from the KSA, Russia and Iran. From 2006 to 2012, the KSA held a dominant share. But, since 2014 (when the KSA reversed its policy on trying to drive down shale oil production via lower prices), Russia’s share has been competing with the KSA.
So, given this background, how do we expect this to play out? Most OPEC nations are rentier states; they use revenue from oil to support government spending. In addition, these nations tend to suffer from the “Dutch disease,” a condition where a commodity export tends to boost exchange rates, making domestic industries less competitive. This process tends to lift imports and consumers become used to low-priced goods from abroad. As a result, currency depreciation tends to be politically unpopular. When the KSA fought for market share in the past, its competitors tended to avoid currency depreciation, which is an effective buffer to the costs of the market share war. In other words, a foreign oil company sells its product for dollars but pays its workers in local currency. If the currency depreciates, then its production costs compared to output prices decline. Russia has shown a tendency to depreciate the RUB when oil prices decline. The next chart shows that tendency.
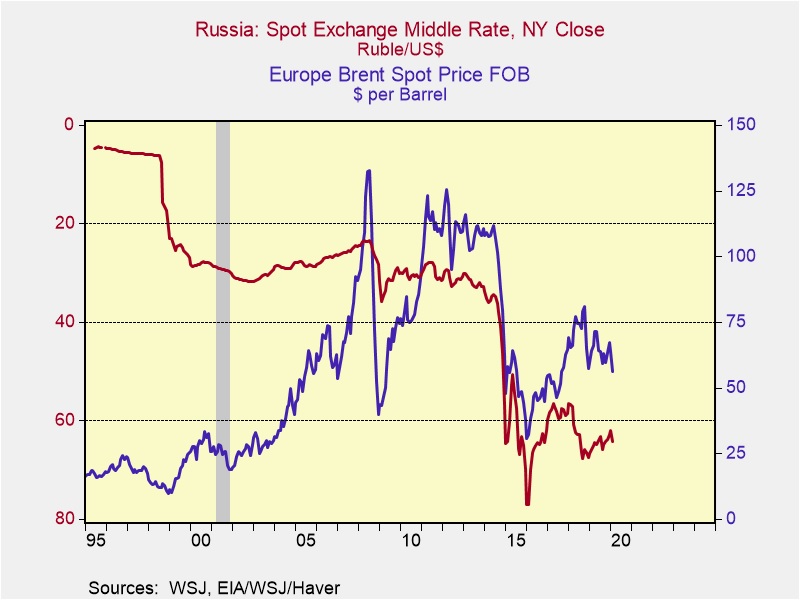
This chart shows Brent crude oil prices and the RUB/USD exchange rate (inverted scale). Note that as oil prices decline, the RUB falls with it. If Russia engages in similar behavior, it will give it more “staying power” in the share war.
How much will this event affect employment? In the oil patch, it will be signficant.
Assuming we see $25 WTI, we will likely see nearly 40k jobs lost in oil and gas extraction. But, as the chart shows, it will take about 18 months to occur.
The bottom line is that this share war will likely get rather ugly. The KSA is pushing supply into the world market and it has no place to go. The U.S. oil industry will suffer greatly, but production probably won’t start to decline until autumn, when price hedges will likely roll off. Iran will also be crushed by this move; the little oil it is selling will fall dramatically in price. We look for prices to fall into the low $20s in the coming months.
[1] A swing producer adjusts output to fix a price.
[2] Canada’s pipeline system is limited, so most of its output ends up in the U.S. market. This means, at least in terms of the oil market, that Canadian production can be thought of as U.S. supply.
[3] This is a bit of a pipedream. Although China’s military is growing rapidly, it is still years away from being able to project power beyond its borders.
Since January, the world has been dealing with the COVID-19 virus, a new coronavirus that has been spreading around the world. Because this situation is still evolving, it is too early to determine the overall impact of this specific virus. We update our views on COVID-19 regularly in our Daily Comment report.
In this report, we will examine the general geopolitical consequences of pandemics. We will start with a broad description of pandemics. From there, we will discuss the key problem facing policymakers, how to create the proper response to such events. An analysis of the impact on social and economic conditions will follow. As always, we will conclude with market ramifications.
What is a Pandemic?
To define a pandemic, it makes sense to define the stages before a disease reaches that category.
Sporadic: This is a disease that occurs infrequently and irregularly. An occasional case of polio or measles that doesn’t spread would fall into this category. It usually doesn’t require a policy response.
Endemic: This is a disease that is constant or has usual prevalence within a specific geographic area. Annual influenza would be an example.
Epidemic: This is a disease that shows a sudden and large increase in infections within a specific area.
Pandemic: This is an epidemic disease that spreads to a wider geographic area.
In the turmoil caused by COVID-19, fixed income has performed remarkably well. Ten-year T-note yields have declined to record lows and, as we will show below, there is no evidence of severe stress in the credit markets.
First, here is what we are seeing in Treasuries.
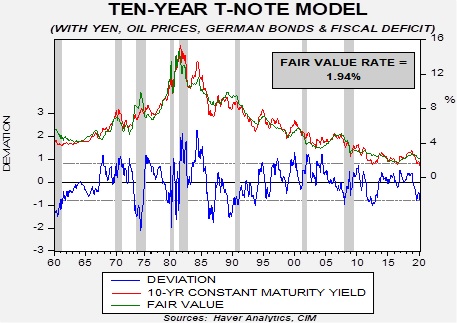
This chart shows our 10-year T-note model. It uses fed funds, the 15-year average of inflation,[1] the yen/dollar exchange rate, oil prices, German bund yields and fiscal deficits as a percentage of GDP. At the end of last year, the fair value was around 2.40%; as the above chart shows, it has declined sharply to 1.94%. Of course, that yield remains well above current yields. The implied three-month LIBOR rate from the two-year deferred Eurodollar futures suggests the financial markets expect another 50 bps of rate cuts over the next two years. Even assuming a 0.75% fed funds target only lowers the fair value to 1.84%. Assuming those rate cuts at a German bund yield of -3.60% (a decline of 300 bps from current levels) would get the model to current yields. A negative yield to that level would be unprecedented. The most likely justification for current yields would be a sharp drop in inflation expectations. If inflation expectations decline to 1% per year along with the assumption of 100 bps of rate cuts, that would justify current yields. This analysis suggests that long-duration Treasuries are richly valued at current levels, and if our base case that COVID-19 won’t trigger a recession is accurate, then a back-up in these yields would be expected.
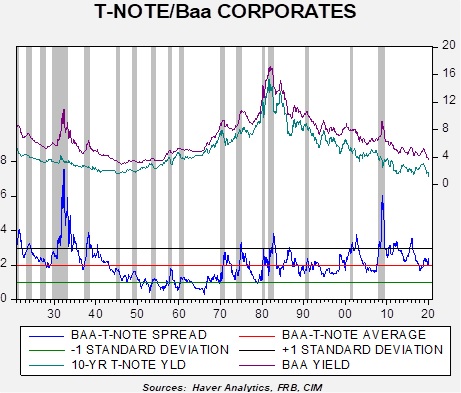
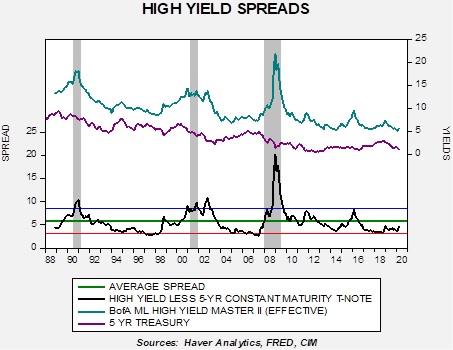
What is perhaps most interesting is that there has not been a strong reaction in credit. Comparing the 10-year to Baa yields shows that spreads have not moved significantly, only around 30 bps.
In high yield, spreads have widened as well, but the increase is not notable so far.
Yields have increased by 80 bps but remain 120 bps below average.
The lack of pressure in the credit markets, at least to this point, suggests the current situation probably won’t evolve into deep financial crisis or a recession. We will continue to monitor the credit markets closely in the coming weeks, but financial stress appears quite manageable for now.
We use cookies to ensure that we give you the best experience on our website. If you continue to use this site we will assume that you are happy with it.