Traditionally, Labor Day is considered the point when an increasing number of Americans start paying attention to the November elections. As part of our analysis of the candidates, we create dossiers of the candidates and the leading figures with whom they surround themselves. In this report, we will comment on those we see as potentially taking positions in the foreign policy team of a Biden presidency. First-term presidents tend to lean heavily on foreign policy experts, so the people selected to fill these roles would have a hand in shaping policy.
There is an old saying in politics that “personnel equals policy.” Although not completely the case, it does matter who is in the important cabinet and advisory posts. Because this is a geopolitical report, we will focus on foreign policy positions—Secretary of State, Secretary of Defense, Secretary of Treasury, Director of the CIA, and National Security Advisor. We have no insider information about who will get these roles; our predictions are based on open sources and our own analysis. But, based off these conjectures, we will attempt to determine what Biden’s foreign policy would look like.
We will begin with an overview of what we would expect in terms of foreign policy from a Biden presidency. We will follow that discussion with a short biography of who we think are the leading candidates for the aforementioned positions and name other potential candidates for the positions. Using this information, we will attempt to indicate what the sum of these positions would mean for the direction of Biden’s foreign policy. As always, we will conclude with market ramifications.
Next week, we will do the same for President Trump. Second terms are different than first terms. First-term presidents are learning their job and tend to be dependent on the experts they appoint. In the second term, presidents have more experience and the people they appoint to key positions are there mostly to execute the president’s policy preferences, not to offer advice. In addition, by the second term, the party’s leading functionaries have served (and moved on) and the team that replaces them is usually second tier. All that will be covered next week.
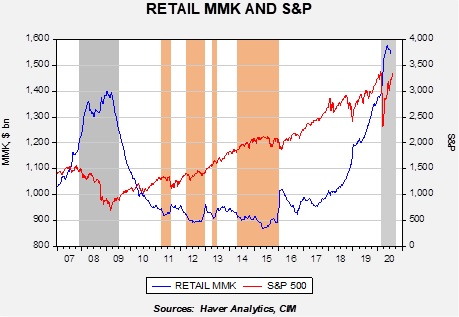
One of the relationships we monitor is retail money market levels (RMMKs). In theory, any available liquidity could conceivably end up purchasing equities. But, RMMKs are used by investors in their brokerage accounts and thus are probably “closer” to equities compared to other forms of “near money,” such as checking accounts, savings accounts and certificates of deposit. The chart below shows the most current reading.
This chart shows retail money market levels on a weekly basis along with the Friday closes of the S&P 500. The gray bars show recessions, whereas the orange bars show periods when retail money market levels fall below $920 billion. In general, when RMMKs fall to $920 billion or below, the uptrend in equities tends to stall. It would seem there is a certain level of desired cash, and when that level falls below $920 billion, households try to rebuild cash by either slowing their purchases of equities or selling stocks to build liquidity.
During the runup to the Financial Crisis, we saw a rise in RMMKs. The peak in liquidity was reasonably close to the trough in the S&P 500. In early 2018, we saw a notable rise in RMMKs that persisted despite the rally in equities. As the pandemic hit and the Federal Reserve aggressively eased monetary policy, RMMKs soared. The rise in RMMKs initially coincided with the sharp decline in stocks, although the pace slowed as equities recovered. It peaked in the second half of May and has been trending lower. When RMMKs fall, that liquidity must go to some other asset, real or financial.
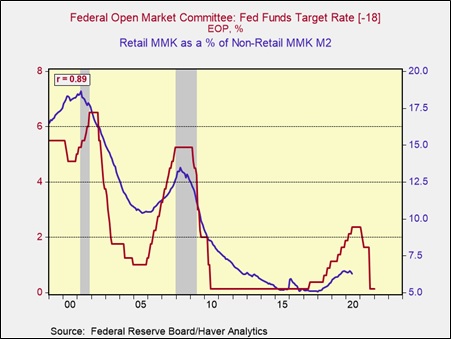
Although scaling RMMK is difficult, we do note that the ratio of M2 excluding RMMK does tend to track the fed funds target with a lag. This makes sense. Holding “cash” outside of a period of crisis is usually driven by interest rates. As rates fall, and hopefully the crisis eases, the current elevated level of RMMK will start to look for higher returns.
The chart suggests that RMMKs should begin to decline in earnest by December; where that liquidity finds a home is uncertain, but we would expect a good portion of it to go into equities if inflation fears remain muted.
by Bill O’Grady, Thomas Wash, and Patrick Fearon-Hernandez, CFA | PDF
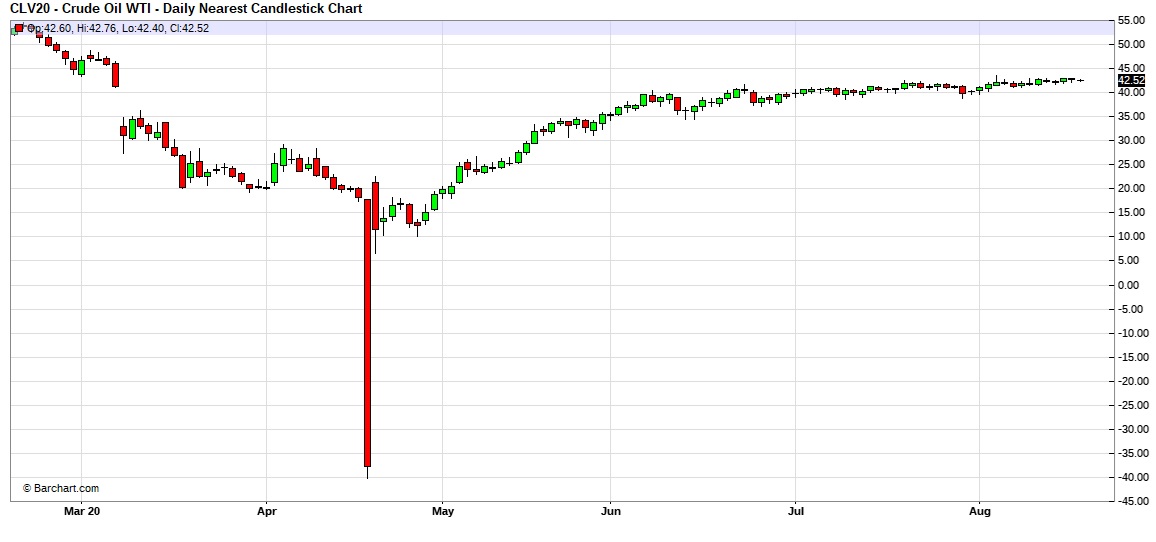
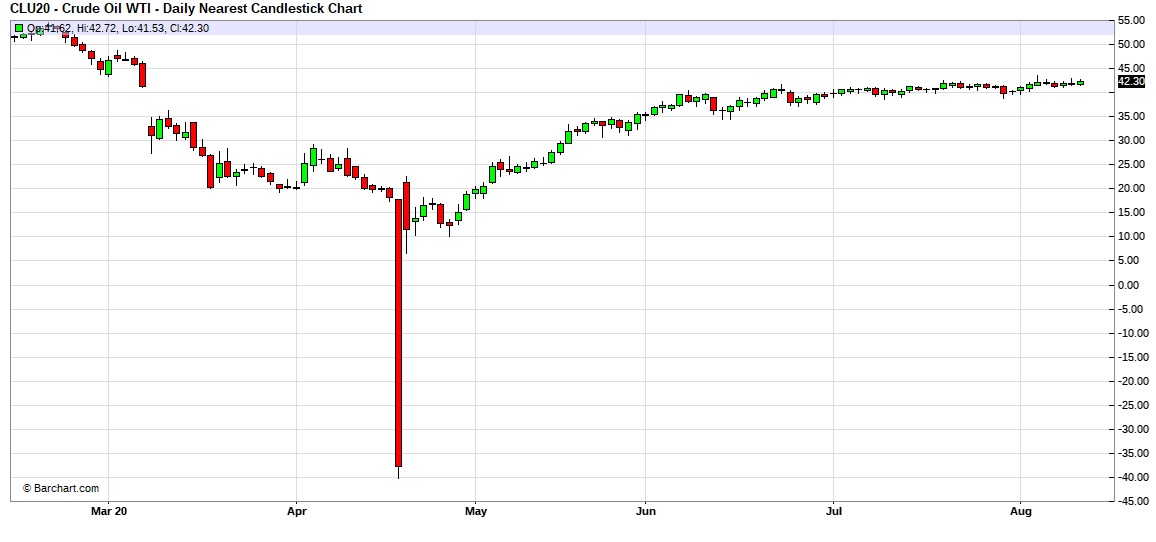
Here is an updated crude oil price chart. The oil market has stabilized at higher levels after April’s historic collapse.
(Source: Barchart.com)
Crude oil inventories fell less than anticipated, declining 1.6 mb compared to forecasts of a 2.9 mb decline. The SPR declined 2.7 mb as oil that was placed in the SPR for temporary storage is now being put back into the commercial system. Taking the SPR into account, storage dropped 4.2 mb.
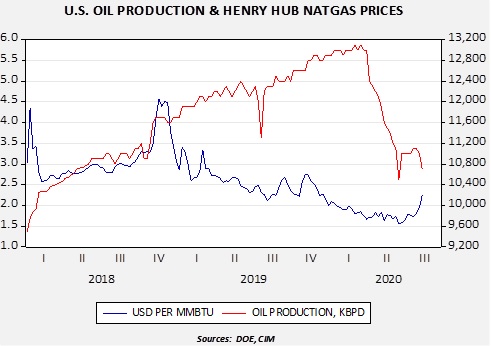
In the details, U.S. crude oil production was steady at 10.7 mbpd. Exports plunged 1.0 mbpd, while imports rose 0.1 mbpd. Refining activity fell 0.1%.
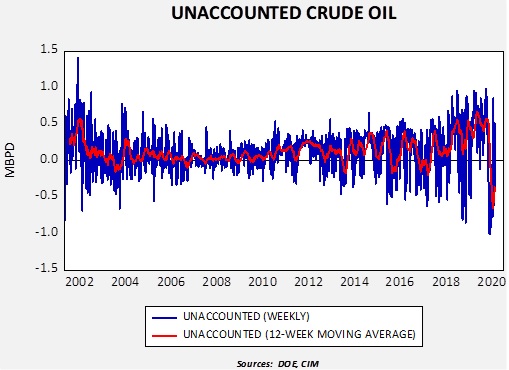
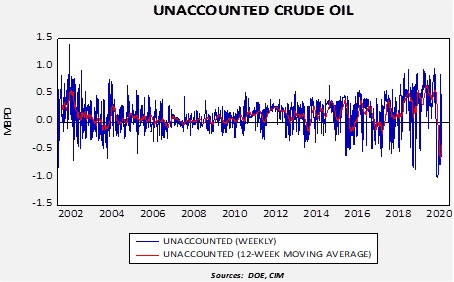
Unaccounted-for crude oil is a balancing item in the weekly energy balance sheet. To make the data balance, this line item is a plug figure, but that doesn’t mean it doesn’t matter. This week’s number is -421 kbpd. Although the volatility of this number is elevated, the trend is slowly stabilizing.
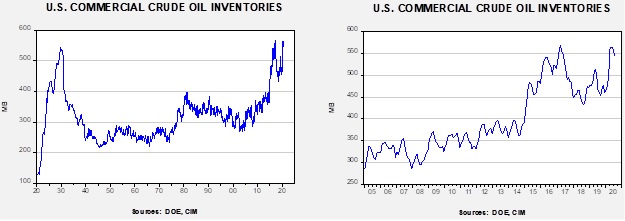
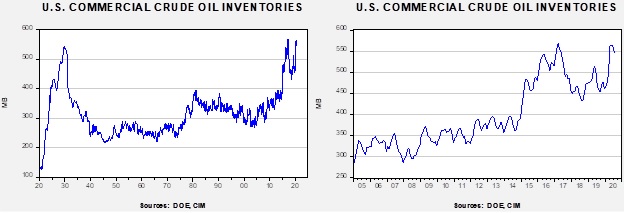
(Sources: DOE, CIM)
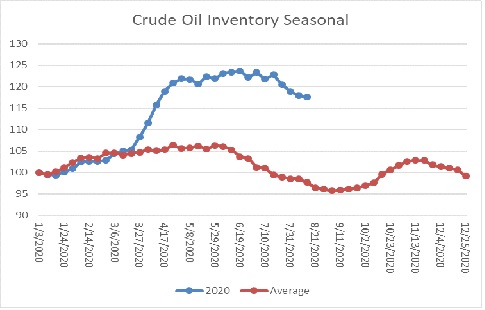
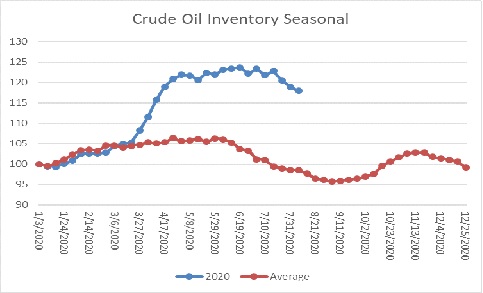
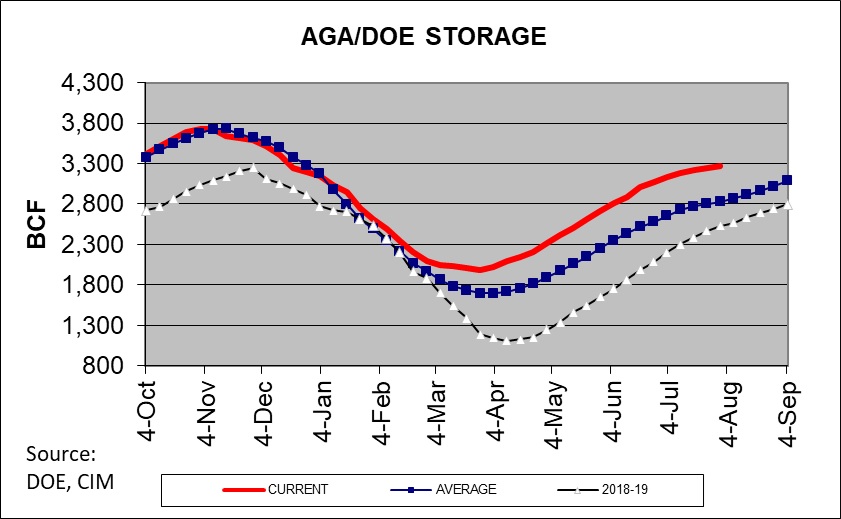
The above chart shows the annual seasonal pattern for crude oil inventories. This week’s data showed another decline in crude oil stockpiles. We are approaching the end of the seasonal withdrawal period. Although the declines of the last few weeks are supportive, stockpiles remain well above seasonal norms and remain a bearish factor.
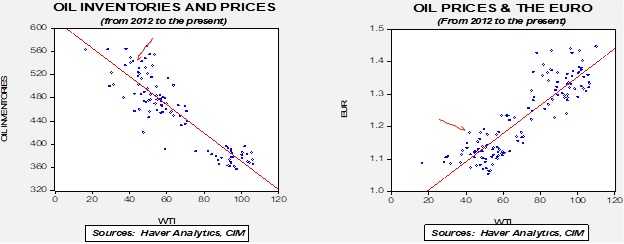
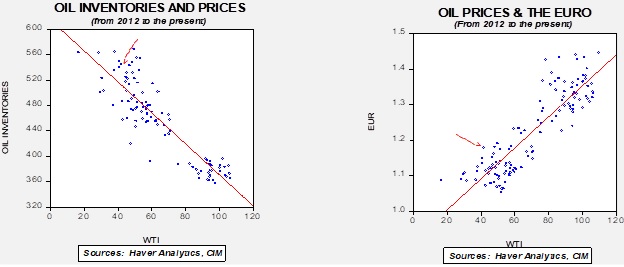
Based on our oil inventory/price model, fair value is $36.48; using the euro/price model, fair value is $64.08. The combined model, a broader analysis of the oil price, generates a fair value of $50.41. The wide divergence continues between the EUR and oil inventory models. As the trend in the dollar rolls over, it is bullish for crude oil. Any supportive news on reducing the inventory overhang could be very bullish for crude oil.
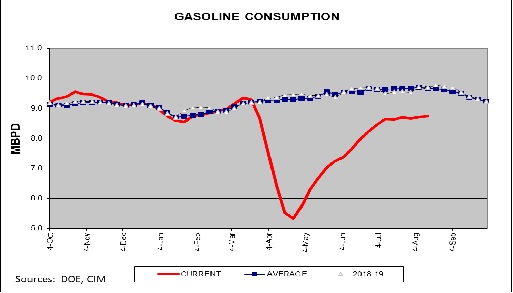
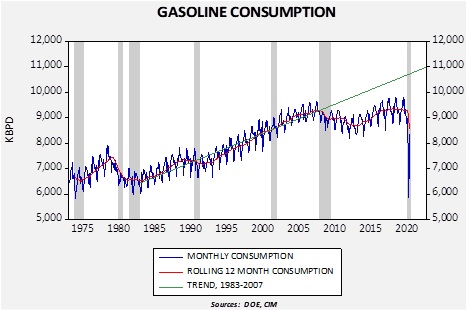
Gasoline consumption remains stalled. Although we probably won’t see the usual seasonal decline in consumption (there wasn’t much of a vacation season), the slowing of consumption does suggest a weaker economy.
In oil news, the Trump administration is postponing a politically fraught decision on ethanol. There is a mandate from the EPA on ethanol blending. The original law mandated that 36MM gallons of biofuels would be part of the transportation fuel mix by the early 2020s. The industry has not been able to hit that number; last year, there was 15.8MM gallons produced, down slightly from the prior year. The farming industry wants to force the mandate, whereas the petroleum industry, especially refiners, want to avoid it. What happens in practice is that the government maintains the mandate but liberally grants waivers to refiners, meaning that the growth in ethanol production has been flat. When the bill was signed by President Bush in 2007, it was assumed that gasoline demand would continue to rise. In that way, the mandate could have been met without increasing the percentage of ethanol blended into gasoline. But, the 2007-09 recession and the sluggish recovery that followed led to flattening gasoline consumption, meaning the only way to achieve the law’s goals is by increasing the blend percentage.
This year’s recession is likely to weaken demand further. Not only was the drop in growth historic, the work from home trend that the pandemic triggered could fundamentally alter commuting. Although public transportation demand has slowed, it is likely that at least some workers will work from home at least part time. That means the mandate will become even more difficult to meet. The administration is faced with displeasing two constituents—farmers and the oil industry. There is really no solution that will please both. So, we would not expect a resolution before November.
Often in political trends, we see an emerging development that faces a counter movement. In other words, “the Empire strikes back.” During the Reformation, for example, there was a counter-Reformation that eventually led to a kind of cold peace within Christendom. Sometimes, the countertrend only slows the emerging one. We may be seeing something in the latter with regard to oil energy. The current administration is pro-petroleum, but the broader societal trend is heading in the opposite direction. One item that tends to support this idea is that drilling activity remains soft even with the recovery in oil prices. Major oil companies are rethinking their long-term strategies and governments are nudging them in this direction. Whenever we observe potential inflection points, we try to look for items that both support and dispute the potential change in trend. For example, the U.S. has taken steps to open more of Alaska for drilling. If oil companies jump at the chance, the “death of oil” is probably premature. On the other hand, if no actions are taken, it would bolster the case that the oil industry is on a long-term downtrend. Here’s another bit of evidence contrary to the death of oil. Chevron (CVX, 89.48) is looking to invest in Iraq. If one thought that oil demand was going to decline, it is highly unlikely they would take the risk of drilling in a volatile political environment like Iraq. So, the jury is still out, although the weak performance of oil stocks overall would suggest that the death of oil trend may still win out. Another item supporting oil’s continued dominance is that the Democrats have removed language calling for the end of fossil fuel subsidies and tax breaks from the final party platform. At the same time, we have seen a surge in “green” equity performance, suggesting the trend against oil may be gaining momentum.
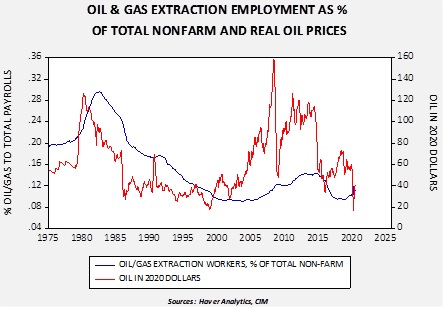
Working in the oil industry, like any profession, has its good and bad points. To the former, the work often pays very well. It also can be interesting, taking its workers to different parts of the world in challenging environments. Cutting edge technology is also part of the business. On the downside, it is brutally cyclical; when its good, its great, but the troughs can be difficult.
This chart shows the percentage of oil and gas workers to total non-farm payrolls compared to inflation-adjusted oil prices. As the chart shows, employment is sensitive to the price of oil.
A number of commodity industries are struggling to attract younger workers. The average age of farmers has been rising for some time. The reputation of the oil industry has been under pressure over the issue of climate change; it appears that younger workers are shunning the industry over those concerns. If this trend continues, the industry can only survive by improving productivity.
Although reducing carbon emissions is helpful in offsetting the potential impact of climate change, in reality, even if all carbon emissions stopped today, the existing levels will continue to affect the climate for decades. To truly reverse the impact of carbon in the atmosphere, we would need to remove the carbon that already exists. Scientists and engineers have been working for some time on such technologies. We note reports that Occidental Petroleum (OXY, 13.95) is working with privately held Carbon Engineering to build a carbon capture plant in the Permian basin. If this technology develops, it is probably the most promising route to dealing with climate change.
The Trump administration is attempting to trigger the “snapback” provisions of the Iran nuclear deal even after its withdrawal from it. The U.S. is claiming that it is still a “participant” despite its withdrawal and thus can request a return to earlier weapons embargoes that were part of the original agreement if Iran failed to comply. We doubt this will go anywhere, meaning that the conventional weapons ban will likely expire in October. It remains to be seen how the administration will react if states begin selling arms to Iran. Russia and China could both decide to sell arms to thwart U.S. goals with Iran.
On the afternoon of August 4, there was a massive explosion at the Port of Beirut. The explosion was one of the largest non-nuclear blasts in history, a seismic event with a magnitude of 3.3 on the Richter scale. At latest count, 220 have been confirmed dead, 110 are missing, and over 6,000 were injured.
The Middle East is undergoing significant change. The U.S. is clearly reducing its footprint, leading nations within and outside the region to adapt. The explosion occurred amid this evolving environment and it has the potential to be a catalyst to accelerate changes.
In this report, we will begin by detailing the event, followed by an examination of Lebanon’s political and economic backdrop to frame how these conditions contributed to the accident. The third section will discuss the U.S. withdrawal and the scramble by players both inside and outside the region to gain control or protect their interests. This discussion includes a look at the states affected by the machinations of others. As always, we conclude with market ramifications.
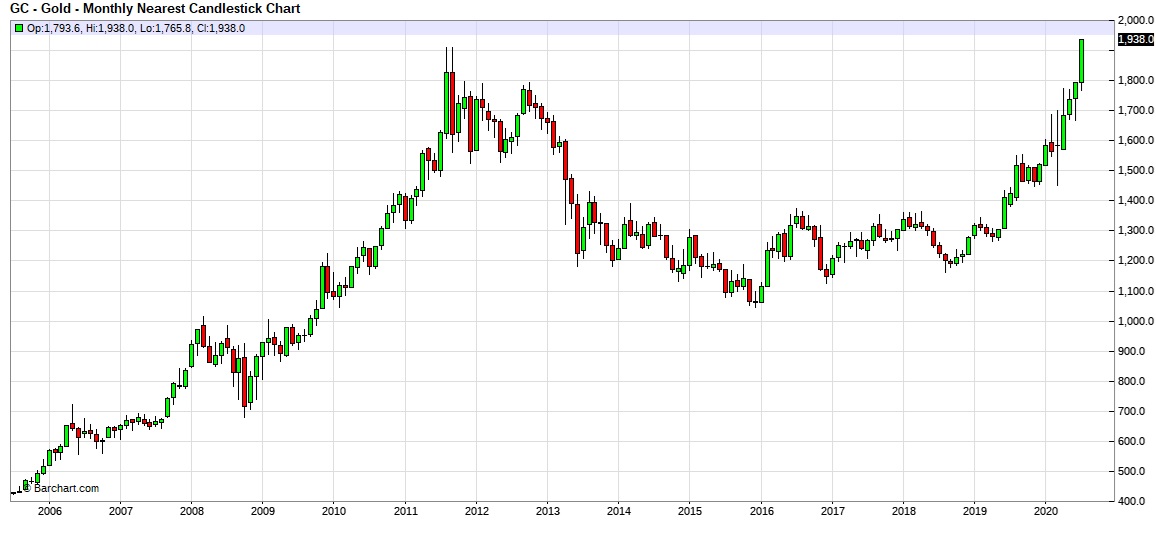
Precious metals prices have risen recently, making new highs.
(Source: Barchart.com)
This is a monthly chart for the nearest gold futures contract. As the chart shows, we have recently moved above the 2011 highs. In this report, we will discuss two areas that have supported this rise—the prevalence of negative real interest rates and a potential short squeeze on the futures market.
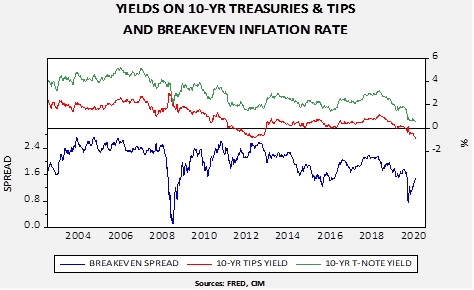
The Treasury Inflation Protected Securities (TIPS) are designed to provide protection against rising inflation. The security has a component where its value rises when inflation increases. It is possible to compare the Treasury yield relative to the TIPS yield to determine the “break-even” inflation rate; in other words, this is the market’s expectation of future inflation.
Note that the 10-year TIPS yield is now negative and the nominal yield on the 10-year T-note is mostly steady. To some extent, this suggests the market believes the Fed is already engaging in yield curve control. The combination of a falling real yield and a steady nominal yield means inflation expectations are rising.
These charts show there is a close relationship between the real 10-year yield and gold prices. In fact, they correlate at the -88.9% level.
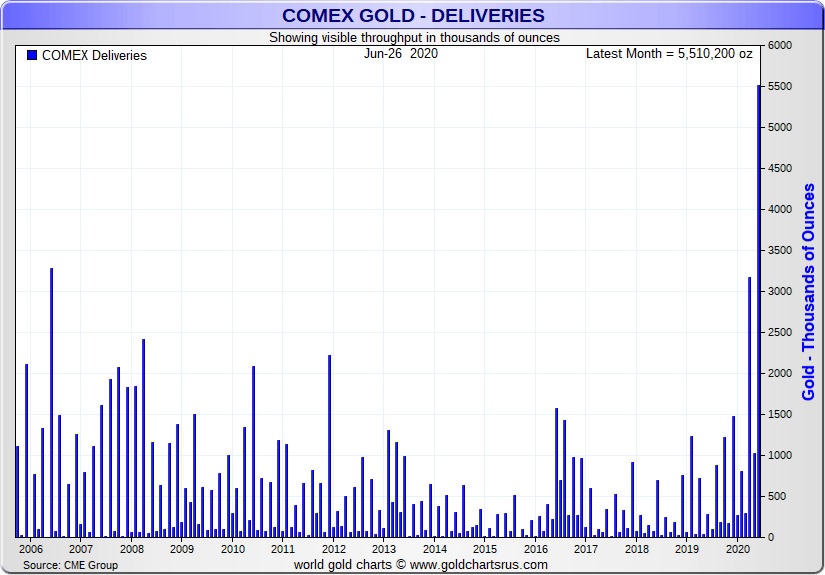
The second factor is a potential short squeeze in gold.
Recently, we have seen a rapid rise in gold delivery at the COMEX. Perhaps the most sophisticated process of buying gold is to buy a futures contract and take delivery. The buyer accepts a warehouse receipt at the COMEX exchange and pays a modest monthly fee for storage. The holder of the warehouse receipt can then short the futures and deliver the warehouse receipt back into the market when they decide to sell their holdings. This process solves a persistent problem for precious metals buyers—the transaction spread is narrow and the prices are fully transparent. The drawback for most investors is the 100 oz contract at the COMEX, which is a commitment beyond that of the small investor. Swap dealers who make markets between physical gold and the futures markets are not accustomed to this level of delivery and may have been caught short; if so, they will need to buy gold to deliver gold on their short positions. That may account for the recent strength we have seen in the market.
by Bill O’Grady, Thomas Wash, and Patrick Fearon-Hernandez, CFA | PDF
Here is an updated crude oil price chart. The oil market has stabilized at higher levels after April’s historic collapse.
(Source: Barchart.com)
Crude oil inventories fell more than anticipated, declining 4.5 mb compared to forecasts of a 3.7 mb decline. The SPR declined 2.2 mb as oil that was placed in the SPR for temporary storage is now being put back into the commercial system.
In the details, U.S. crude oil production fell 0.3 mbpd to 10.7 mbpd. Exports rose 0.3 mbpd, while imports fell 0.4 mbpd. Refining activity rose 1.4% but most of that was due to declining East Coast capacity.
Unaccounted-for crude oil is a balancing item in the weekly energy balance sheet. To make the data balance, this line item is a plug figure, but that doesn’t mean it doesn’t matter. This week’s number is +515 kbpd. Although the volatility of this number is elevated, the trend is slowly stabilizing.
(Sources: DOE, CIM)
The above chart shows the annual seasonal pattern for crude oil inventories. This week’s data showed another decline in crude oil stockpiles. We are approaching the end of the seasonal withdrawal period. Although the declines of the last few weeks are supportive, stockpiles remain well above seasonal norms and remain a bearish factor.
Based on our oil inventory/price model, fair value is $35.95; using the euro/price model, fair value is $63.51. The combined model, a broader analysis of the oil price, generates a fair value of $49.85. The wide divergence continues between the EUR and oil inventory models. As the trend in the dollar rolls over, it is bullish for crude oil. Any supportive news on reducing the inventory overhang could be very bullish for crude oil.
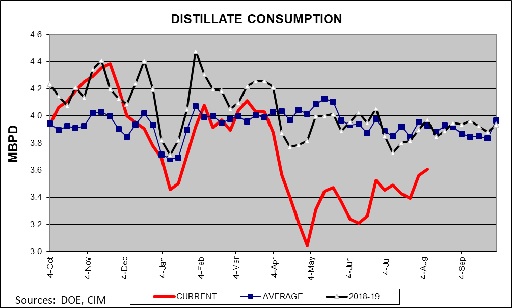
As we have noted recently, gasoline consumption has stalled. However, we are seeing some good news on the distillate front—demand is clearly recovering.
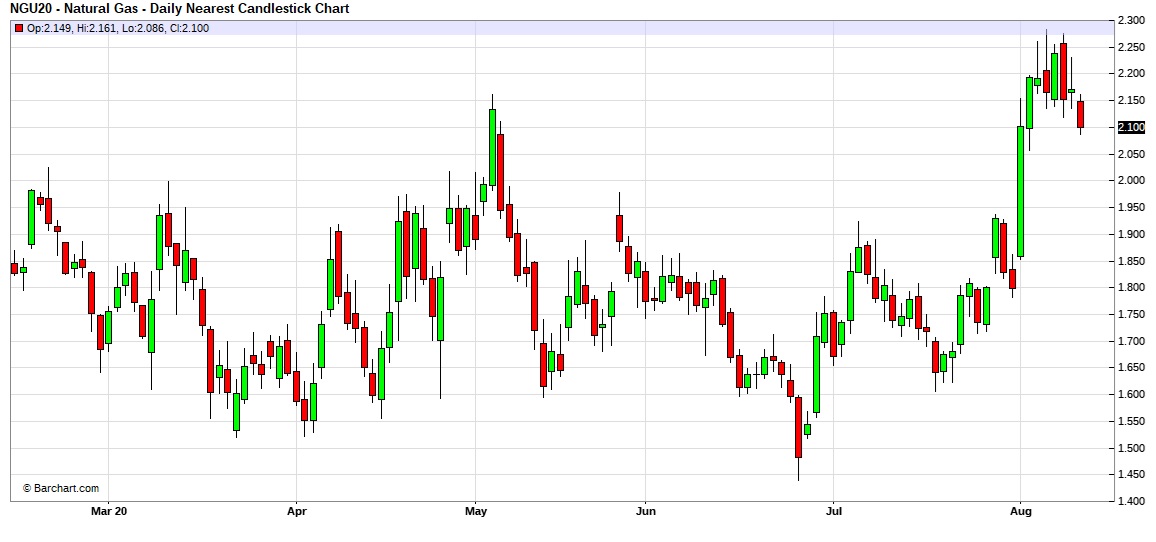
We have seen a surprising jump in natural gas prices.
(Source: Barchart.com)
As the chart shows, there was a huge rally in early August and prices have been consolidating since. The jump in prices occurred despite the persistent inventory overhang.
The rise in prices is probably due to expectations that falling crude oil output will reduce natural gas supplies. It is not unusual for oil drillers to discover natural gas (so-called “associated gas”), so when oil production is elevated, natural gas supplies increase almost as a byproduct.
Some of the suddenness of the price action was likely due to rising coastal temperatures, but the sustainability will really come down to winter weather. Current outlooks are bearish for prices.
We use cookies to ensure that we give you the best experience on our website. If you continue to use this site we will assume that you are happy with it.