by the Asset Allocation Committee | PDF
- Monetary and fiscal stimulus are expected to help propel the U.S. economy through recovery into expansion over our three-year forecast period.
- Global central banks have been, and should continue to be, excessively accommodative as the world emerges from lockdowns caused by the pandemic.
- Inflation numbers may appear stark over the next several months, but we expect overall inflation to settle below the Fed’s threshold over the full forecast period.
- The allocation to equities among all strategies remains elevated with an increased tilt toward value and an overweight to small capitalization stocks, where risk appropriate.
- More risk-tolerant strategies have a higher allocation this quarter to international stocks due to our expectations of overseas growth combined with the potential for a waning value of the U.S. dollar.
- Commodity exposure is retained across all strategies, with heavier concentration in the more risk-averse strategies.
ECONOMIC VIEWPOINTS
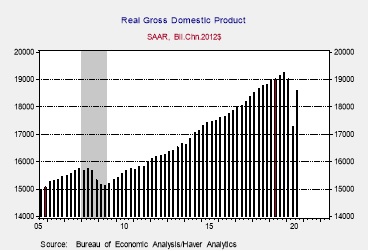
With the benefits of monetary and fiscal stimulus, we expect the U.S. economic recovery to gain momentum and become an outright expansion within our three-year forecast period. Therefore, prior to 2024, real GDP should exceed the pre-pandemic numbers compiled at the end of 2019. The Fed’s current posture of being excessively accommodative by keeping fed funds rates near the zero-bound and continuing to expand its balance sheet should continue through 2023, if not beyond. Along with the Fed’s monetary actions and the stimulus relief package enacted in the U.S. in early March, there is the potential for further stimulus in the form of infrastructure spending. Even if an infrastructure bill fails to pass, the fiscal benefits conferred upon household balance sheets and state and local budgets from March’s stimulus produce a heavy dose of support for substantial elements of the economy.
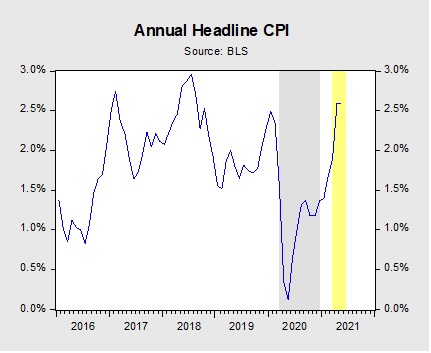
Although much has been written about inflation recently, with many market participants expecting a persistent upsurge, we expect inflation numbers to crest in the latter half of the year and prove transitory. The year-to-year comparisons will certainly be stark when released in the second and third quarters of this year. In addition, we believe current news items that are viewed as harbingers of inflation, such as semiconductor shortages and difficulties of finding truck drivers at affordable rates, will lend themselves to the rules of supply and demand and equilibrium prices will be reached. Accordingly, we don’t expect the Fed’s 2% target level to be broached for more than a few quarters and believe that core inflation will settle comfortably within that threshold over the full forecast period. However, as we stated last quarter, we believe that asset inflation will continue given Fed accommodation, fiscal stimulus, an economic recovery, and an abundance of cash among investors.
Echoing expectations for the U.S., we believe global economies will continue to recover, albeit with a lag to that of the U.S. The IMF recently revised its global growth forecast upward to 6%, in excess of the OECD’s estimate of 5.6% in mid-March. Much of the improvement is forecast for the latter portion of the year, when, for example, the EU’s €750 billion recovery fund is expected to be distributed. Helping to make the prospects for growth on the continent more durable is the EU’s €1.1 trillion multi-year budget that extends to 2027, with at least half earmarked for modernization. Similar monetary and fiscal accommodations are being adopted throughout not only the developed world, but also in many emerging markets.
A final element that leads to our domestic and global recovery and expansion thesis is the potential unleashing of pent-up demand by consumers stemming from a post-COVID-19 reopening. Vaccine rollouts, although uneven, are progressing. As of mid-April, the Financial Times daily vaccine tracker indicated a first dose of 58.8 people per 100 residents in the U.S. and 23.1 in the EU. The U.K. was even further ahead at 60.6, while Japan lagged significantly at 1.4. In essence, developed economies are pushing toward an easing of lockdown restrictions, leading to elevated consumer sentiment with positive implications for economic activity.
STOCK MARKET OUTLOOK
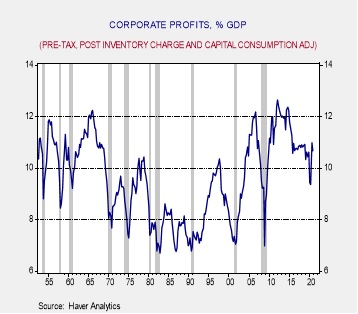
Due to our positive economic outlook, we believe elevated exposure to risk assets such as equities is warranted. With the retrenchment last year, annual earnings comparisons will appear stunning over the next several quarters. Beyond this year, corporate profits should remain at double-digits as a percentage of GDP. We expect the combination of monetary accommodation by the Fed, a fiscally permissive federal government, and elevated business and consumer sentiment to create an appealing backdrop for equities. Although higher inflation at the back end of this year may temper equity prices at some point, over our three-year forecast period we expect inflation will remain subdued, thereby helping P/E ratios stay elevated.
Despite positive prospects for equities overall, we expect that returns will be uneven, favoring cyclical entities that typically perform well as a full recovery gains traction. Last year, we began to orient the Asset Allocation strategies toward a more cyclical posture with an overweight to the Industrials and Materials sectors. Earlier this year, we augmented that posture by adding an overweight to Financials and a tilt in favor of value at 60% versus 40% for growth, which we further reinforced this quarter through an additional lean into value at 65%. While we are not anticipating the entire growth equity complex to retrench, there are a number of entities that have stretched valuations and are arguably overbought. In contrast, we believe that opportunities abound in the more cyclically exposed companies, which encourages our increased overweight to value. Regarding market capitalizations, we note that the S&P 500 may not harbor the greatest potential over the next three years as it has morphed into more of a mega-cap growth index. Rather, market performance is broadening, mimicking the economy, which underscores our belief that smaller capitalization, cyclically exposed companies hold greater potential at this stage of the economic cycle. As a consequence, U.S. small caps are heavily represented in the strategies where we find them to be risk appropriate.
Beyond the U.S., equity valuations in developed and emerging markets are compelling, especially given the prospect of a weaker U.S. dollar. For U.S.-based investors, a decline in the value of the dollar relative to other currencies acts as a strong tail wind. As alluded to in the Economic Viewpoints section of this document, we believe that developed market economies, particularly the EU and U.K., are lagging the U.S. recovery by roughly six months and are poised for growth. The EU fiscal stimulus in the form of an enormous multi-year budget, the monetary stimulus stemming from the €750 billion issuance of EU debt to finance their recovery fund, and the benefits conferred on the euro as a competitive currency through the issuance of this debt all operate to produce favorable conditions for European equities. As a result, we retain elevated allocations in the more risk-averse strategies and increased in the others, where there is now an overt emphasis on U.K. stocks. With regard to emerging markets, relative valuations have become more attractive this year, encouraging an increased weight to this asset class in the more risk-accepting strategies. As concerns surrounding Chinese equities persist, the increased allocations to emerging markets in these strategies use an ETF that excludes mainland Chinese equities.
BOND MARKET OUTLOOK
An extraordinarily accommodative Fed in conjunction with a strong economic recovery has sown the seeds of inflationary concerns among many investors. Although we acknowledge that somewhat persistent inflation is a possibility, our base case is that a spike in reported inflation over the next two quarters will prove to be transitory and core CPI will soon return to levels below the Fed’s 2% target. In the event that inflation is elevated for a longer period of time, or the efforts of bond vigilantes take hold, the Fed could engage in a form of yield curve control. In this event, the combination of quantitative easing and forward guidance would likely lead to a lower and flatter yield curve. Either case encourages a slight relaxation of the short-duration posture we previously held. Moreover, steepening of the yield curve beyond three years of maturity over the past eight months has increased the utility of bonds, with intermediate maturities as a foundation in the more risk-averse strategies.
Spreads on corporate bonds have continued to narrow relative to Treasuries since this time last year, reflecting investors’ acceptance of credit versus duration risk. Although our expectation is for corporate spreads to remain tight over our three-year forecast period given an economic recovery and expansion, we reduced overall corporate exposure relative to both Treasuries and mortgage-backed securities (MBS) due to the less appealing risk/return potential of corporate bonds. In contrast, we increased MBS exposure owing to our expectations for prepayment speeds to remain low, rates to remain relatively stable, and the Fed’s continuing purchases of MBS as part of its balance sheet expansion.
OTHER MARKETS
The valuations among REIT segments have become varied, with the more recent entrants to the category, such as data centers and cell towers, outperforming, while the more traditional segments of offices, retail, and hospitality are disproportionately affected by the consequences of the pandemic. Although the more traditional segments hold promise in a recovering economy and REITs are still attractive as a varied source of income, they were removed from all strategies with growth as a component. Our belief that data centers and cell towers are fully valued combined with our healthier expectations for more cyclically oriented, smaller capitalization companies encouraged the reallocation in these strategies.
Commodities continue to be used across the spectrum of strategies, with heavier allocations to the more risk-averse strategies. These strategies also continue to hold a position in a broad basket of commodities containing a majority weight to energy components such as crude oil, natural gas, and heating oil, as well as industrial metals. An allocation to gold is included in all strategies given its appeal in a world where excessive monetary accommodation prevails and serves as a haven in the event of geopolitical difficulties. Unchanged from last quarter is the position in silver in strategies designed for growth as we believe it is risk-appropriate and its industrial uses make it attractive in an economic recovery.
Read the full report