

Lorem Ipsum is simply dummy text of the printing and typesetting industry. Lorem Ipsum has been the industry’s standard dummy text ever since the 1500s, when an unknown printer took a galley of type and scrambled it to make a type specimen book. It has survived not only five centuries, but also the leap into electronic typesetting, remaining essentially unchanged. It was popularised in the 1960s with the release of Letraset sheets containing Lorem Ipsum passages, and more recently with desktop publishing software like Aldus PageMaker including versions of Lorem Ipsum.
Author: Rebekah Stovall
Business Cycle Monitor – May 2016
Lorem Ipsum is simply dummy text of the printing and typesetting industry. Lorem Ipsum has been the industry’s standard dummy text ever since the 1500s, when an unknown printer took a galley of type and scrambled it to make a type specimen book. It has survived not only five centuries, but also the leap into electronic typesetting, remaining essentially unchanged. It was popularised in the 1960s with the release of Letraset sheets containing Lorem Ipsum passages, and more recently with desktop publishing software like Aldus PageMaker including versions of Lorem Ipsum.
Daily Comment (May 18, 2016)
by Bill O’Grady and Kaisa Stucke
[Posted: 9:30 AM EDT] There are two items of interest this morning, which are linked. First, worries about the Fed moving rates higher are starting to rise. Fed funds futures are now projecting a 12% chance of a hike in June. Although this level remains low, it is up from 4% a week ago. Comments from San Francisco FRB President Williams and Atlanta FRB President Lockhart indicating that two hikes are in the pipeline for this year hit the market yesterday afternoon. It should be noted that neither of these two regional presidents are voters this year. Tomorrow, NY FRB President Dudley and Vice Chair Fischer, who are permanent voters, will speak. Dudley has been reliably dovish but Fischer is another matter. At heart, Fischer appears to back a Phillips Curve-influenced view of the world and thus should lean toward raising rates. Fischer’s stance will likely be the deciding factor at the June meeting because it will be hard for Chair Yellen to offset his weight on the committee if he swings his vote for a rate hike.
We are starting to see the markets react.
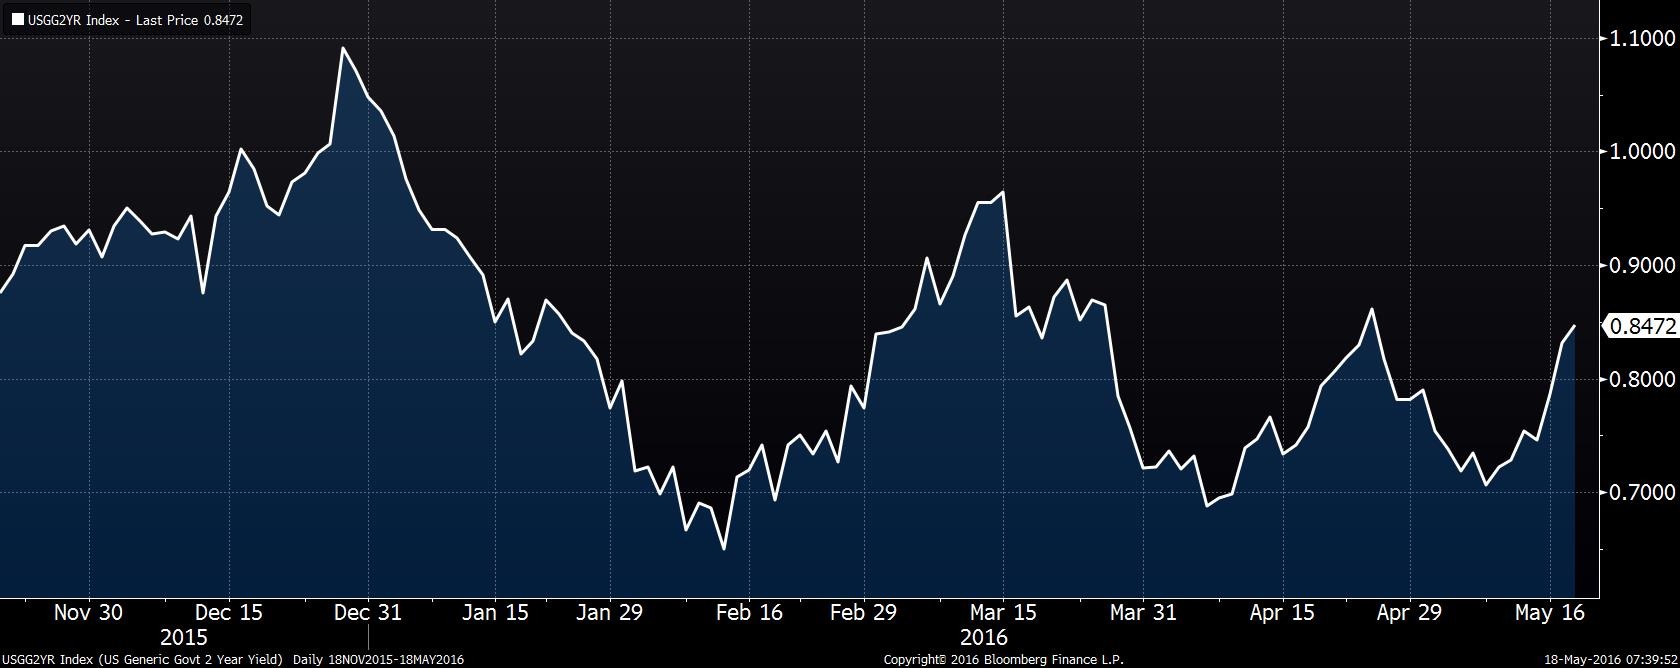 (Source: Bloomberg)
This chart shows the yield on the two-year Treasury. It has been steadily rising after falling from late April into early May. This rate is consistent with a fed funds target of 50 bps, implying that the market is building expectations of a rate move. As noted below, the Fed minutes are out later today, which may give us some color on the odds of a hike next month.
Although all the financial markets will be affected by a tightening of Fed policy, exchange rates may be the most sensitive. Since the last G-20 meeting three months ago, there has been speculation that a deal was put in place to stabilize currencies. According to this narrative, China did not want to see a stronger CNY so it prevailed upon the U.S. to back away from tightening talk. This led to a weaker dollar and the CNY stabilized because the CNY is mostly pegged to the greenback. At the same time, both the ECB and the BOJ refrained from further aggressive easing measures, leading to some dollar weakness against both currencies. The weaker dollar helped gold but really supported oil, easing credit conditions in the U.S. and helping China stabilize. The losers? Europe and Japan, especially the latter. The BOJ and the Ministry of Finance have been making rumblings about pushing fiscal policy in Japan, which, given the degree of QE, might be monetary financing of fiscal spending (which we discussed over the past three weeks in the WGR).[1] If the Fed really wants to raise rates, the dollar’s retreat gives Yellen room to move. At the G-7 meeting this weekend, where China won’t participate, we may see this “gentleman’s agreement” on forex break down. If so, the JPY and EUR could weaken, emerging markets will be at risk and commodity prices would likely retreat.
Finally, a poll this morning suggests 55% of U.K. voters favor remaining in the EU. This gave the GBP a lift.
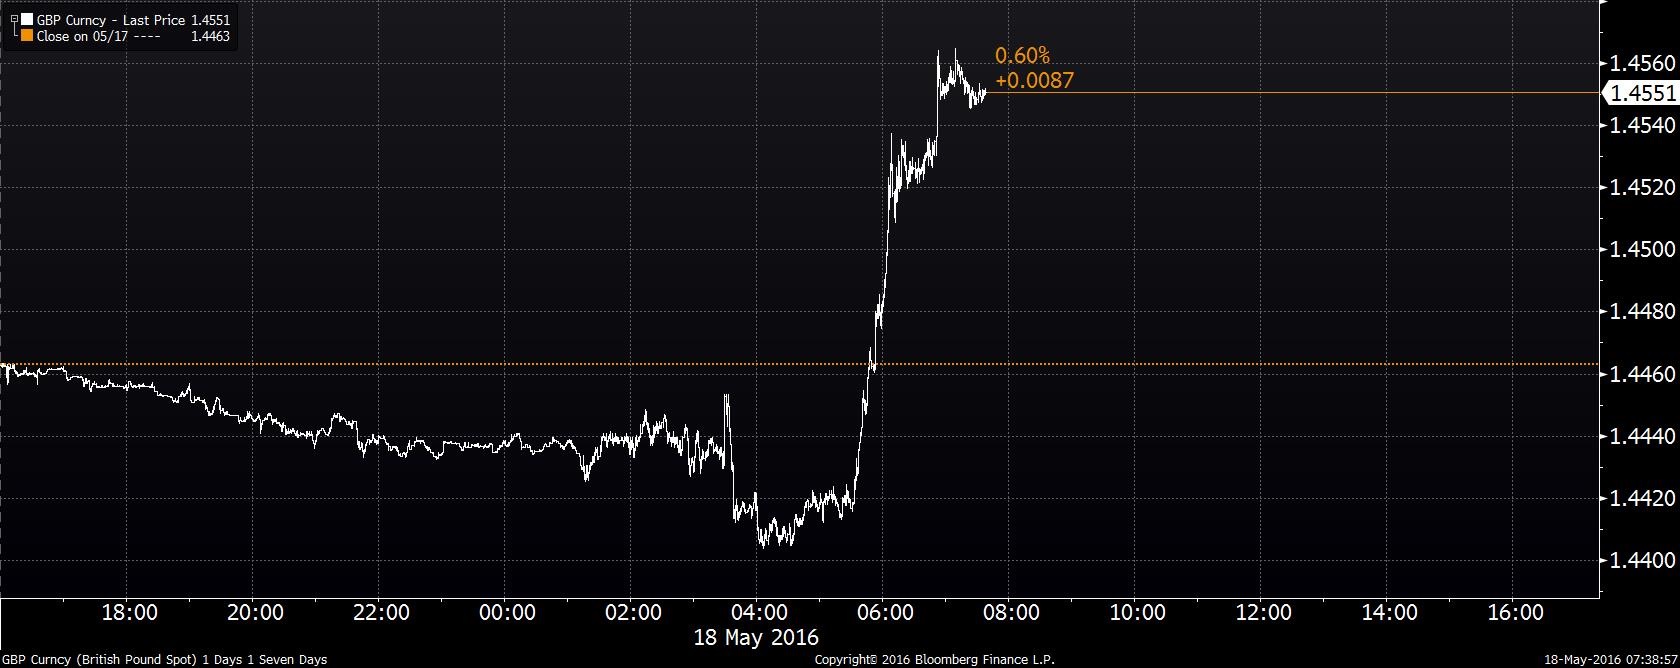 (Source: Bloomberg)
This is a one-day chart of the £/$ exchange rate; when news of the poll broke, the GBP rallied strongly. If the polls lean toward remaining as we move into the FOMC meeting next month, the committee may assume the U.K. will stay and this situation would increase the odds of a rate hike.
_______________________
[1] See WGRS, The Geopolitics of Helicopter Money: Part 1 (5/2/16); Part 2 (5/9/16); and Part 3 (5/16/16).
Daily Comment (May 17, 2016)
by Bill O’Grady and Kaisa Stucke
[Posted: 9:30 AM EDT] After a strong rally yesterday, we are seeing some consolidation this morning. There is lots of news this week, with a full lineup of U.S. economic data today (see below), Fed minutes tomorrow and a G-7 meeting over the weekend. The latter will be quite interesting. Japan wants permission from the rest of the G-7 to weaken the JPY, which it probably will not get. Recently, the Treasury tightened its oversight of the currency markets and is creating a new procedure to call out developed nations that it deems to be manipulating its currency. Although we don’t know if this will create material changes in U.S. foreign exchange policy, the groundwork does appear to be in place. Japan needs a 120 ¥/$ exchange rate, but it doesn’t appear that the other six nations in the G-7 are in alignment with this goal. If the G-7 rebuffs Japan, it will be interesting to see if Japan acts alone. We tend to think Japan probably will.
The FT is reporting that China’s curbs on outflows will reduce residential real estate buying in North America and elsewhere. On the West Coast, from San Diego to Vancouver, local reports indicate a steady and strong influx of Chinese homebuyers which has tightened markets and boosted prices. If this story is accurate, that situation is poised to ease.
The Treasury unexpectedly released Saudi Arabia’s direct Treasury holdings after not detailing them for 41 years. The Treasury doesn’t have rules on its disclosures and some nations may use custody holders in the Caribbean, the U.K. or Belgium for some of their holdings, which will tend to understate the actual ownership. Last month, Saudi Arabia, angry about proposed legislation that would allow the victims of the 9/11 terrorist attacks to sue the kingdom, threatened to sell its $700+ bn of Treasury holdings. This is mostly an idle threat; we doubt the market would struggle to find buyers and, in an emergency, the Fed could simply buy the bonds and expand its balance sheet. The official value of the kingdom’s Treasury holdings is only $116.8 bn. Given that its total reserves are $587.1 bn, this would mean only 19.9% of its reserves are in Treasuries. We suspect the number is much higher and being held by custody holders.
We are much more interested in the Obama administration’s decision to publish the actual holdings. The decision by the Ford administration to group the OPEC nations together when publishing their Treasury holdings appeared to be an agreement among allies to reduce the visibility and transparency of Saudi Arabia’s holdings. In the 1970s, the level of “petrodollars” in the U.S. banking system raised fears that the oil producers would “own” the U.S., and we suspect the decision not to detail the data was designed to address those concerns. Thus, the decision to now reveal the data probably further signals that relations between the kingdom and the U.S. have cooled and that the administration is no longer concerned about the American public’s attitude toward Saudi Arabia.
Venezuela announced it has restructured its debt with China. The Chinese have lent Venezuela $50 bn, much of which is paid with oil. Although the overall terms of the loans are not known (parts have been previously restructured), in 2010, Venezuela was sending 0.5 mbpd to meet loan terms. Estimates suggest this may now be as high as 1.0 mbpd. In theory, as the price of oil declines, China could demand more oil to meet loan payments. We don’t know if this is the case now; the Maduro government is claiming that China has relaxed its terms, which we find hard to believe. China typically doesn’t do that. If China did ease terms, it may have done so because it is very worried that the government may be on the verge of collapse. If it does collapse, it would be short-term bullish for oil prices. In February, Venezuela was the third largest foreign source of oil to the U.S.
Weekly Geopolitical Report – The Geopolitics of Helicopter Money: Part 3 (May 16, 2016)
by Bill O’Grady
Two weeks ago, we described the process of “monetary funded fiscal spending” (MFFS), including a discussion of why it might be implemented, how it would work and the potential problems that could come with using it. Last week, we examined two historical examples where forms of MFFS were implemented, Japan in the 1930s and the U.S. during WWII. In the final segment of this series, we will make some observations based on the two historical examples discussed last week. We will then discuss the likelihood of MFFS being deployed in today’s world, focusing on which nation is most inclined to use it. As always, we will conclude with market ramifications.
Daily Comment (May 16, 2016)
by Bill O’Grady and Kaisa Stucke
[Posted: 9:30 AM EDT] Oil prices are surging this morning as short-term outages dominate the news. Conflict in the Delta region of Nigeria has reduced production by 0.6 mbpd. Although Canadian production does appear to be returning, the recent outages will likely lead to inventory declines in the U.S. for at least the next couple of weeks. As we have noted, the seasonal withdrawal period for crude oil is about to start and we will likely see the supply situation improve over the summer. At the same time, the current price has already discounted a drop of about 50 mb in U.S. commercial crude oil stockpiles, so the supply situation will have to improve even more to see prices continue to lift.
Unfortunately for oil, and for other markets as well, there is a lurking danger. Despite numerous comments from regional FRB presidents suggesting that a rate hike could occur in June, fed funds futures put the odds of a hike at 4%. At the same time, we are seeing the yield curve continue to flatten.
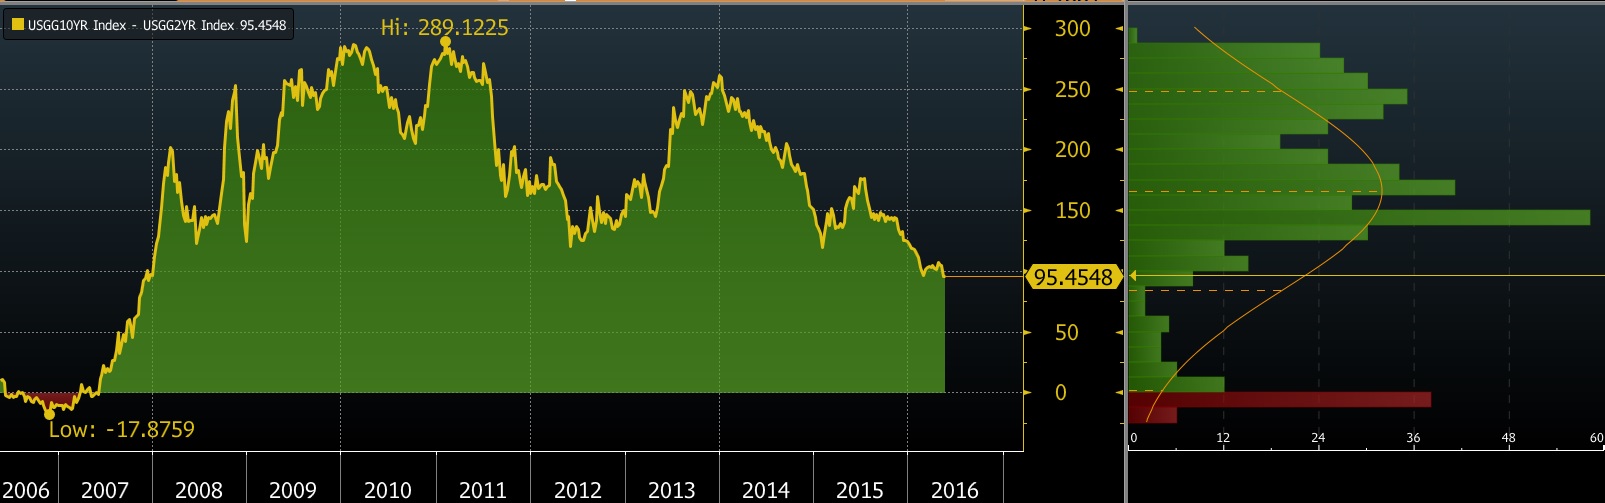 (Source: Bloomberg)
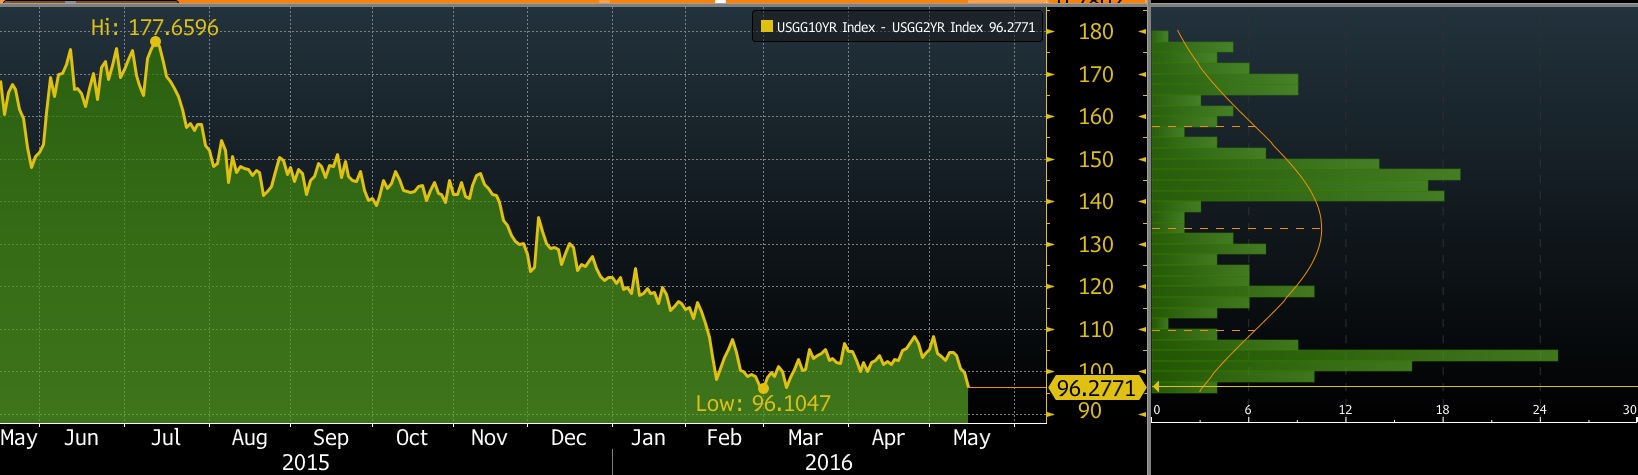
This chart shows the two-year to 10-year T-note spread, which hit its narrowest point since late 2007. Although we have 95 bps to go to invert the curve (a near certain signal of recession), the narrowing is a worry. Most of the narrowing is coming from the long end of the curve, which is likely benefitting from foreign inflows; with much of Europe and all of Japan sporting negative sovereign yields, the U.S. looks pretty attractive on a relative basis.
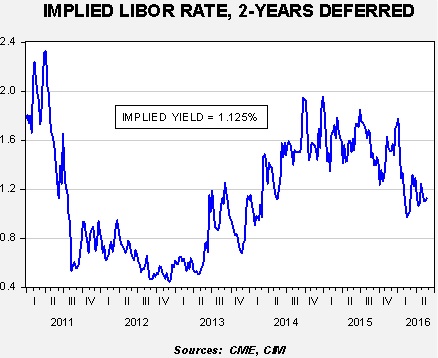
The implied two-year LIBOR rate has not moved significantly higher, which tends to indicate that the markets expect a low terminal policy rate.
Here is where our worry lies. When five-star doves like Chicago FRB President Evans and Boston FRB President Rosengren argue that the financial markets are underestimating the odds of a rate hike, it suggests that support for stable policy is weakening. In general, we assume that three dissenters among the voting members of the FOMC are akin to a no-confidence vote for the chair. At this point, among the 10 voters, Bullard (St. Louis), George (KC) and Mester (Cleveland) would probably support a rate hike. If Rosengren, usually a reliable dove, is leaning toward a hike, you could potentially have four dissenters. Among the permanent voters, only Fischer would probably prefer to tighten, although we don’t see him voting against the chair. Still, there is enough uncertainty to seriously question the 4% likelihood of a hike that is currently being discounted by fed funds futures.
The GDPNow data from the Atlanta FRB is suggesting a rather robust jump in Q2 growth, especially in relation to Q1.
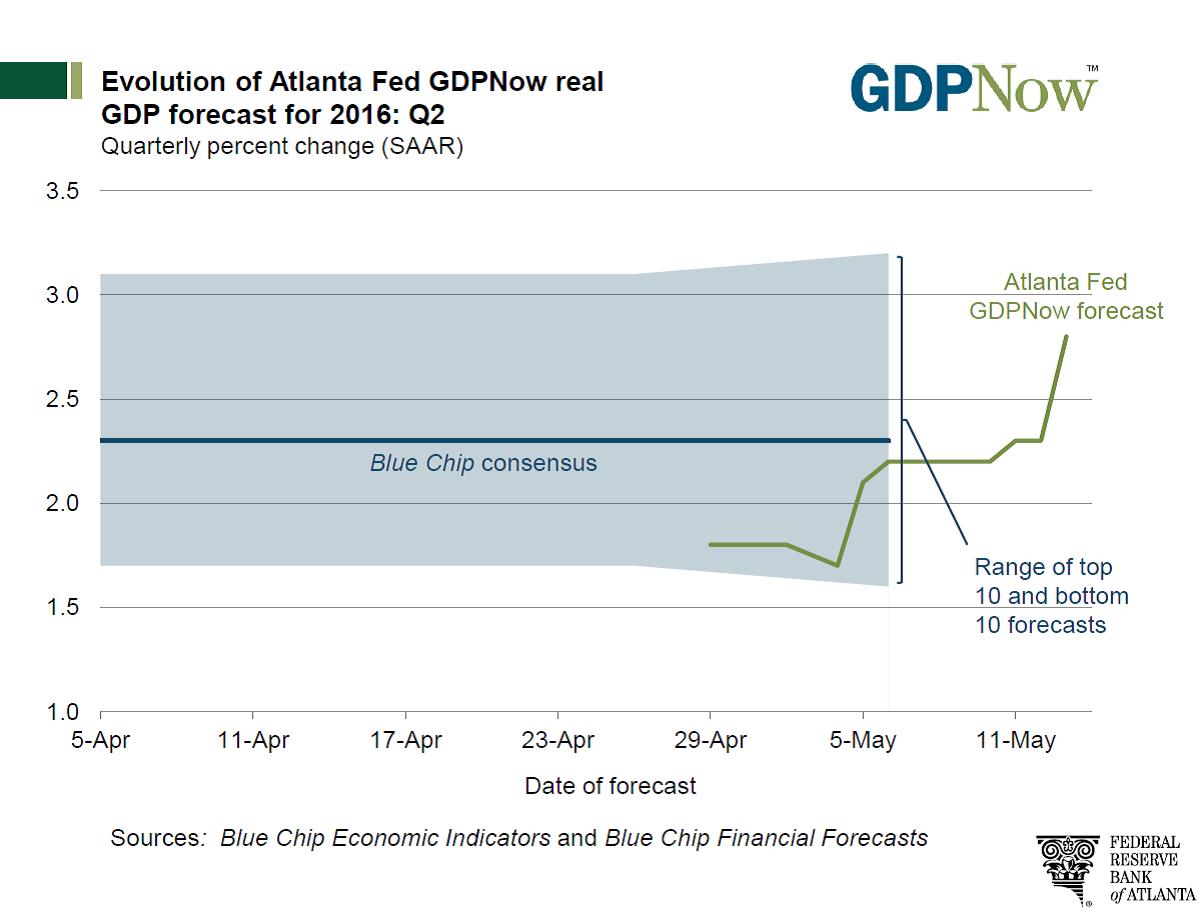
Here are the component changes.
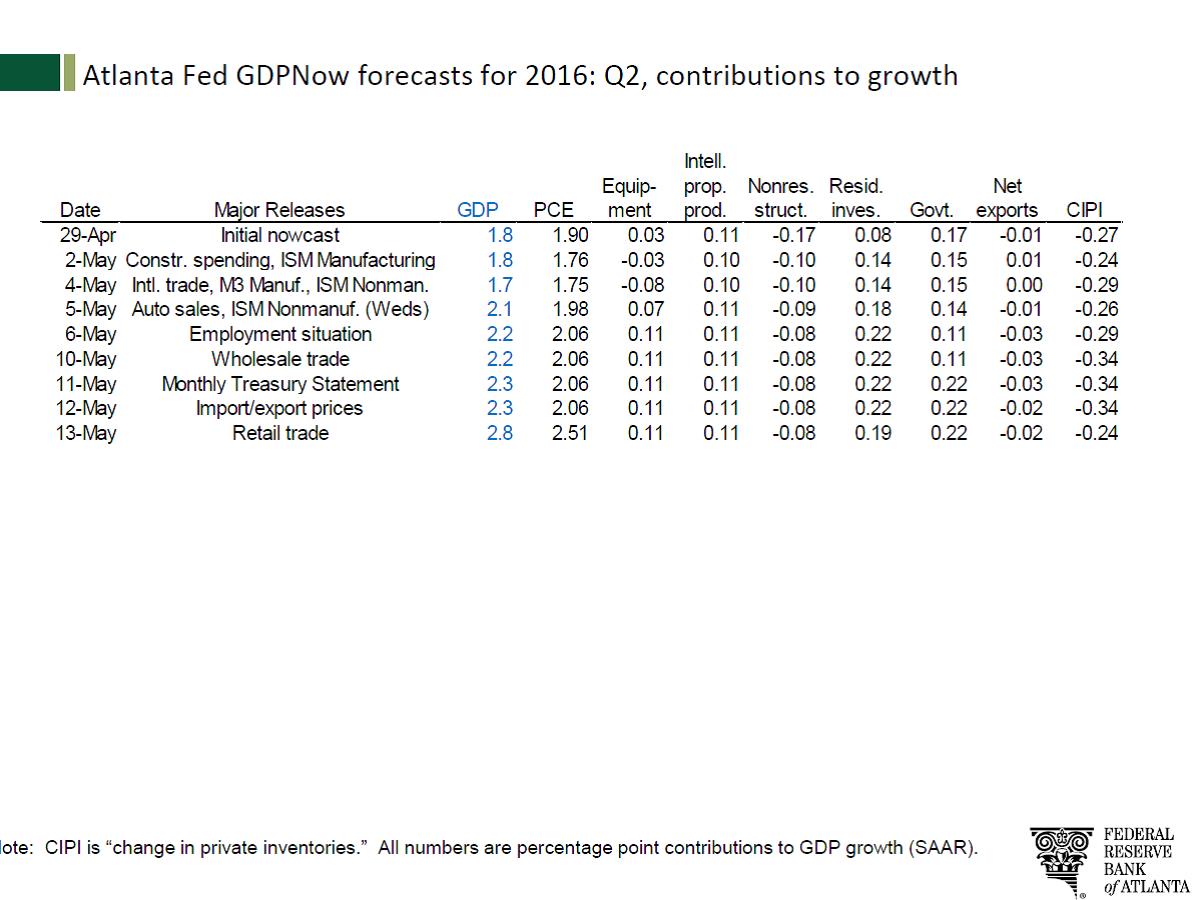
Of the 100 bps rise since the initial forecast, 61 bps are coming from consumption alone, which was reflected in the recent retail sales report. Of the remaining 39 bps, residential investment, adding 11 bps, accounts for over a quarter of the rest.
The case for standing pat is strong. International developments remain a worry (today’s China data is adding to worries) and U.S. industrial data is soft (see today’s Empire State report). On the other hand, all our Mankiw model variations support a rate hike. The dollar, which was much stronger, has retreated, giving the Fed room to hike. The real worry is that a rate hike would be a complete surprise to the financial markets and unnecessarily raise market volatility.
This discussion brings us back to oil…if the Fed unexpectedly raises rates and the dollar rallies (which would be highly likely), oil prices are vulnerable to a pullback. That doesn’t mean a collapse to the sub-$30s lows, but perhaps a drop into the low $40s or high $30s. It also means the dollar would strengthen and emerging markets would be vulnerable to a pullback.
Asset Allocation Weekly (May 13, 2016)
by Asset Allocation Committee
With Donald Trump and Hillary Clinton becoming the presumptive nominees for the Republican and Democratic Parties, respectively, this week’s Asset Allocation Weekly will offer some of our initial thoughts on this election cycle. We will offer more in-depth analysis in the coming months but these highlights express our starting points about the candidates and the election.
This election is shaping up to be establishment versus populist: As we discussed in our three-part series on the election in the spring of 2014,[1] we noted a rising trend of populism in the U.S. that could lead to a populist candidate and president. Donald Trump is running as a classic “traitor to his class” by supporting populist positions such as anti-globalization (anti-immigration, anti-trade) and support for middle-class entitlements (Social Security, Medicare, Disability). These positions are in direct opposition to the establishment’s positions on free trade, open immigration and entitlement reform. Sen. Clinton finds herself as the establishment candidate, which has been well exposed in her primary campaign against Sen. Sanders. In Europe, both the right- and left-wing establishments tend to coalesce around one establishment figure to fend off a populist challenge. If we see a similar pattern in the U.S. (which we would expect), look for talk about a third-party “real conservative” challenger to dissipate soon. Otherwise, if a third-party establishment figure runs, it will simply split the vote and allow Trump to win easily. Instead, we look for the right-wing establishment to either stay home or vote for Sen. Clinton. In any case, unlike in most elections, there will be major differences between the candidates which will probably lead to historic voter turnout.
Domestic Policy: If you liked the last eight years, you should vote for Sen. Clinton. She is running a campaign similar to what a vice president runs when he is trying to succeed a sitting two-term president. Although this didn’t appear to be her initial plan, the surprising performance of Sen. Sanders has forced her to defend President Obama’s policies to frame her opponent as being too radical and she has used Sanders’s criticism of President Obama to suggest that he is denigrating the current Democratic Party president. This means she really can’t run on a domestic policy platform that aims to fix all that has gone wrong and allows Mr. Trump to claim that current conditions are bad and that a new policy stance, which he would provide, would make things better. Since many Americans claim things are bad,[2] it makes Sen. Clinton’s position difficult to defend.
This election will likely be determined by Sen. Sander’s supporters: In 2014, Ralph Nader published a book titled Unstoppable.[3] In the book, he argues that populists on both the left and right have a common cause around which to unify and overthrow the political establishment. As we noted in our aforementioned WGRs, the establishment supports deregulation, globalization and the unfettered introduction of new technology. Although these policies are very successful in bringing down inflation through supply side efficiency, they have the effect of holding down wage growth that harms most populist households.[4] Nader acknowledges that there are major disagreements between left- and right-wing populists on social issues. However, on economic issues, the differences are significantly less and the two sides could find common ground. If Sanders’s voters decide that Donald Trump can improve their economic situation and swing toward him, he has a solid chance for victory. If Trump can, at a minimum, discourage Sanders’s supporters from voting for Sen. Clinton, he will improve his odds of winning. Although we doubt Ralph Nader had Donald Trump in mind when he penned his book, Trump may be best positioned to bring Nader’s coalition of populists together. This may be even more evident in foreign policy (see below).
Foreign policy is about be flipped: Sen. Clinton is hawkish; she supported the invasion of Iraq, a much heavier military presence in Syria and the overthrow of Muammar Gaddafi. Using Walter Russell Mead’s archetypes,[5] Sen. Clinton is a Wilsonian. She believes that the U.S. is a source of good in the world and that using military force is legitimate in order to protect the weak or support goals like democracy in the world. Trump is a Jacksonian; this archetype can be belligerent but only if the national honor is besmirched. Trump has indicated that we will give up our superpower duties[6] by forcing European and Asian allies to pay for their own defense. At the same time, he is promising a major boost in military spending to ensure that “nobody messes with us,” a classic Jacksonian position. On the one hand, Trump promises that we won’t be drawn into wars to protect others; on the other, he would likely order the U.S. Navy to shoot on sight any Russian warplanes buzzing around U.S. vessels. The differences between Trump and Clinton offer an unusual shift for voters; neoconservatives who currently are part of the GOP will be inclined to vote for Clinton, while those who oppose U.S. hegemony will tend to find Trump’s “America First” message appealing. In terms of foreign policy, Sanders’s supporters have much more in common with Trump than Clinton.
The debates could be historic: Trump has proven to be an effective debater, a brawler that tends to force opponents to operate at a base level. For example, Sen. Rubio ended up in a verbal sparring match more suitable for a middle school; however, Trump operates well in such situations while most politicians don’t. Rubio didn’t…and neither did Governor Bush. Sen. Clinton has a wonkish grasp of policy that will far exceed Trump’s knowledge. But, if he forces her into his “alley,” the results could be devastating. The debates could be the most watched television outside the Super Bowl and may swing the campaign.
Next week, we will discuss the market impact of a Trump presidency and the asset allocation measures we would likely consider. The following week, we will examine a Clinton presidency and perform the same drill.
______________________
[1] See WGRs: 2016, Part 1 (3/31/2014); 2016, Part 2 (4/14/2014); and 2016, Part 3 (4/21/2014).
[2] On average, 66% of those polled think the country is going in the “wrong direction,” see: http://www.realclearpolitics.com/epolls/other/direction_of_country-902.html.
[3] Nader, R. (2014). Unstoppable: The Emerging Left-Right Alliance to Dismantle the Corporate State. New York, NY: Nation Books.
[4] We define the differences between populists and establishment in the aforementioned WGRs.
[5] See WGR, 4/4/2016, The Archetypes of American Foreign Policy: A Reprise.
[6] See WGR, 4/11/16, Intergenerational Forgetfulness.
Daily Comment (May 13, 2016)
by Bill O’Grady and Kaisa Stucke
[Posted: 9:30 AM EDT] As noted below, there was an interesting divergence between Q1 Eurozone GDP growth and German GDP growth. The former was revised lower to 0.5% (2.0% annualized for the quarter), while German GDP was revised higher to 0.7% (2.8%) from 0.6% (2.4%). Spain also grew strongly, up 0.8% (3.2%). France (0.5%; 2.0%) and Italy (0.3%; 0.9%) were the laggards. The pickup in German growth is particularly good news for the Eurozone economy. Germany’s strong saving has led to large trade surpluses that have been offset by trade deficits in the rest of the Eurozone (at least with regard to internal Eurozone trade). Rising German growth means that the rest of the Eurozone can export goods and services to Germany, which will tend to boost their economies and relieve some of the debt problems in the region.
The Obama administration announced another set of regulations on the fracking industry designed to reduce the amount of methane that escapes into the atmosphere during the drilling process. These new regulations will undoubtedly raise the costs of drilling. The government and industry dispute the actual amount, with the EPA arguing it will cost the industry $530 mm into 2025; the API suggests this number probably should be doubled. In any case, the real takeaway is that the regulatory process usually works with a lag. A new technology or process often can work without little regulatory oversight because the government hasn’t seen it long enough to determine whether it should face regulation and how it should be done. However, the longer the new process is in place and the bigger it gets, the more likely it is to face regulatory scrutiny. For the pioneers in the industry, the influx of regulation is jarring because they were able to initially operate with little interference. The bottom line: the U.S. oil and gas industry will be facing increasing regulatory costs regardless of who wins in November. This development may not be bullish for oil and gas companies but it is undoubtedly bullish for the price of the commodity—regulation will act to constrain supply.
The better than forecast retail sales data (see below) has led to a flattening of the yield curve.
 (Source: Bloomberg)
The spread is approaching the lows set in late February. The flattening of the curve is a form of monetary tightening and is bearish for equities.
Daily Comment (May 12, 2016)
by Bill O’Grady and Kaisa Stucke
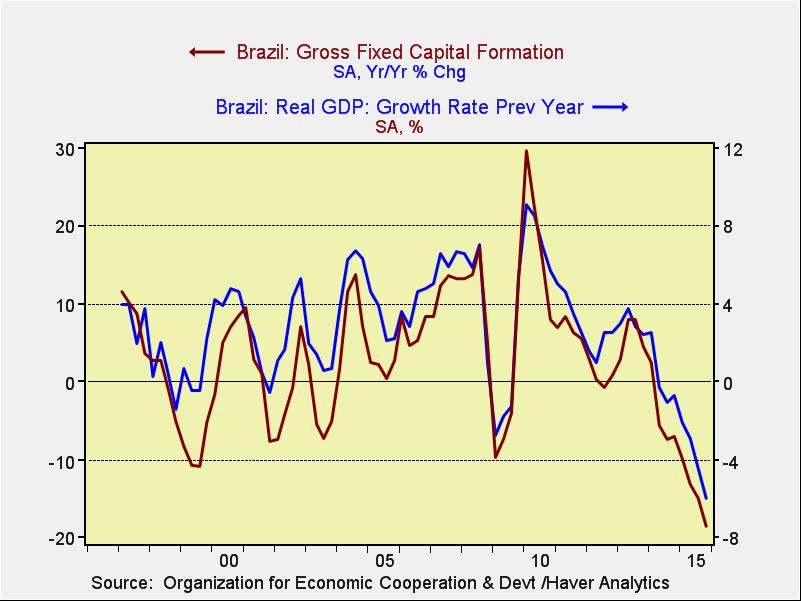
[Posted: 9:30 AM EDT] As expected, the Brazilian Senate voted 55-22[1] in favor of an impeachment trial against President Rousseff. She will step down from power today and VP Michel Temer will take power. A trial will be held over the next 180 days. It ends with a Senate vote. If less than two-thirds vote to impeach, Rousseff will be reinstated. Given that 55 votes are enough to impeach, it appears likely that Rousseff will be removed from power.
The financial markets have turned higher in recent months on the prospect of impeachment. The feeling is that Temer will be better for the economy than the left-leaning Rousseff.
 (Source: Bloomberg)
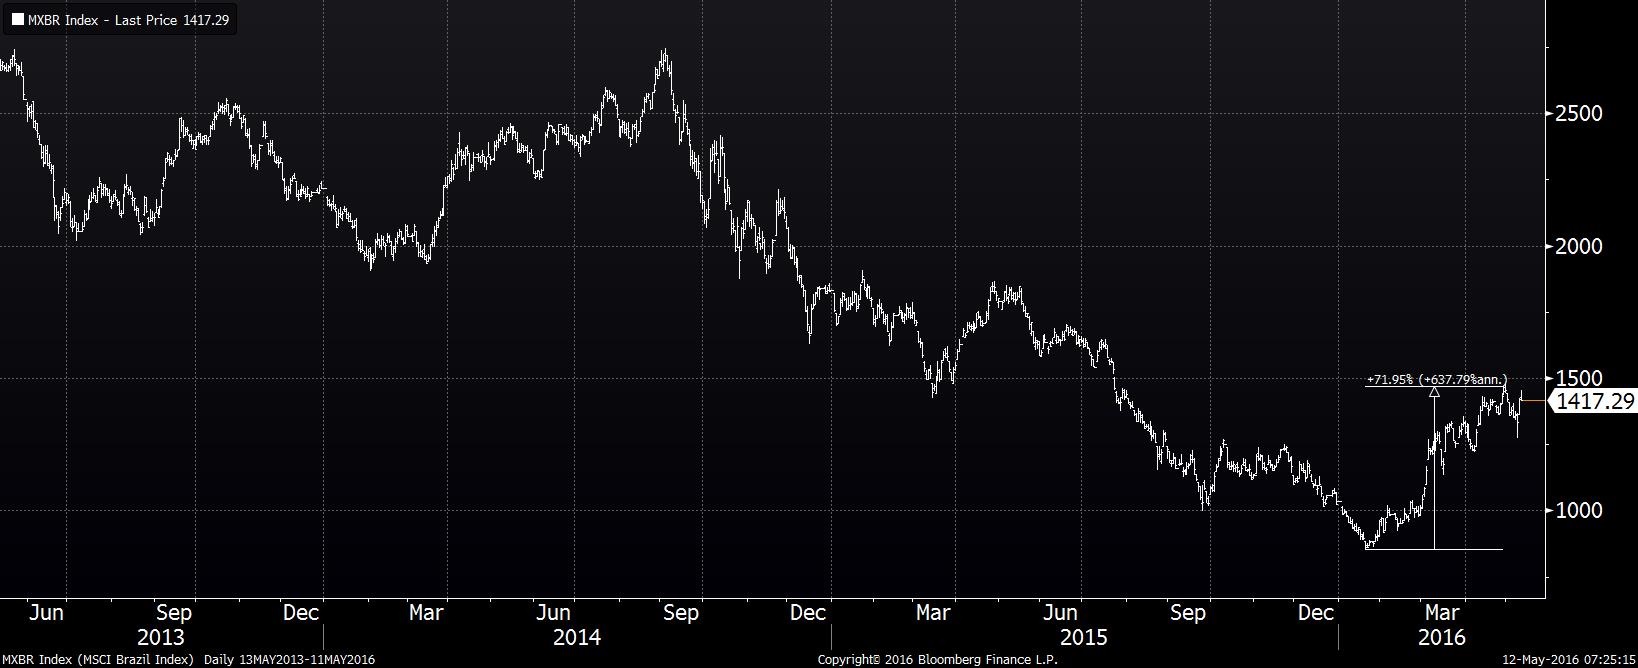
This chart shows the MSCI Brazil index in USD terms. Since early January, the index is up nearly 72% from low to high. The market has already discounted much of the good news from impeachment. Brazil has serious economic problems; GDP is exhibiting negative growth, paced by a plunge in investment spending.
Overall, we would not be surprised to see a bit of “buy rumor, sell fact” market action with Brazil in the next few weeks.
Oil prices are higher again this morning, supported by a bullish International Energy Agency (IEA) report (more on the IEA below). The group cut its H1 oil surplus due to stronger Indian demand. Its projected surplus is now 1.3 mbpd, down from 1.5 mbpd in the previous report. The IEA is projecting demand of 95.9 mbpd this year, up 0.1 mbpd. Non-OPEC production is forecast to fall 0.8 mbpd, mostly due to falling U.S. output. OPEC output continues to rise, reaching its highest level since August 2008. It appears that OPEC output will rise further as the group focuses on increasing market share. In the short run, outages in Libya, Nigeria and Canada are boosting prices.
The U.S. inventory situation continues to improve as stockpiles declined last week. Current stockpiles are 540 mb. We expect that last week’s report, at 543.4 mb, will prove to be this year’s peak.
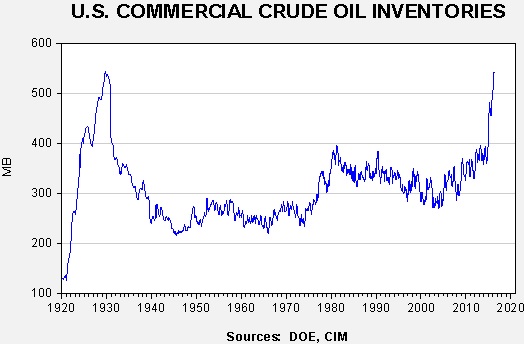
Historically, inventories remain elevated. However, inventories are clearly lagging the usual seasonal pattern.
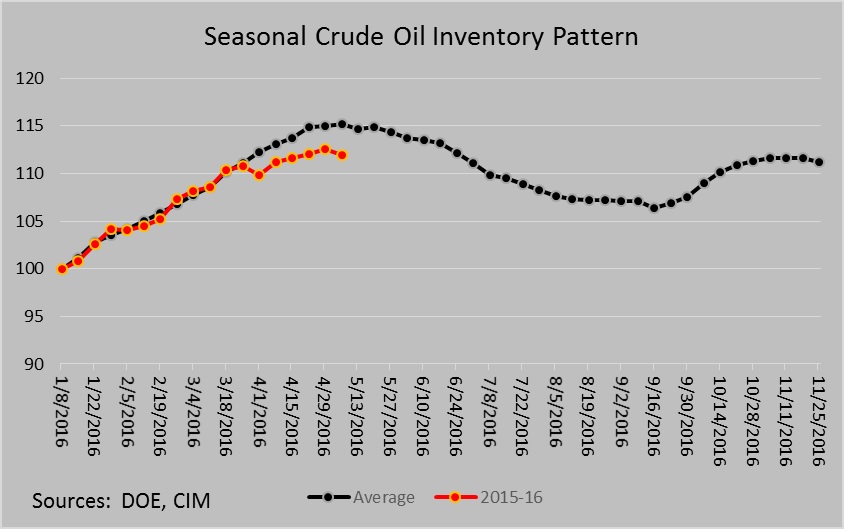
The current level is consistent with early July, improving the odds that we will see faster than normal stock draws. We are currently about 2.1 mb below where the average would put us. If that level is maintained, we will be at 498 mb by mid-September.
However, it is important to remember that the dollar is playing a bigger role in determining oil prices.
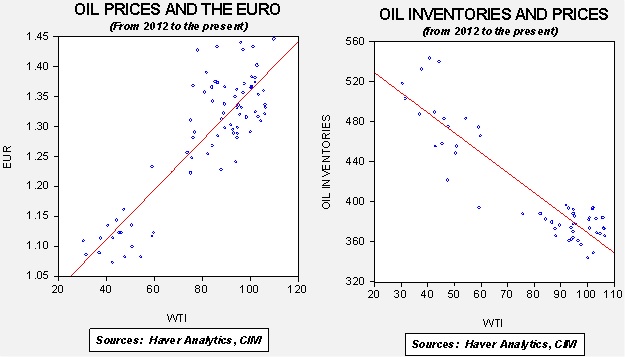
Based on inventories alone, oil prices are profoundly overvalued with the fair value price of $25.82. Meanwhile, the EUR/WTI model generates a fair value of $54.61. Combined correlation (which is a more sound methodology) fair value is $41.39, meaning that current prices are a bit rich. Still, for those interested in oil, the Fed is arguably more important than the DOE inventories for the future of oil prices. Simply put, a rate hike in June would likely lead to a much stronger dollar and weaker oil prices. For example, a $1.100 EUR/ USD would generate a fair value for oil of $34.53, assuming current inventories. We don’t expect the FOMC to move rates higher next month, but it is a risk to oil prices.
A couple of other news items affecting oil have emerged over the past two days. First, the IEA, a body within the OECD that monitors the oil markets and OPEC, is considering breaking away from the OECD. The IEA is currently an autonomous organization within the OECD. The IEA dispute with the OECD appears to center around China. The OECD has not accepted China as a member even though it is the world’s largest importer of crude oil. The OECD is uncomfortable with the IEA’s drive for independent relations with China. This news is more than just a bureaucratic spat. Although it is not well known, the IEA is the world body that, in a global oil supply emergency, takes legal control of the OECD’s strategic petroleum reserves (SPR).[2] If we end up in a situation where this action is required and the IEA isn’t part of the OECD, it may be difficult for the IEA to exercise control. Thus, this isn’t a huge problem now but it could be in the future and, if it becomes a problem, it would be occurring at the worst possible moment.
The second item of note is that Belarus has delivered the Russian S-300 anti-aircraft, anti-missile defense system to Iran. Given that Belarus is mostly a puppet of the Putin regime, having an ally sell the system offers a thin veil of plausible deniability. This system is considered one of the world’s most potent anti-aircraft missile systems. The fact that Iran has acquired this system will reduce Israel’s ability to bomb Iran’s alleged nuclear system; however, it won’t completely eliminate the threat. It is thought that the F-35, which has stealth capabilities, may be able to elude the S-300. The Israeli Air Force reportedly has 33 of these aircrafts on order. Still, the presence of this system will increase the costs of attacking Iran’s potential nuclear facilities.
Finally, Germany is poised to increase its troop numbers for the first time since the Cold War. The reason given for this reversal of 25 years of force reduction is growing Islamic terrorism, instability in Africa and Russia’s new assertiveness. However, we suspect underlying this decision is the growing realization that the U.S. will probably reduce its presence in Europe and force the EU to build its own defense. Polls in Germany show that 45% of its citizens back the decision to increase troop strength, up from 15% seven years ago. This decision, along with the proposal to boost defense spending, is both minor and major. Even with proposed spending, Germany’s defense budget won’t reach 2% of GDP, the guideline for NATO nations. On the other hand, the symbolism of Germany increasing its defense footprint is important and will likely raise concerns in Europe. This decision probably doesn’t happen without the perceived change in U.S. policy.
_______________________
[1] There are 81 senators; 4 were absent.
[2] We have always had our doubts about this system. It seems hard to imagine that taxpayer-funded oil supplies in Germany or the U.S. would be directed to Brazil or Portugal because of a global supply shortage. Although this would be the most effective way to manage global oil prices as it would prevent hoarding, practically, we would not expect the IEA to be able to effectively control the national SPR.