Asset Allocation Weekly (July 15, 2016)

by Asset Allocation Committee

Since the recovery began, we have consistently favored duration in fixed income.  Our position has been that growth would remain sluggish in the developed world and global overcapacity would keep inflation contained.  The consensus of strategists and economists didn’t support our position.

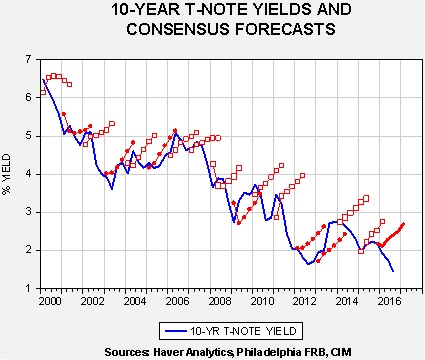
This chart shows the path of the 10-year T-note yield along with the forecast at the beginning of each year from the Philadelphia FRB Professional Forecasters Survey.  The open boxes indicate when the forecasts were incorrect; the solid circles indicate correct forecasts.  We are on the 17th forecast; so far, 10 have been wrong and, barring a strong jump in yields similar to 2012, the forecasters will be incorrect this year as well.

In general, the persistently incorrect forecasts are likely due to the consensus opinion that the economy, inflation and markets will normalize over some time frame.  Instead, since the turn of the century, inflation has steadily declined and, in the aftermath of the financial crisis, economic growth has been persistently low.  Accordingly, financial markets and global economies have been operating in a “new normal” rather than a return to the 1990s normal.

Although our position on fixed income has been correct, we are watchful for conditions that would reverse this long-term downtrend in yields.  Inflation trends often have a political element.  One of the key tradeoffs society makes is between equality and efficiency.[1]  When society is leaning toward the latter, bonds will tend to do well because inflation will be controlled.  If equality is demanded, the risk levels of bonds rise.  Thus, we are carefully watching Brexit, Bernie Sanders and Donald Trump.  These are all manifestations of a potential trend toward equality that would likely be expressed by re-regulation and deglobalization of the economy.  If these trends, and others, gain traction, the potential for rising inflation and interest rates would increase.  For now, we continue to favor long duration assets.  Given the high level of binary risks looming (the process of the U.K. leaving the EU, November U.S. elections, the Italian referendum on government reform and its banking problems), long duration Treasuries offer some protection against bearish events, as the Brexit situation showed.  But, we are closely monitoring economic and political conditions for a change in the secular trend in bonds.

View the PDF

_________________________

[1] For a discussion on efficiency and equality cycles, see our recent WGR: Post-Brexit (7/11/16).

Daily Comment (July 14, 2016)

by Bill O’Grady and Kaisa Stucke

[Posted: 9:30 AM EDT] Equities are higher this morning on expectations of continued support from policy stimulus.  Although the BOE disappointed (see below), the BOJ looks like it is moving steadily toward direct BOJ financing of fiscal spending, otherwise known as helicopter money.  Japan remains mired in near-deflationary conditions and the JPY has been strengthening lately.  This rise has been exacerbated by a stealth depreciation of the CNY, making Japan’s exports less competitive compared to a key competitor in Asia.

This chart shows the JPM real effective exchange rates of China and Japan.  For most of this year, Japan’s exchange rate has been strengthening while China’s has been weakening.  Japan will not tolerate this situation indefinitely.  For some perspective, note the chart below.

The vertical line shows Abe’s election win in late 2012.  Note how the general trend has been for the JPY to weaken and the CNY to appreciate.  This year has seen a reversal in that trend and we suspect that the Abe government wants to push back against this year’s exchange trends.  As we have noted before, one of the primary effects of helicopter money is a sharp depreciation in the exchange rate.  If China reacts against this, the exporting of deflation to world markets will accelerate.

The BOE surprised the markets to some extent by keeping policy steady.  There were general expectations for a cut.  The vote was 8-1, with the dissenter calling for a cut of 25 bps.  The BOE did indicate that a cut in August is possible but, given the uncertainty surrounding the May government and Brexit, in general, the BOE decided to wait before acting.  The GBP rose sharply on the news.

(Source: Bloomberg)

This is the intraday chart on the £/$ exchange rate in USD per GBP.  The pound jumped on the news of no change in rates.

The U.S. crude oil inventories fell a bit more than forecast, dipping 2.6 mb versus estimates of a 2.3 mb decline.

This chart shows current crude oil inventories, both over the long term and the last decade.  We are starting to see inventories decline, but normal levels would be below 400 mb, some 130 mb lower than now.

So, obviously, inventories remain elevated.  Inventories have been lagging the usual seasonal pattern.  We are in a period of the year when crude oil stockpiles tend to fall at an increasing pace.  The pace of declines will slow in the coming weeks as we are halfway through the summer driving season.

It is important to remember that the dollar is playing a bigger role in determining oil prices.

Based on inventories alone, oil prices are profoundly overvalued at a fair value price of $34.98.  Meanwhile, the EUR/WTI model generates a fair value of $47.07.  Together (which is a more sound methodology), fair value is $40.80, meaning that current prices are a bit rich.

Perhaps the bigger worry is product supplies.  Gasoline inventories are also quite elevated and, with the end of the summer driving season in sight, it appears we will head toward Labor Day with a significant overhang of stockpiles unless refineries cut production, which will dampen crude demand.

This chart shows the current level of gasoline inventories along with last year’s levels and the five-year average.  Current stocks are 25.3 mb above average for this time of year.  This high level of gasoline stocks is occurring despite robust consumption levels.

This chart shows weekly gasoline consumption on a rolling four-week average for the current year, last year and the five-year average.  The chart clearly shows that consumption is outpacing last year and the average.  However, the chart also shows that we only have about another month of elevated demand before the autumn slowdown begins.  Although we are not wildly bearish oil at this time, a pullback into the low $40s would not be a major surprise.

Finally, the lead story in today’s FT reports that the Obama administration is lodging a formal complaint against China at the WTO over China’s export restrictions on key metals, such as copper and cobalt.  These restrictions create an artificially low price market for these raw materials and give companies that use these metals an advantage in global trade.  We suspect this action is being taken to placate an electorate becoming increasingly jaded with globalization.

View the complete PDF

Daily Comment (July 13, 2016)

by Bill O’Grady and Kaisa Stucke

[Posted: 9:30 AM EDT] It was another quiet overnight session.  Equities continue to be well bid; as noted above, so far, earnings are coming in better than expected.  Of course, as our AAW discusses this week, the data we track daily comes from Thomson-Reuters, meaning that they are probably overstating the strength of earnings in the current situation.

In London, we are awaiting two events.  First, Theresa May will be appointed PM today, and second, the BOE is expected to cut rates tomorrow by 25 bps.  We view May’s appointment as an important signal for policy; this will be the topic of next week’s WGR.  On the BOE, we believe Governor Carney is quite worried about the economic impact of Brexit and thus will err on the side of excessive stimulus.  The sharp drop in the GBP is a form of monetary support so adding rate cuts to the recent depreciation should offer the U.K. economy some significant help.

The other stimulus situation we are following closely is Japan.  Bloomberg is reporting that the Abe government is considering at least partial direct BOJ funding of fiscal stimulus, colloquially known as “helicopter money.”[1]  By directly funding fiscal spending, the public debt load does not rise.  The downside is that this leads to a permanent rise in the money supply and will almost certainly lift inflation and weaken the JPY…which, of course, is exactly what Abenomics is trying to accomplish.  As we noted in the reports in the footnote, we expected that the first developed world nation to experiment with direct funding of fiscal spending would be Japan.

The IEA released its monthly report on the oil markets and, unlike recent comments, the study was less upbeat on prices.  The OECD group is concerned that global demand is showing signs of slowing as the Chinese economy slumps.  Although oil inventories have fallen, product stockpiles are high and rising and, at some point, refiners will be forced to cut production which will reduce oil demand.  The IEA did note that non-OPEC production is falling but also reported that OPEC output has reached an eight-year high, boosted by rising Saudi production.  The Saudi plan for OPEC (read: Saudi Arabia) to lift market share continues to play itself out in the oil markets.

View the complete PDF

__________________________

[1] See WGRs: The Geopolitics of Helicopter Money, Part 1 (5/2/16), Part 2 (5/9/16), and Part 3 (5/16/16).

Daily Comment (July 12, 2016)

by Bill O’Grady and Kaisa Stucke

[Posted: 9:30 AM EDT] The most important news for investors is that, despite everything, equity markets around the world are gaining strength.  This improvement is coming despite slowing earnings growth, sluggish economic activity, Brexit, an adverse ruling against China on its maritime claims, U.S. elections, etc.  Why the strength?  Most likely the same reason that has lifted equities all along—supportive monetary policy.

This chart models the S&P 500 (monthly average) against the Fed’s balance sheet.  Since the recovery began, the U.S. equity markets have closely tracked the size of the Fed’s balance sheet.  Since the FOMC has ended its expansion of the balance sheet, the market has mostly moved in a sideways trading range.  We are starting to see a modest breakout, but it would not be a surprise if equities fade a bit from here.

On the other hand, the combination of Brexit and unstable employment data has removed almost any chance of FOMC tightening.  We do expect some brave talk about “September being on the table” and the like, but the financial markets don’t believe it for a minute.  With the potential for turmoil this autumn tied to the U.S. elections, we doubt the Fed will have any desire to inject itself into that debate.  At the same time, it looks like Abenomics 2.0 is about to be unleashed; this version will be more fiscal in nature but will rely on the BOJ to fund the expansion.  The ECB should remain accommodative and the BOE is expected to cut rates tomorrow.  In addition, the PBOC is supporting the Chinese economy, too.  Overall, the central banks appear to be in accommodation mode, which is bullish for risk assets across the board.  In the U.S., two major fears for equities have been eliminated as uncertainty eases around Brexit due to Theresa May’s win and the Fed remains on the sidelines due to uncertainty surrounding employment.

All this points to the potential of a “melt up.”  With low bond yields and zero to negative rates on cash, equities remain attractive, at least on a relative basis.

This chart shows the level of retail money market funds held along with the S&P 500.  In general, since 2011, the base level of money market funds held runs between $900 to $950 bn.  During market pullbacks, cash accumulates (the direction of causality cannot be determined—in other words, does raising cash weaken stocks or do weaker stocks lead to higher cash levels as investors sell?); as cash is redeployed, equities recover.  Current cash levels are above the upper end of the recent range, suggesting that there is ample liquidity available to propel equities higher in the short run.

The longer term danger of a stronger stock market is that it’s doubtful it can be supported by robust earnings growth.  As this week’s AAW discusses below, even the veracity of earnings is in question due to the divergence between Thomson-Reuters and Standard & Poor’s earnings numbers.  If earnings don’t keep up, the rally will come from multiple expansion.  Low interest rates support multiple expansion but it also means that equities could become “priced to perfection.”  Thus, we are in rally mode now but we are worried it will be difficult to sustain over time.

View the complete PDF

Weekly Geopolitical Report – Post-Brexit (July 11, 2016)

by Bill O’Grady

On June 23rd, voters in the U.K. shocked global markets by voting to leave the EU.  In this report, we will examine the various paths the country may take in the coming months with regard to this issue, discuss the political lessons learned and the impact Brexit will have on other European nations.  As always, we will conclude with the potential impact on markets.

Brexit—Now What?
In the aftermath of the Brexit vote, PM Cameron announced he would be stepping down in September and the ruling Conservatives will select a new prime minister.  Over the past week, the Tories, who are members of Parliament (MPs), voted on potential replacements for Cameron.  The party started with five candidates and, through party voting and resignations, that group has narrowed to Home Secretary Theresa May.  Energy Minister Andrea Leadsom pulled out of the race today.  May is a member of the “remain” camp but has indicated that she will respect the will of the people expressed in the referendum vote.  Leadsom supported the “leave” campaign.  Thus, her exit from the campaign does have an impact on whether or not Brexit actually occurs.  It is unclear at this point, even though May is the only remaining candidate, whether the party will hold a membership vote in September to formally select her as the new prime minister.

View the full report

Daily Comment (July 11, 2016)

by Bill O’Grady and Kaisa Stucke

[Posted: 9:30 AM EDT] There is a lot of political news this morning, all of it from abroad.

Leadsom quits: The race to replace PM Cameron ended this morning when Energy Minister Andrea Leadsom quit the race, leaving Home Secretary Theresa May as the only remaining candidate.  Almost immediately, the GBP rallied as did U.K. equities.  In this week’s WGR, we discuss the post-Brexit situation.  One of the key points of our analysis is that the referendum was not the final word; Reuters reports today that over 1,000 prominent British lawyers have signed a letter, delivered to PM Cameron, stating that invoking Article 50 of the EU Charter can legally only come from an act of Parliament.  Simply put, it is quite possible that the U.K. never actually leaves the EU.  Although May has indicated that “Brexit is Brexit,” she supported the Bremain campaign and it would not be a surprise to see her press for a vote in Parliament to thwart the results of the referendum.  This may require an election to pull off, but the bottom line is that Brexit, if it does actually occur, may be months or years away.

Abe wins: In Sunday elections, PM Abe’s LDP won a clear majority in the upper house, gaining over two-thirds of the seats.  This power will allow Abe to press ahead with constitutional revisions.  Although there is great concern that Abe will try to end Japan’s pacifist constitution, we doubt he will make this move without a stronger economy.  There is talk of fiscal expansion; again, we doubt this will be the end of it.  According to reports, former Fed Chairman Bernanke is visiting Japan to meet with officials today.  As we noted in our WGR series on direct central bank financing of fiscal spending, or “helicopter money,” we argued that the first nation most likely to deploy this funding program would be Japan.  This vote brings that possibility closer.

Tribunal judgment tomorrow: The International Tribunal for the Law of the Sea at The Hague is set to announce its verdict on the Philippines’ claims that China has violated the law based on its “nine-dash line,” where China claims virtually all of the South China Sea.  It should be noted that the claim is not over competing sovereignty issues but over maritime rights attached to each claim.  It is expected that the tribunal will rule in favor of the Philippines.  China has already indicated that it will not abide by the tribunal’s ruling, arguing it lacks jurisdiction.  The U.S., which is not a signer of the Law of the Sea Treaty but generally abides by its rules, is the only power capable of enforcing the court’s claims if they are adverse to China’s goals.  The U.S. has increased its naval presence to signal to China not to react aggressively to the ruling, but escalating tensions cannot be ruled out.

The financial markets are reacting positively to the news out of the U.K. and Japan.  Risk assets, such as equities, commodities and foreign currencies, are rallying while safety assets, such as gold and Treasuries, are retreating this morning.  Although May’s “coronation” is initially positive for risk markets as it reduces the odds that Brexit is actually implemented, her mandate is less secure by not having a leadership vote.  Thus, she may need an election to actually secure a mandate.  Not only could she run to oppose Brexit, but elections would further delay an Article 50 declaration.  Anything that puts off Brexit is bullish for the GBP.

View the complete PDF

Asset Allocation Weekly (July 8, 2016)

by Asset Allocation Committee

One of the great characteristics about working in financial services is that there are always surprises.  Recently, we came across a situation in the S&P earnings data that we had not noticed before.  It is well known that earnings have two variations—as reported and operating.  As reported earnings include all costs.  Thus, the cost of shutting down a factory or an adverse legal judgement reduces earnings.  However, it could be argued that these costs are nonrecurring and don’t accurately reflect the costs of the ongoing business.  Operating earnings exclude nonrecurring expenses.

What surprised us is that there are at least two sources for operating earnings, Standard and Poor’s and Thomson-Reuters.  At times, the two series diverge.

This chart shows the two operating earnings series along with the ratio of the two numbers on the bottom of the chart.  About 28% of the time, the ratio is 1.05 or greater, indicating that the Thomson-Reuters operating earnings numbers are about 5% higher than the S&P operating earnings report.

There are two issues to examine.  First, it is apparent that the Thomson-Reuters numbers are usually higher than the S&P data; there are only 22 out of 90 quarters where the S&P number was higher and the average spread was only 50 cents per share.  According to analyst reports, Thomson-Reuters “fits” its series to more closely match analyst estimates (which its I/B/E/S division gathers).  Although neither series purports to be GAAP, most likely, the Thomson-Reuters series is less adherent than S&P.  Thus, any P/E calculated off the Thompson-Reuters data will tend to be understated.  The second issue, and perhaps the more important one, is the signal being sent by the divergence of the two series.  On the above chart, we have included vertical gray bars indicating recessions; note that when the two series diverge by 10% (1.10 on the above chart), the economy is in recession.  Thus, the current divergence is a concern.  There are several other business cycle indicators that suggest the economy is not in a downturn, but this indicator is clearly flashing a warning sign.

Which is the more accurate number?  Frankly, like so many other situations in life, it depends.  At this part of the business cycle, the S&P number is probably more informative.  In previous cycles, S&P’s weaker earnings were an indicator of an impending change in the business cycle.  That’s why the current divergence is a warning sign.  On the other hand, the Thomson-Reuters numbers are a more accurate representation of operating earnings during the recovery from recession.  Note on the above chart that the S&P earnings numbers tend to “catch up” with the Thomson-Reuters numbers as the recovery begins.

The P/E chart included at the end of our Daily Comment, which we update weekly, uses the S&P operating earnings data for historical earnings data.  The expectations data comes from I/B/E/S, so it comes ultimately from Thomson-Reuters.  This means our P/E may be somewhat understated, although not nearly as much as a pure forward-looking number would suggest using the Thomson-Reuters data.  Given where we are in the business cycle, the S&P numbers are probably a better reflection of operating earnings, meaning the forward P/E may be offering investors false comfort.

View the PDF

Daily Comment (July 8, 2016)

by Bill O’Grady and Kaisa Stucke

[Posted: 9:30 AM EDT] We discuss the labor market data in more detail below but the initial response is that the Bureau of Labor Statistics (BLS) seems to have lost its way.  We saw a massive jump in June non-farm payrolls by 287k with a net revision of -6k, reversing the 11k rise (revised downward) in May.  The household survey indicated a significant recovery in the labor force, up 414k after seeing an over 800k drop in the labor force in April and May.  However, employment in the household survey only rose by 67k, leading to a 0.2% jump in the unemployment rate to 4.9%.  Wage growth came in below forecast, up 2.6% from last year.  Given the volatility of the monthly data, it would seem that one should be smoothing the numbers with three-month averages at a minimum.

Market reaction is reasonably predictable after the data—equities and the dollar rallied, while Treasuries and gold declined.  We doubt this data will change the policy stance of the FOMC.  The June data will quell any worries about an immediate recession, which is good news.  However, the inconsistencies between the surveys make it difficult to determine how strong the labor markets are at the moment.  On balance, though, we would call the report supportive for the economy.

U.S. crude oil inventories fell less than forecast, dipping 2.2 mb versus estimates of a 2.4 mb decline.

The above chart shows current crude oil inventories, both over the long term and the last decade.  We are starting to see inventories decline, but normal levels would be below 400 mb, some 130 mb lower than now.

So, obviously, inventories remain elevated.  Inventories have been lagging the usual seasonal pattern.  We are in a period of the year when crude oil stockpiles tend to fall at an increasing pace.  The pace of declines will slow in the coming weeks as we are halfway through the summer driving season.

It is important to remember that the dollar is playing a bigger role in determining oil prices.

Based on inventories alone, oil prices are profoundly overvalued with the fair value price of $34.98.  Meanwhile, the EUR/WTI model generates a fair value of $47.07.  Together (which is a more sound methodology), fair value is $40.80, meaning that current prices are a bit rich.

View the complete PDF

Daily Comment (July 7, 2016)

by Bill O’Grady and Kaisa Stucke

[Posted: 9:30 AM EDT] Financial markets are attempting to stabilize in front of tomorrow’s employment data.  We did get the ADP data (see below), which came in above forecast and rather strong compared to last month.  Current expectations call for a 180k rise in payrolls and a 4.8% unemployment rate (+0.1%).  We tend to believe that the May data was an anomaly and non-farm payroll growth between 150k and 200k is the norm.  If the U.S. is unable to grow the labor force (or, to put it another way, raise the participation rate), then we are running up against labor market constraints and payroll growth should weaken.  But, we doubt that is the case.  The lack of labor force growth is complicated, a combination of skills mismatches, less mobile labor force and aging baby boomers.

This chart shows the cyclical expansion of the labor force or the past eight business cycles, indexed to the end of each recession.  As the chart shows, this is the slowest expansion of the labor force over these eight business cycles.

In Europe, starting with the U.K., the Conservatives have narrowed their choices for David Cameron’s successor to Home Secretary Theresa May and Energy Minister Andrea Leadsom.  Michael Gove was eliminated after this cycle of voting.  Of the two, Leadsom is the most supportive of Brexit.  Current betting pools indicate that May will be the most likely winner, although the actual vote among Tories won’t be held until September.  If May remains the frontrunner, it increases the likelihood that the U.K. exit will be amicable and, in fact, might not occur.  Meanwhile, in Italy, talks between the EU and Italian authorities over the banking situation have stalled over government involvement in the bailout.  The EU wants creditors to be the first line of defense for bank recapitalization rather than governments.  The problem is that, in Italy, the banks have sold bonds to households that appear to be viewed as forms of deposits.  It is estimated that households own about a third of Italian bank debt securities.  The EU rules are designed to protect taxpayers from bank bailouts and force creditors to carry the bulk of the risk.  However, in Italy, this isn’t much different than having depositors bear the risk of a bank failure.  If the bonds take a hit it could easily create conditions for a bank run.  The FT is reporting that the populist Five Star party is surging in the polls.  The latest polls show support for Five Star at 30.6%, exceeding the governing PD party support of 29.8%.  In January, the PD led by six points.  PM Renzi is holding a referendum on streamlining the structure of government in October.  If the vote fails, we expect the Renzi government to fall.  At present, the odds of such a rupture are rising.  Finally, Reuters is reporting that about a third of Eurozone sovereign bonds are ineligible for QE because they yield less than the -0.4% deposit rate set by the ECB.  Brexit has exacerbated this problem; before the vote, about 22% were ineligible.  The WSJ reports that QE has reduced the availability of sovereign bonds to the financial system.  Without risk-free bonds for collateral, QE inadvertently undermines the operations of the shadow banking system, reducing the availability of credit.

The FOMC minutes didn’t tell us much other than the members were dealing with such uncertainty that they all agreed not to make any changes.  If we get a rebound in the employment data tomorrow, expect to see the markets rebuild at least some possibility of rate hikes.  That result would be dollar bullish and Treasury bearish.

View the complete PDF