[Posted: 9:30 AM EDT] It’s global PMI day today. As we note below, most of the data came in around expectations. Australia was unusually robust while the U.K. was rather weak. Overall, the data suggests a global economy that is mostly steady.
We had two fed officials speak over the weekend, Dallas FRB President Kaplan and NY FRB President Dudley. Kaplan was mostly hawkish, suggesting that September was a live meeting, but also expressed the need for “patience.” Dudley, on the other hand, spent most of his time talking about the problems the economy faces. Despite these comments, financial markets continue to project a slow path for tightening; for now, the market doesn’t have the probability of an increase greater than 50% until the June 2017 meeting (based on the fed funds futures).
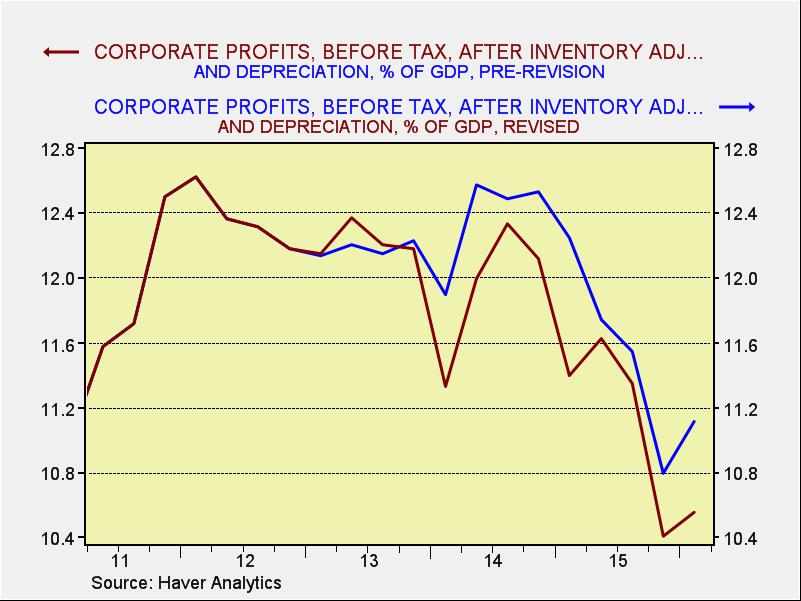
One item we neglected to mention with last week’s GDP benchmark revisions is that corporate profits, after inventory adjustments and depreciation, were revised higher. As the chart below shows, profits were stronger than originally reported, which is supportive for the equity markets.
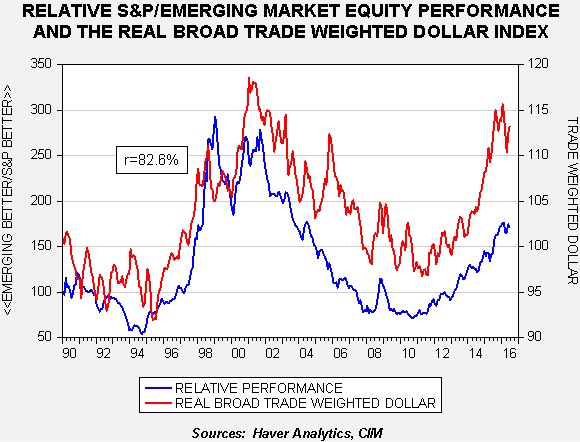
In the most recent rebalance of our Asset Allocation portfolios, we maintained an allocation to emerging market equities in the Aggressive Growth portfolio. As we have noted in the past, there is a positive relationship between the dollar’s exchange rate and the relative performance of developed market equities and emerging market equities.
This chart shows the relative performance of the S&P 500 and the MSCI emerging market index (denominated in dollars). A rising blue line on the chart signals stronger S&P performance relative to emerging markets and vice versa. Using the JPM dollar index, we note the dollar bottomed in late 2011. As the dollar appreciated, the S&P began to consistently outperform emerging markets.
The most important factor boosting the dollar was monetary policy divergence. The Federal Reserve ended its balance sheet expansion in December 2014. It raised its policy rate in December 2015. This tightening occurred while the European Central Bank (ECB) and the Bank of Japan (BOJ) both continued to implement aggressively accommodative policies. The dollar’s strength clearly accelerated in the 2014-15 period, although the rally has stalled this year. We believe the stall has occurred because of uncertainty surrounding U.S. monetary policy. Initially, the FOMC signaled four rate hikes this year. Currently, fed funds futures are suggesting no rate hikes this year and perhaps only one hike next year. If this does become the path of policy, the dollar bull market may be coming to a close unless the ECB and BOJ become even more aggressive in policy easing. If we are reaching the point where further accommodation isn’t possible, a stronger dollar is less likely and thus, emerging market equities become attractive given their recent relative weakness.
However, due to the uncertainty over the direction of policy, as noted above, the asset allocation committee has judged emerging market equities as only appropriate for aggressive investors. If the FOMC tightens policy sooner or to a greater degree than expected, developed markets could begin to sharply outperform emerging markets again. Given that market expectations are leaning heavily toward steady Fed policy, there is the potential for a bearish surprise for the emerging equity sector. Thus, in our judgement, only the most risk tolerant investors should be considering emerging market equities at this time.
[Posted: 9:30 AM EDT] The BOJ disappointed the financial markets. Expectations for a larger stimulus package, maybe even helicopter money, was hoped for. Instead, the BOJ offered to boost ETF purchases and indicated it will perform a study of its stimulus programs, hinting perhaps that more could come later this year. But, there is a growing fear that the BOJ may have exhausted all of its options. After all, NIRP hasn’t worked very well and given the absorption of bonds that QE is already doing, some portion of fiscal spending will be bought by the BOJ anyway. As expected, the JPY rallied but, surprisingly, Japanese equities rallied too. This unexpected improvement in stocks might be due to the expansion of ETF buying. Still, one day doesn’t make a trend and we will be watching to see if Japan’s equities hold up.
The U.S. presidential season is officially underway now that the two conventions are over, although many political analysts argue that most voters don’t really think about elections until after Labor Day. We have discussed this issue at length over the past few months and will be analyzing it in the coming months as well. Our take on this election hasn’t changed. We believe there have only been a handful of important presidential elections since 1792; this one could be one of those inflection point events. Hillary Clinton, despite her historical breaking of the gender barrier, is the continuity candidate. She ran her primary campaign using the playbook of a sitting vice-president and is leaning heavily on President Obama’s legacy. Donald Trump is running as a candidate of change. The most important change he is signaling is either an end to, or a massive adjustment of, America’s superpower role. There is a growing segment of the American public that is tiring of the costs of this role. They are unhappy with the constant wars and the unending foreign competition from globalization. Sanders represents this trend as well. To a great extent, this election is shaping up to be a referendum on the superpower role. If Trump were to win, the global impact would be massive. Our current expectation is that Clinton will win. Trump is a mercurial candidate that is capable of unforced errors and thus could make a fatal error at any time. Clinton may not be flashy, but she is disciplined and won’t go off message. Any mistakes she makes will be ones where she is blinded by her membership in the political establishment. Her VP selection and her giving Mayor Bloomberg a prime time speaking slot shows this tone deafness. Kaine, while giving us no doubt he is a solid citizen, does nothing to sway the Sanders voters and Bloomberg, although able to attract GOP establishment voters, is a paragon of Wall Street, an anathema to the Sanders and Warren supporters. The uncertainty surrounding this election should act as a damper for risk assets in the coming months.
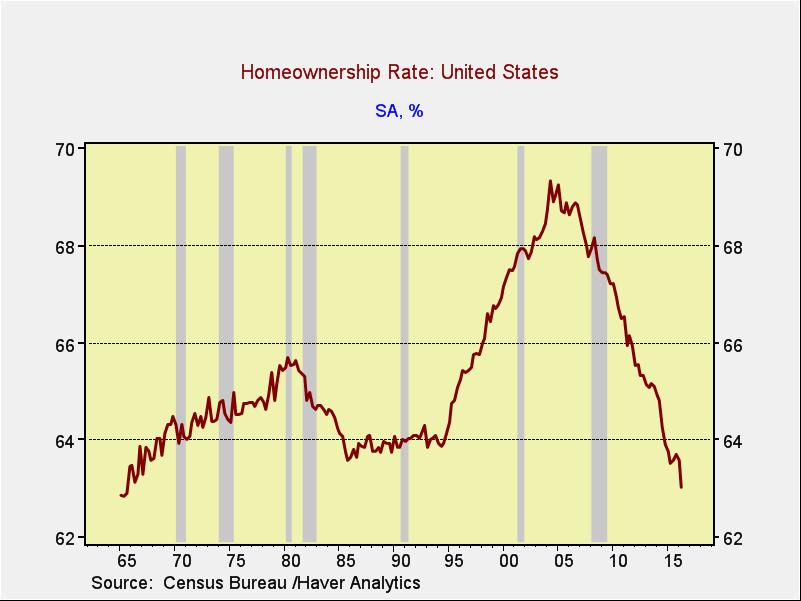
The GDP data, as shown below, was less than impressive. Another number that worries us as well is the drop in home ownership.
This chart shows the most recent data on the percentage of households that own or have a mortgage on their homes. It is at its lowest level since the mid-1960s. Our position has been that housing would not heal until home ownership fell to sustainable levels, which we assumed would be between 64% and 65%. We did not expect a decline to 63% and with few signs of stabilizing. If this doesn’t turn soon, it suggests that, at best, growth remains sluggish.
[Posted: 9:30 AM EDT] The FOMC statement was generally as expected. The committee acknowledged the economy improved from their last meeting. Labor markets are better and household spending is robust. On the other hand, business investment remains sluggish. Overall, the FOMC indicates that “near-term risks to the economic outlook have diminished.” Yet, the language suggesting that policymakers are in no rush to raise rates remains in place. The statement, for example, did not signal that risks to the economy were “nearly balanced” as some feared. KC Fed President George dissented, resuming her lonely assault on policy stability. But, overall, there were few surprises. We would view the statement as consistent with an outside chance of one hike this year, and more likely, no rate adjustments until 2017. Simply put, if the Fed wanted to prepare the markets for a rate hike, this statement failed in the goal, leading us to conclude that was not their aim.
Market action would suggest that the financial markets were primed for a more hawkish stance from the FOMC. In the hours after the statement, the dollar has weakened significantly and long-duration Treasuries rallied. Although STL Fed President Bullard has been roundly criticized for his regime model of monetary policy, the actual behavior of the Fed is very consistent with his model. He has faced criticism because his theory implies that policymakers are anticipatory except when regimes change; at that point, monetary policy would shift to a new focus (e.g., from controlling inflation to stabilizing the financial system) which would require a period of adjustment where the Fed would be behind the curve until the new regime is implemented. This is an unpopular view of policy; the preferred view is one where the focus of policy never changes. However, if one actually looks at how policy is conducted, it does pass through periods of goal adjustments, or regimes. The reason this is unpopular is that it adds another layer of risk to the financial markets. If, for example, the Fed switched to a regime of getting to 8% annual M2 growth instead of targeting inflation, interest rate volatility could soar. And yet, this was exactly Volcker’s monetary policy regime.
The BOJ decision is expected tomorrow. As we noted yesterday, PM Abe unveiled a ¥28 trillion fiscal package that included new spending and loan guarantees. The latter isn’t all that important because money is nearly free in Japan and so a project that needs a guarantee might be difficult to do anyway. The focus, then, is on how much new spending is included. Bloomberg reports today that it’s about a quarter of the total package, or ¥7 trillion. The unknown is the time frame for that spending. If it is spread out over several years, the immediate impact is less. From the BOJ tomorrow, we would not expect an announcement of helicopter money but would expect an expansion of QE.
Meanwhile, in Europe, EU Commission President Juncker appointed Michel Barnier to negotiate Britain’s exit from the EU. This appointment raised alarm in London; Barnier is considered anti-finance. He has supported regulatory measure, which has been unpopular in London, including broker bonus caps. Quotes surrounding his appointment include “I can’t see how it could be worse” and “It’s incredibly provocative. This is Juncker’s revenge on Britain”. We still believe that Chancellor Merkel is the ultimate decision maker on Brexit and initial meetings between the German leader and PM May appeared cordial. But the French are taking a hard line, in part to scare off the Le Pen’s National Front party, and are likely behind Barnier’s appointment. This decision could make things worse in terms of Brexit.
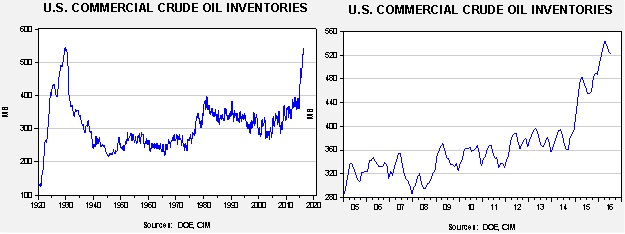
The U.S. crude oil inventories rose 1.6 mb, a bearish surprise. Market expectations called for a 2.0 mb draw.
This chart shows current crude oil inventories, both over the long term and the last decade. We are starting to see inventories decline but normal levels would be below 400 mb, some 130 mb lower than now.
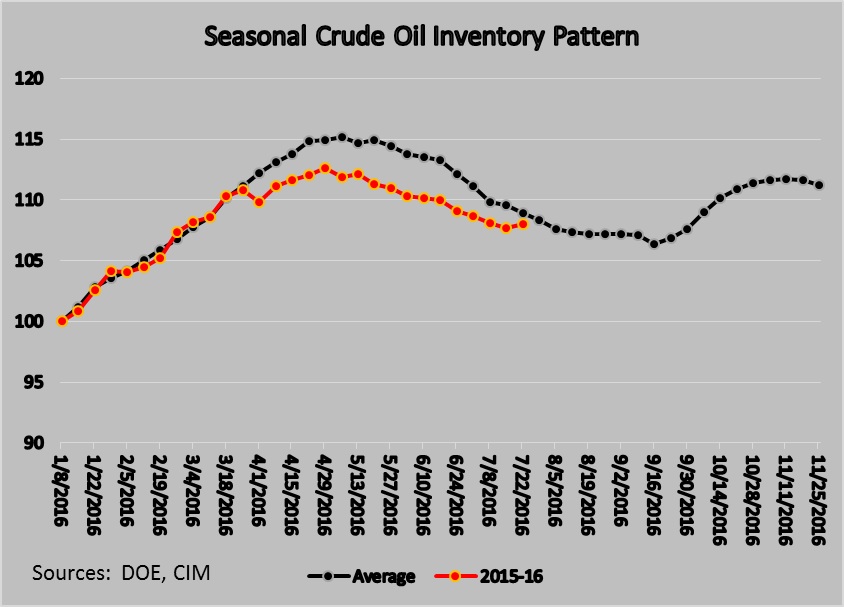
Inventory levels have been running below seasonal norms although the divergence has been narrowing. It narrowed significantly this week. We are in a period of the year where crude oil stockpiles tend fall at an increasing pace; in fact, in August, declines slow markedly. We note this week that refinery utilization fell 0.8%. Given the overhang in gasoline inventories, which rose 0.5 mb compared to expectations of a 0.2 mb rise, further declines in refinery utilization could lead to additional increases in oil stockpiles.
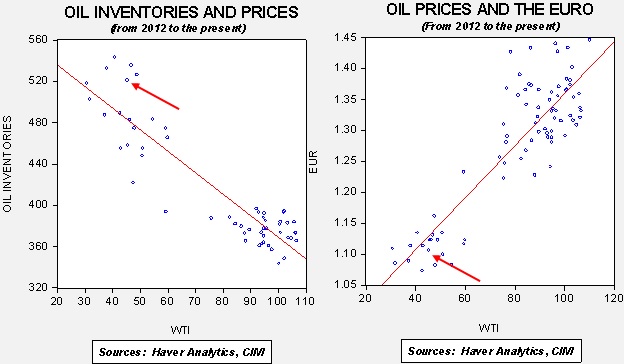
It is important to remember that the dollar is playing a bigger role in determining oil prices.
Based on inventories alone, oil prices are profoundly overvalued with the fair value price of $35.99. Meanwhile, the EUR/WTI model generates a fair value of $45.92. Together (which is a more sound methodology), fair value is $40.34, meaning that current prices are a bit rich although valuations are improving.
[Posted: 9:30 AM EDT] The FOMC meeting concludes today. Expectations are very low for this meeting although we would not be surprised to see the statement take on a more hawkish tone. Markets are not expecting the FOMC to move higher this year; in fact, the fed funds futures don’t signal a greater than 50% probability until February of next year. It should be noted that this projection has been creeping in recently. Just a few days ago, we didn’t get the first greater than 50% month until June. Still, the markets are consistently not expecting a rate hike this year. We would not be surprised to see the Fed try to inject some degree of uncertainty into this calculation but we doubt they will have much success.
PM Abe unveiled a massive fiscal stimulus plan, which came in at ¥28 trillion ($265.3 bn). Early estimates were around ¥20 trillion, so this is a big deal, representing about 6% of GDP. Of the ¥28 trillion, it appears that ¥13 trillion is new spending and the rest is loan guarantees. The details of the package will be released sometime next week but it does appear that this spending will be spread out over several years, which will dampen the impact of the fiscal package. We do note that the JPY weakened overnight and the Nikkei rose on the news. The headline data is quite bullish but the overall impact will probably be less than meets the eye. Still, it is a positive step for policy in Japan as monetary policy is clearly near the end of its usefulness. On this topic, the WSJ is reporting that Japan is considering issuing 50-year bonds. It is possible that a 50-year bond can be a tool in “stealth” helicopter money. The Abe government is probably reluctant to openly implement Monetary Funded Fiscal Spending (MFFS) because of its bearish effects on the JPY—it doesn’t want to trigger a currency war. In MFFS, the fiscal authority spends money and issues bonds that the central bank buys and effectively extinguishes by holding them to maturity. Given the usual adult lifespan, a 50-year bond is essentially a lifetime, thus allowing the fiction that MFFS isn’t being done when, essentially, it is. It should be noted that France and Spain have issued 50-year bonds and Ireland and Belgium have issued century bonds.
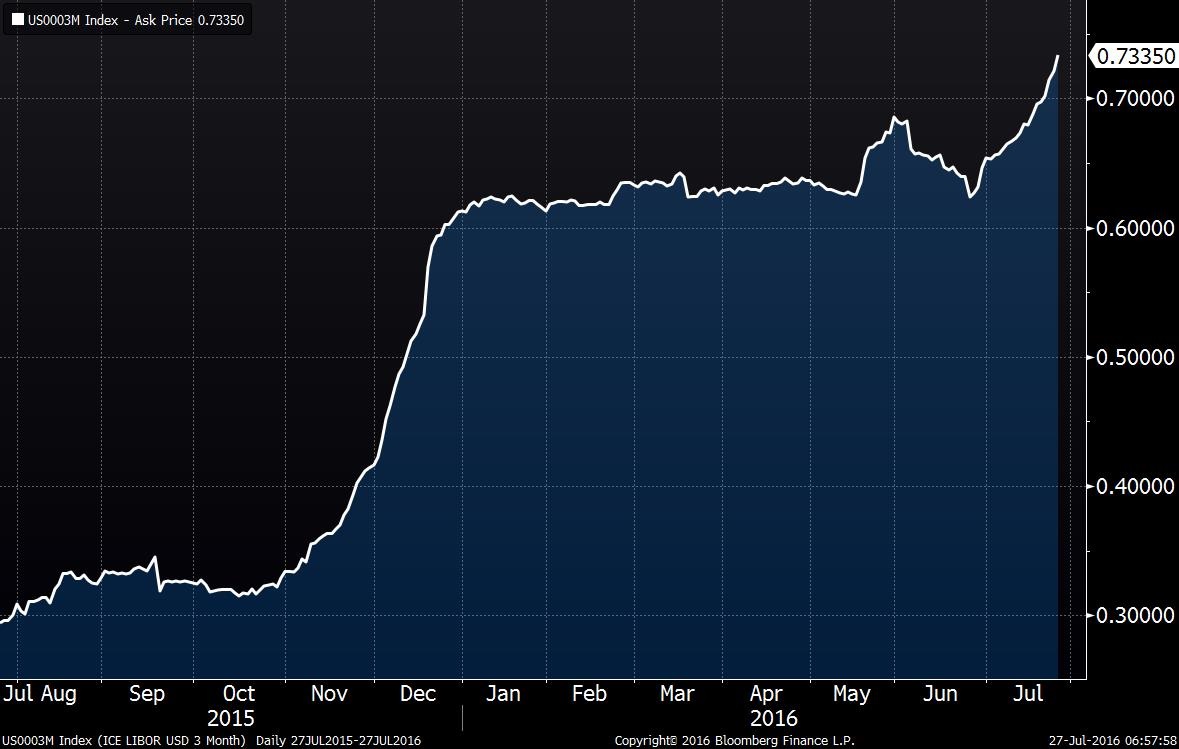
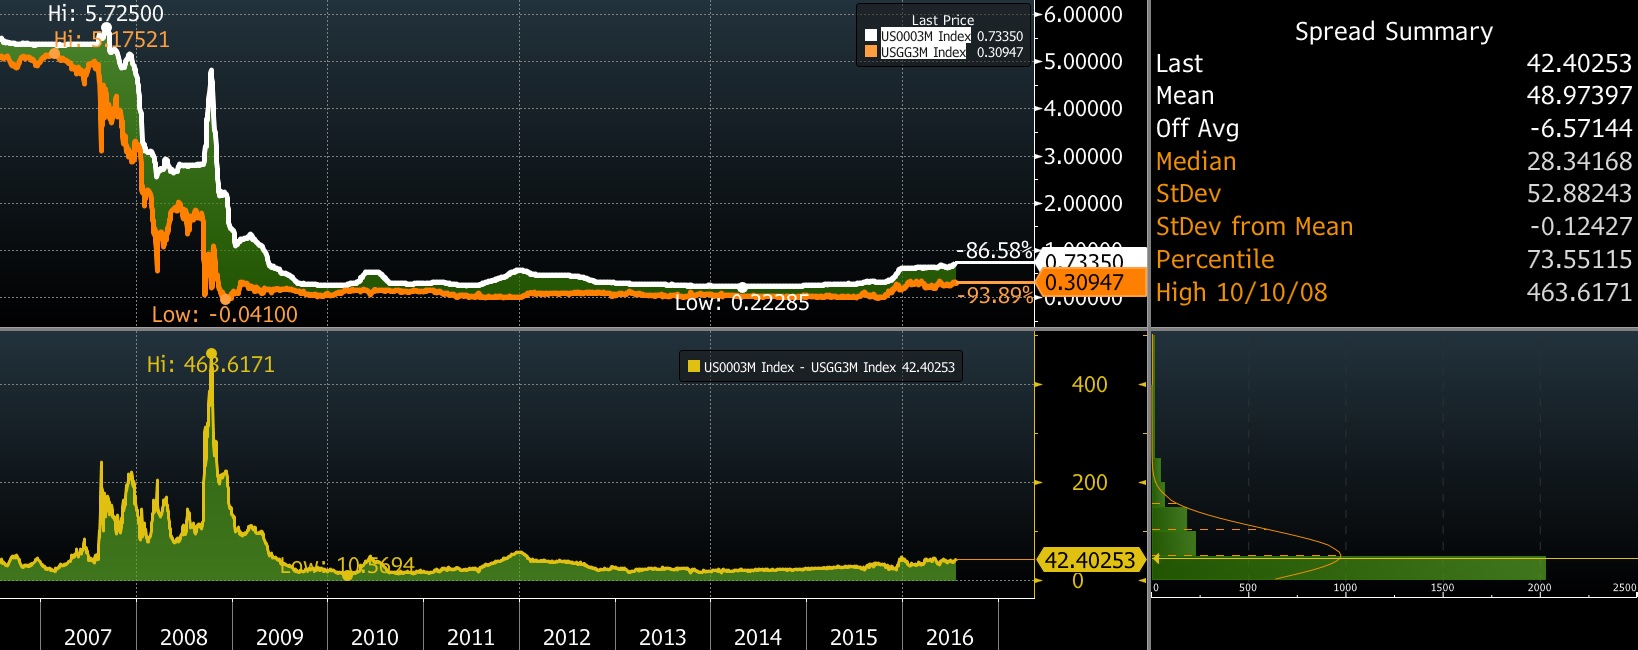
There has been some curious behavior in the LIBOR markets recently. Although expectations of Fed tightening are benign, LIBOR rates have been ticking up.
(Source: Bloomberg)
This chart shows 3-month USD LIBOR. Note that over the past month, the rate has moved up around 10 bps. Usually, such moves occur for one of the following reasons: (a) the Fed is raising rates or (b) there is a systematic financial system problem developing, leading investors to flee the LIBOR market for sovereigns. The second case is one of the reasons for monitoring the TED (T-bills vs. Eurodollar) spreads.
The TED spread has ticked up modestly, but isn’t signaling a problem.
(Source: Bloomberg)
Just compare the above chart to the long-term TED.
(Source: Bloomberg)
Note how LIBOR rates spiked in 2008 and was “spikey” from mid-2007 through 2008. That is a more classic example of the flight to safety element of the TED spread. We are not seeing that now.
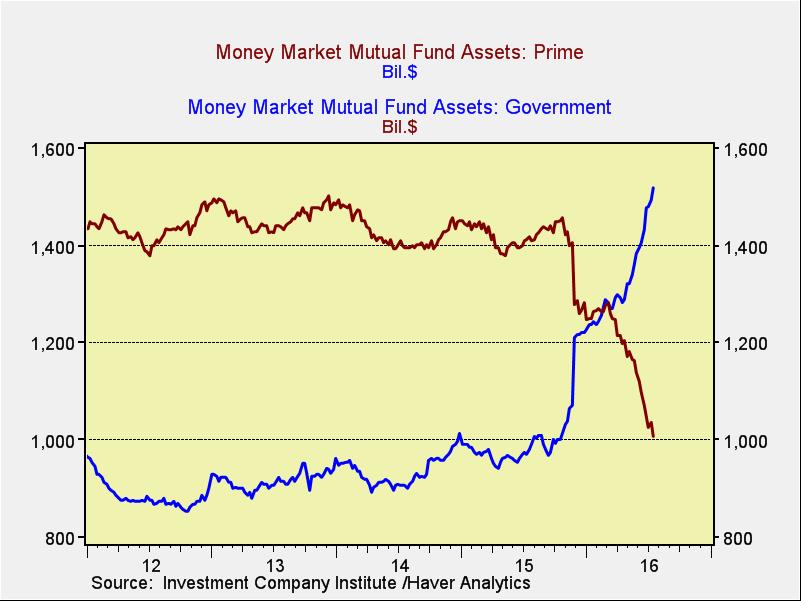
So, why the rise in rates? It’s entirely due to regulation. On October 14, prime money market funds (MMF) will see their statutory maximum weighted average maturity fall from 90 to 60 days. In addition, institutional MMFs will be forced to institute a floating NAV and can put up “gates” to slow withdrawals during crises. We are already seeing the impact.
Total Prime MMFs have declined about $500 bn and government funds have risen by about the same amount. Prime MMFs now represent 37% of total MMFs, down from 53% last October. The total assets in MMFs are about the same but the allocation has shifted from Prime to government MMF, which don’t face the same restrictions. We expect further shifts as investors begin to realize that a Prime MMF isn’t “cash.”
Here are some potential market effects:
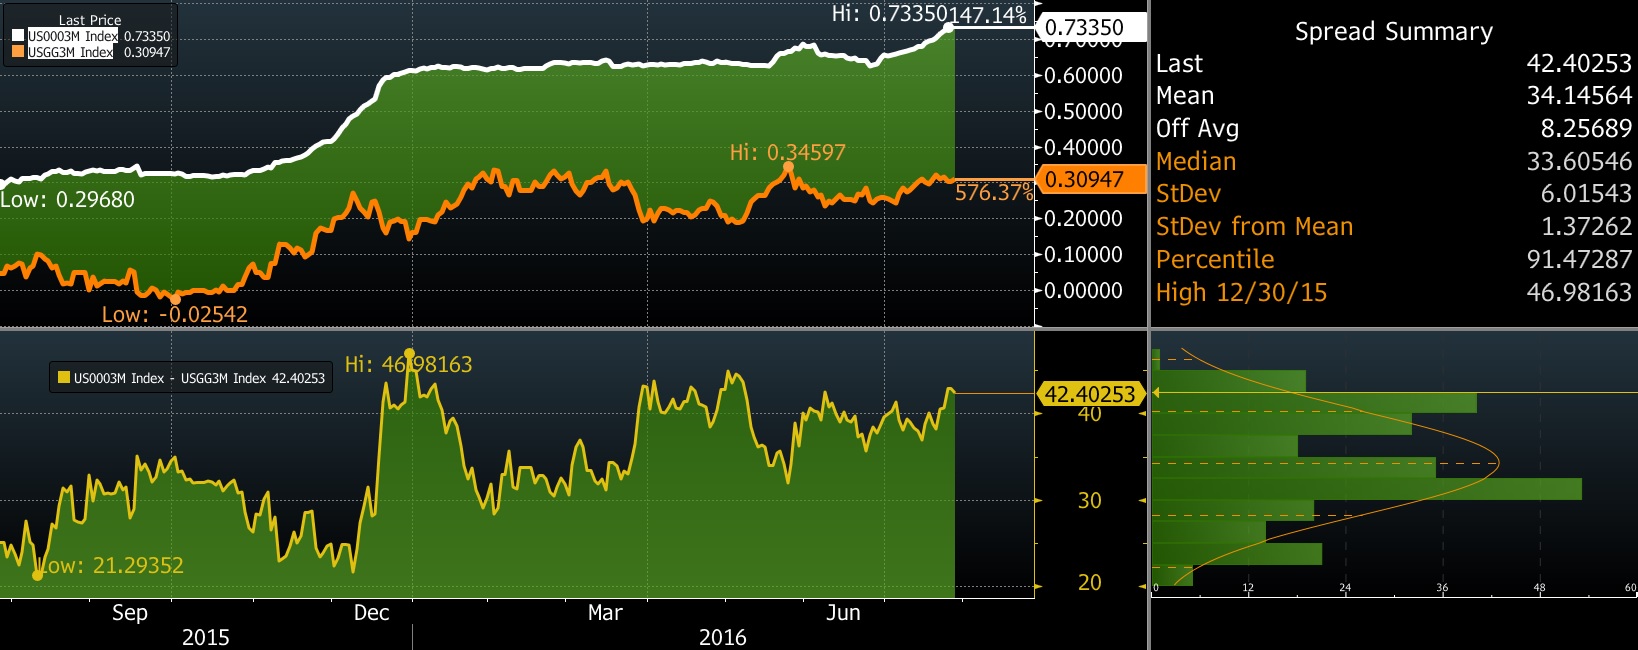
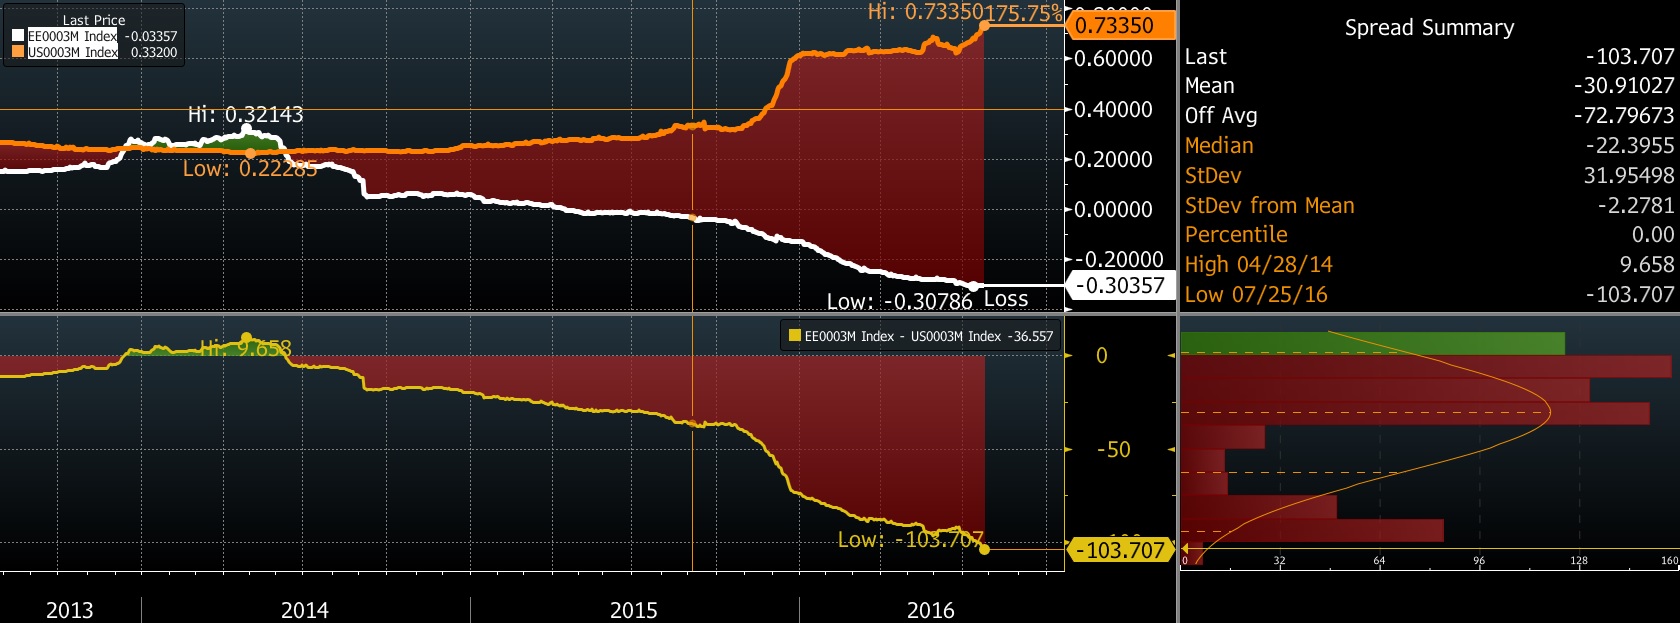
The dollar could rise. The rise in USD LIBOR hasn’t been matched by a similar rise in EUR LIBOR. All else held equal, the higher yield should support dollar buying.
(Source: Bloomberg)
This chart shows USD and EUR 3-month LIBOR, with the spread on the lower chart. Note how the spread has widened recently.
Commercial paper markets will be adversely affected. Prime MMFs buy commercial paper. As funds shift to government funds, the money available to buy commercial paper will decline, boosting funding costs to commercial paper issuers.
A secular change in the TED spread is likely. In general, investors discount the odds of a problem in the financial markets when they buy LIBOR-based paper. With the rules on Prime MMFs changing, the risk calculation will change which should permanently shift the spread wider. It is important for investors to realize that the TED isn’t necessarily signaling a financial system problem during this reset.
The rise in LIBOR and the dollar could be a bearish factor for commodities. If the regulatory change acts as a de facto monetary policy tightening and isn’t offset by the Fed, we may see some weakness develop in commodities. The primary driver of this will be the dollar.
Overall, investors will need to consult with their MMF providers to determine if they are willing to stay with Prime MMFs or shift to government MMFs. The issue really is what the function of the MMF is in the portfolio; if it is truly cash, then the government funds are more appropriate. If it is for yield, then one needs to realize that a Prime MMF will likely lose its cash-like characteristics during financial crises and one could find that there will be a delay in tapping a Prime MMF if financial conditions deteriorate. In addition, the floating NAV could mean that “a dollar isn’t a dollar” under some conditions. In other words, the new regulations force the Prime MMFs to “break the buck” if asset values decline.
[Posted: 9:30 AM EDT] The FOMC meeting begins today and concludes tomorrow. As we noted yesterday, we expect the Fed to try to inject expectations of potential tightening. We also expect the FOMC to fail on this goal. The financial markets are quite sure the Fed won’t move until next year. We note that the NYT has a feature article on Governor Brainard, one of the most dovish members of the FOMC. The article discusses her Democratic Party leanings (she has donated $2,700 to the Clinton campaign, the largest donation an individual can make) and her focus on global economic conditions in setting U.S. monetary policy. The Fed’s mandate from Congress is to focus on the U.S. economy. However, given the U.S. superpower role, the singular focus on the domestic economy is probably inappropriate. For better or worse, the U.S. is the world’s central bank. Given global conditions, the Fed should remain on the sidelines.
We are seeing the JPY much stronger this morning after the Japanese media reported that PM Abe is likely to propose a ¥6 trillion fiscal package, well below the ¥20 trillion suggested earlier this week. However, it should be noted that the higher numbers were somewhat overstated in that many were simply loan guarantees. Since Japan has negative sovereign rates, loan guarantees are rather silly. The proposal being discussed today appears to be real spending over a two-year time frame. Although this spending is not small, the reaction from financial markets is a clear signal that more is required to “move the needle.”
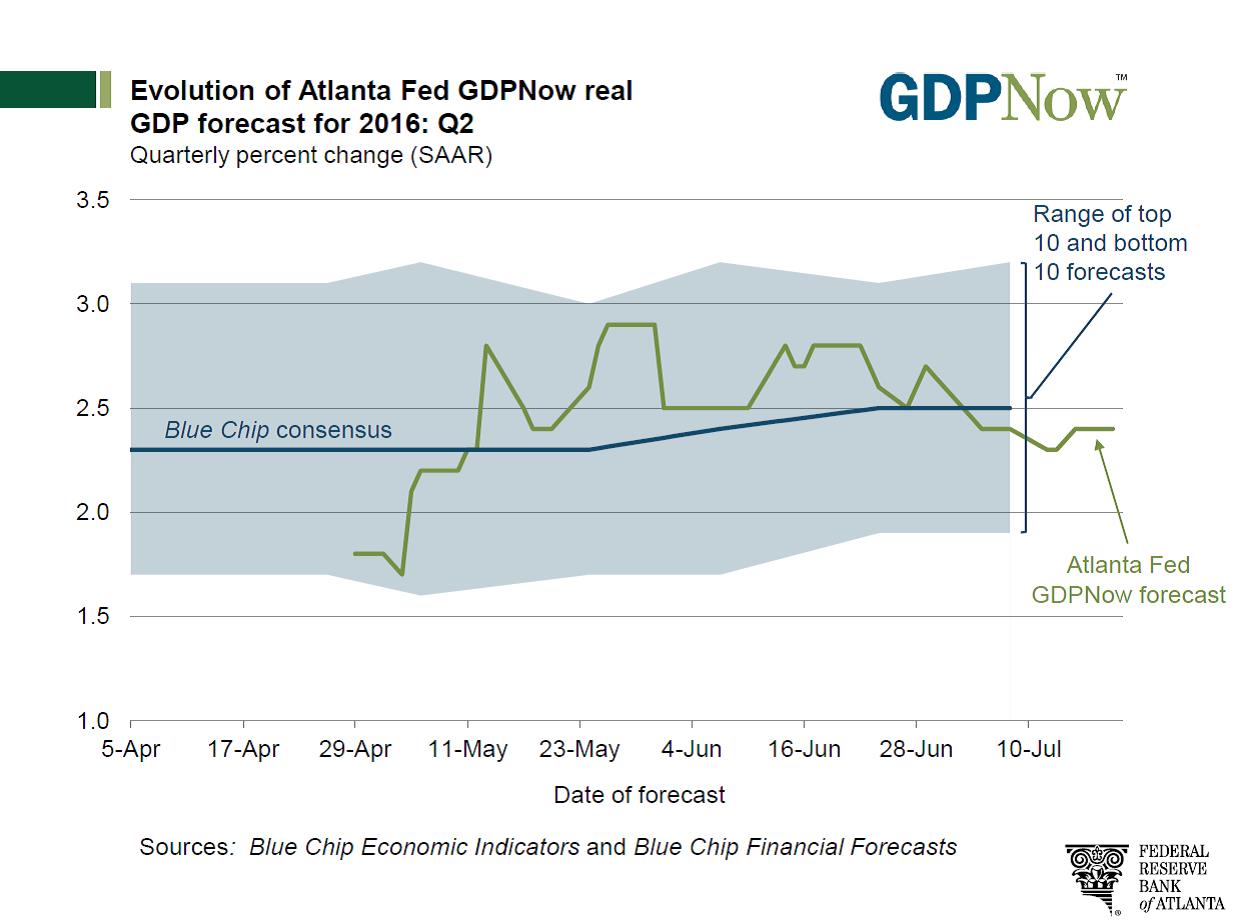
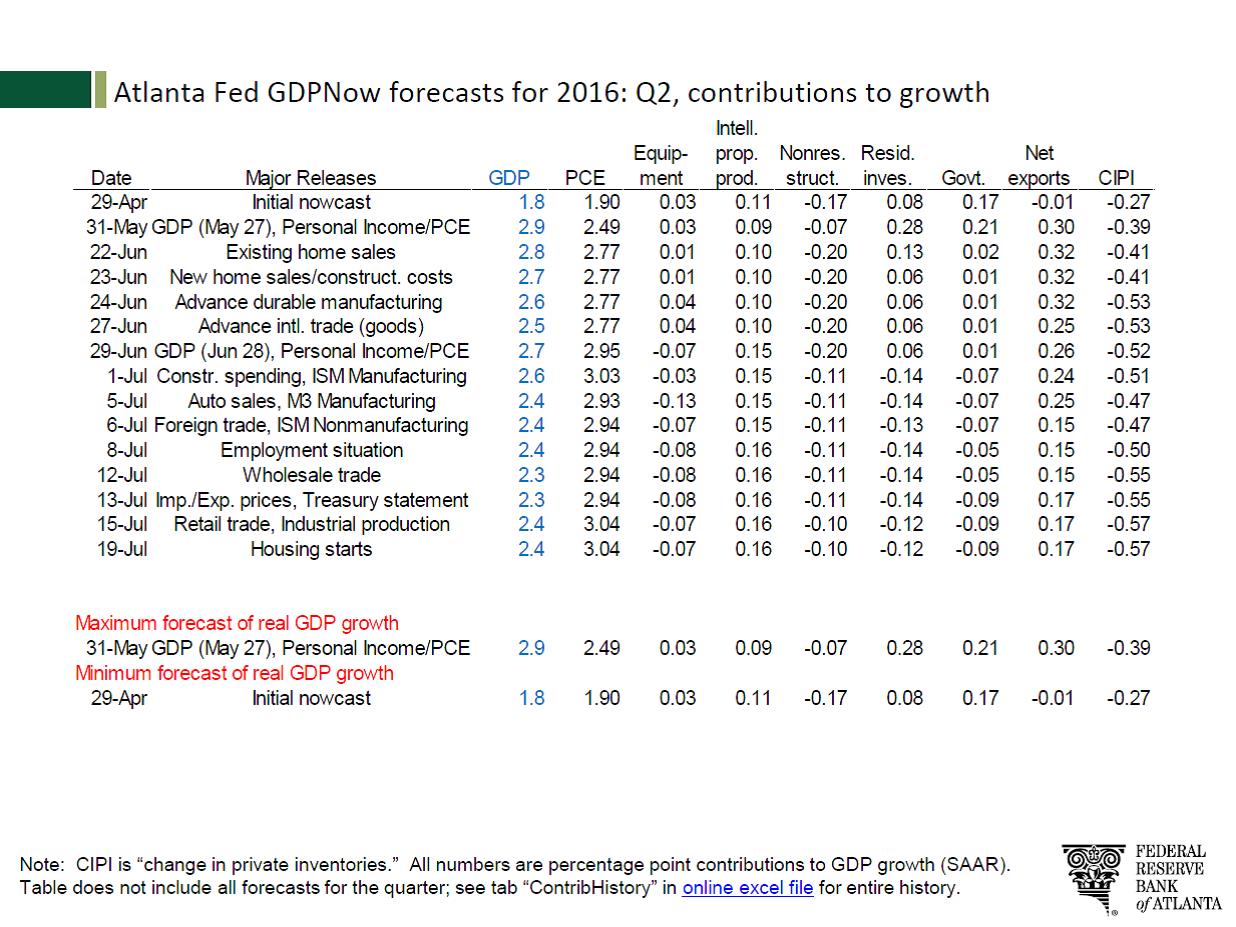
On Friday, the first look at Q2 GDP will be released. We do note that there will be benchmark revisions to the data which could affect how the numbers come in relative to expectations. The latest data from the Atlanta FRB showed the following:
This GDP tracker puts growth at +2.4%.
The above table shows contributions to the overall growth number. The data suggest that household consumption is the source of nearly all growth in the economy, adding just over 3%. The biggest drag on growth is inventory reduction, which is peeling nearly 60 bps off of growth (CIPI on the above table). That is something of a “bad news/good news” situation as inventory rebuilding will tend to support growth in future quarters. Net exports added modestly, although if one observes the trends in the data, the contribution from net exports fell as consumption improved over the quarter. This is consistent with theory; as consumption rises, some growth is lost to foreigners. It is also disconcerting that the government sector remains a drag on the economy, a persistent problem in this recovery and expansion.
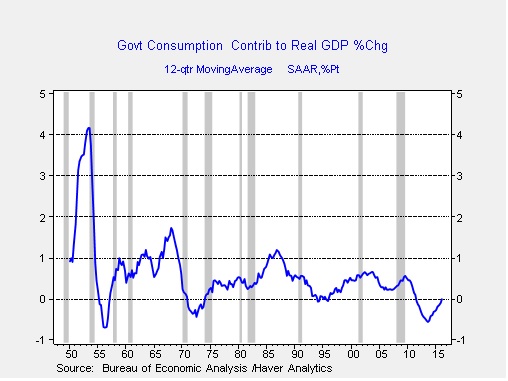
This chart shows the three-year average of the contribution to GDP growth coming from government. Since 1950, the trend contribution from government tends to run between 50 to 100 bps. There were three periods prior to the current one when the government contribution was negative. All three of these periods occurred during post-war demobilizations. The current weakness, occurring during wars in Iraq and Afghanistan, suggests that other spending on infrastructure, education, etc. has been severely constrained. It is important to note that only spending on goods and services by the government affects GDP directly in the GDP data. Transfer payments, such as Social Security, Medicare, etc., are not counted as government consumption. That spending shows up in consumption as households spend these transfers.
Both candidates for president are promising higher fiscal spending. Although we have serious concerns about the potential return on investment (nicer airports and more roads probably won’t boost productivity), at least the spending will lift GDP growth. Overall, we would expect the proposed fiscal policy boosts to lift growth by 50 to 100 bps most quarters.
So, overall, we are looking for a recovery in the data on Friday. The revisions do add an element of uncertainty to the data. However, we feel safe in saying that the data will be an improvement over Q1.
On Friday, July 15, reports out of Turkey indicated that unusual troop activity was underway which suggested a coup was in progress. In the U.S., as afternoon turned toward early evening, it was abundantly clear that elements of the Turkish security services were attempting to oust President Recep Tayyip Erdogan. As the hours wore on, a countercoup was launched by supporters of President Erdogan and the tide turned. By the next day, it became obvious that the coup had failed.
There has been a great deal of speculation surrounding the failed coup, including that President Erdogan had engineered a “false flag”[1] operation. Supporters of Erdogan blamed the shadowy cleric Fethullah Gulen, a Turkish Islamist leader from Turkey who lives in self-imposed exile in Saylorsburg, Pennsylvania. Some have also accused the U.S. of fostering the coup. In the aftermath of the dramatic events on the 15th, the Erdogan government is engaging in a massive purge of the military, the judiciary and education.
In light of the coup and the potential changes that may be occurring for a key U.S. ally in a volatile region of the world, we believe a detailed examination of this event is in order. Thus, we are publishing a three-part report on the coup. This week’s edition will examine the failed coup within the historical context of Turkey. Next week, we will discuss the coup and the countercoup. Part three will examine the post-coup purge and its impact on Turkey’s domestic and foreign policy. We will analyze market effects at the conclusion of the third report.
[Posted: 9:30 AM EDT] It was another mostly quiet night. We did see European equities lift on better economic sentiment data (see below). The G-20 meeting ended with a mostly banal communiqué. There was some discussion of fiscal policy by the group. However, the G-20 structure is so unwieldy that any real group-wide adjustments only occur during crises.
For summer, this could be a momentous week. First, the FOMC meets tomorrow and Wednesday. No change in policy is expected. This meeting will not produce dots or changes in forecasts, so the statement will be the most important item to emerge from the meeting. The fed funds futures put the odds of a hike at this week’s meeting at a mere 10% and don’t record a greater than 50% reading until next March. Thus, the financial markets could be vulnerable to comments that suggest a rate hike may be back on the agenda. We would not be surprised to see some leaning in a hawkish direction but would not expect the FOMC to make a clear case for higher rates. Still, one important risk to the “goldilocks” conditions we are experiencing would be a change in policy perceptions.
Also this week, the ECB will be releasing the results of its bank stress tests on Friday. All eyes will be on Italy’s results. Italian officials continue to claim that any problems are under control. EU officials also claim that measures already taken have made the system safer. We would be surprised to see any major banks fail the tests. After all, they are political in nature. We will be watching the market’s reaction to an expected good result. If bank equities rally, it would suggest that investors view the tests as credible. Today’s FT reports that Portuguese banks are bracing for massive losses from the government’s inability to find buyers for Novo Banco, the lender that emerged from the resolution of Banco Espirito Santo, which failed nearly two years ago. Novo Banco was the “good bank” that came from the failed bank, and the government’s inability to privatize the good bank is not a good sign for financial markets in the EU.
Also on Friday, the BOJ will hold its policy meeting. There are high expectations that the BOJ will “do something” to support the economy. There is growing speculation that the Abe government will try to coordinate stimulus policy with the BOJ, although that may not happen at this meeting. We would not be surprised to see the BOJ increase its buying of non-traditional assets, such as equity ETFs, but the hope for “helicopter money” is likely to be dashed, at least at this meeting.
In other news, the Guardian is reporting that the EU may be willing to offer Britain a seven-year exemption to freedom of movement rules while allowing the U.K. to remain in the single market. France is strongly opposed to the concession but we suspect Germany does not want to see a major trading partner’s economy hurt by a hard Brexit. Britain would still need to pay into the EU budget and would give up its seat at the negotiating table, but unchecked immigration seemed to be the biggest issue triggering the Brexit vote. The risks for the EU are that such restrictions on movement inside the EU would be popular with other states but, if widely implemented, it would represent a major retreat from a unified Europe. On the other hand, this might be the best solution available. If this rule does come to pass, it would be supportive for U.K. financial assets.
In the most recent rebalance of our Asset Allocation portfolios, we introduced positions in gold. Although the yellow metal is classified as a commodity, we view it more as a currency, admittedly one that is not backed by liabilities. National fiat currencies are generally created in the credit process and are backed by the trust imbedded in the nation’s debt. Currencies have three roles: medium of exchange, unit of account and store of value. Gold does not act as a medium of exchange in a modern economy. But, it can be used as a unit of account and it mostly excels as a store of value.
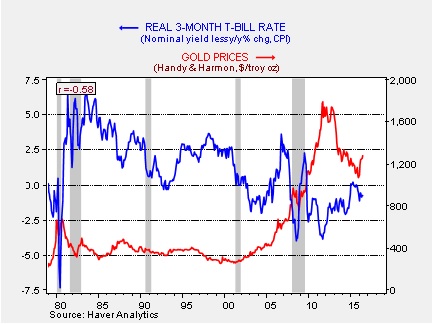
Because it isn’t liability backed, the opportunity cost of holding gold is essentially equivalent to inflation-adjusted interest rates. If one holds gold in lieu of short-term debt, the lost opportunity is the interest earned after inflation. History does suggest that there is an inverse correlation between real interest rates and gold.
This chart shows real T-bill rates and the price of gold. Note that gold prices have increased as real rates have become persistently negative.
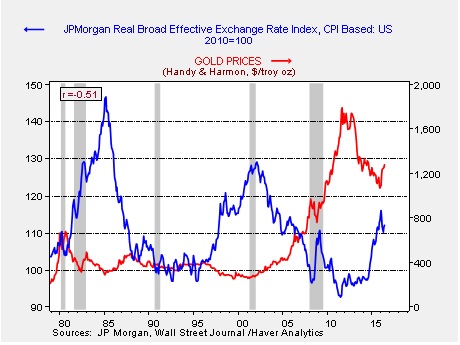
The other factor that affects gold is the dollar. Since gold is priced in dollars, a rising greenback makes gold prices more expensive to foreign buyers. Since a stronger dollar is often associated with rising U.S. interest rates, a stronger dollar tends to be bearish for gold.
This chart shows gold prices and the JPM real effective dollar index. Note that since 2000, the dollar’s swings have affected gold prices. In fact, since 2000, the correlation is -87%.
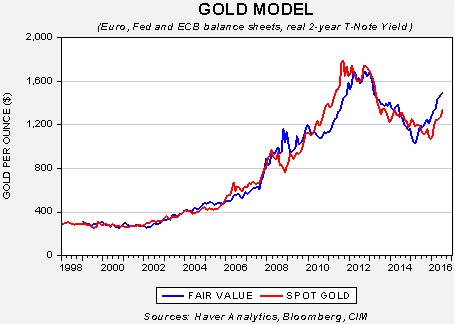
Since inflation, interest rates and exchange rates affect gold prices, we have created a model of the relationship.
The model uses the EUR/USD exchange rate, inflation adjusted two-year T-note yields and the balance sheets of the European Central Bank (ECB) and the Federal Reserve. Including the latter two variables generally accounts for investor expectations of future inflation and interest rates. The current fair value for gold, based on this model, is $1,489.26, suggesting that current prices, though elevated, are not overvalued.
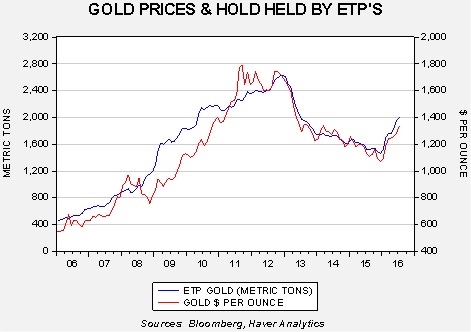
Finally, investors have been putting money into gold through exchange-traded products.
This chart looks at the metric tons of gold held by ETFs, ETNs and grantor trusts compared to the price of gold. As one would expect, the two are closely linked, correlating at nearly 95%. Since the beginning of the year, investors have been increasing their exposure to gold through these products. With the FOMC on hold and additional policy stimulus expected due to Brexit, investors are seeking the safety of gold.
Due to our view that gold is attractively valued and that conditions should favor the yellow metal, as noted above, we added gold to our allocations this quarter. We expect that conditions should favor gold in the upcoming quarters.
We use cookies to ensure that we give you the best experience on our website. If you continue to use this site we will assume that you are happy with it.