Daily Comment (February 9, 2018)

by Bill O’Grady and Thomas Wash

[Posted: 9:30 AM EST]

Looking for something to read?  In our travels we are often asked about books we recommend.  As a result, we have created The Reading List.  The list is a group of books, separated by category, that we believe are interesting and insightful.  Each book on the list has an associated review to help you decide if you want to read it.  We will be adding to the list over time.  Books marked with a “*” are ones we consider classics and come highly recommended.

It’s official!  We are in a correction.  The S&P 500 has now declined just over 10% on an intraday high-to-low basis.

(Source: Bloomberg)

Do we have more downside from here?  Probably not materially, although we expect more grinding around current levels before we head back higher.  Next week’s CPI data will be important.  If inflation does appear to be accelerating, it may trigger another downleg.  Overall, the economy is still doing fine; the drop in equities might affect sentiment but it’s important to remember that nearly 85% of equities are held by households in the top 10% of income brackets.  In other words, the real losses are concentrated at the top end of the income scale so, for most Americans, the gyrations in equities are not a materially negative factor.

What are we paying attention to?  It is clear in the data that the last major equity market decline in the absence of recession occurred in 1987.  This begs the question, “Is this another 1987 event?”  At present, we don’t think so but, if it is going to be that kind of event, the trigger would probably be the use of volatility products.  In 1987, portfolio insurance led to a selling effect that exacerbated the downdraft.  Volatility trading won’t necessarily involve the same methods, but it could lead to similar results.

We have been getting questions on the volatility trade and note there is some confusion on how it works.  It’s important to note that betting on volatility is just that—it’s essentially trying to predict when the “freight train” is coming while others pick up nickels from the tracks.  To get an idea of this, we refer to the prospectus for the VXX (55.24), which says (on pages 13-14):

The long-term expected value of your ETN is zero.  If you hold your ETN as a long-term investment, it is likely you will lose all or a substantial portion of your investment.

The reason is the roll yield.  The long volatility products are long the front contract of the VIX futures when the term structure of the VIX futures are normally in contango, meaning the deferred futures price is above the nearest price.  When the nearest contract expires, the VXX manager buys the next nearest contract at a higher price.  If nothing happens, that contract will decline to where the previous contract expired, meaning the value of the positon will decline.  Over the long term, that means steady losses for the holder of long volatility.  So, the inverse position in volatility is in the opposite position.  Their position gains over time.  The anti-vol trade is really more of a roll yield position and less of a position on volatility.  Now, when policymakers are dampening volatility with accommodative and transparent monetary policy, the periods lengthen between volatility spikes (when the VXX pays off, or, when the “freight train” arrives), making the anti-vol positions quite profitable.

What led to the collapse of the anti-vol ETP was not just the jump in volatility but the fact that the volatility futures term structure flipped from contango to backward.  In other words, the nearest futures contract rose relative to the deferred contracts.  This means that losses were being accumulated on the roll yield and on the outright short position against volatility, which pushed prices down to points where some (but not all) ETN managers, to protect losses, exercised the call provision of the note and closed their products.

The unknown is how widespread was anti-vol positioning, who was in it and how much leverage was being deployed?  A casual look at the holders of XIV (0.00), the primary inverse ETN, shows a number of banks and broker dealers that were probably holding these for customers.  But, a large number of hedge funds are also represented and that is where the concern lies.  The fact that we are seeing selloffs in the last hour of trading may be a signal that these entities are still trying to build liquidity.  We don’t think the current event is going to be another 1987 situation, but we are watching the volatility issue closely because that is the most likely source if this does turn out to be a similar occurrence.

Is there a Powell put?  At present, if there is one, we are far from its strike price.  Various Fed speakers have been out in recent days and none seem overly concerned about the decline in equities, and fed fund futures are still projecting the odds of a March rate hike at around 85%.

A budget: The president signed the Senate budget deal that was passed early this morning by the House and Senate.  We did have a filibuster in the Senate that delayed the passage but we felt confident it would pass.  The good news is that we have now removed the budget drama from the markets for a couple of years.  What we have to deal with is the additional fiscal stimulus coming from the tax bill and this new spending.  We expect much of the expansion to boost imports, meaning the national growth effect will not be all that impressive but it is quite good for the global economy.

View the complete PDF

Daily Comment (February 8, 2018)

by Bill O’Grady and Thomas Wash

[Posted: 9:30 AM EST]

Looking for something to read?  In our travels we are often asked about books we recommend.  As a result, we have created The Reading List.  The list is a group of books, separated by category, that we believe are interesting and insightful.  Each book on the list has an associated review to help you decide if you want to read it.  We will be adding to the list over time.  Books marked with a “*” are ones we consider classics and come highly recommended.

BOE monetary tightening: Today, the Bank of England voted unanimously to leave interest rates unchanged but warned that earlier and larger interest rates increases are on the horizon in order to dampen the effects of a faster growing global economy on U.K. inflation.  In the BOE’s quarterly inflation report, each of the members of the BOE Monetary Policy Committee agreed that they are unwilling to tolerate inflation exceeding the 2% target for the next three years.  At a press conference, BOE Governor Mark Carney stressed that tighter monetary policy is needed due to expectations of faster demand growth and diminishing supply.  There has been speculation that the next rate increase could come as early as May.  The pound rallied following the news.

The chart above shows the year-over-year change in CPI for the U.K.  Following the Brexit vote in June 2016, the BOE stated that it would tolerate higher inflation to support domestic growth; as a result, the BOE has been slow to respond to rising inflation even though CPI has persistently remained above the 2% target since January of last year.  The Monetary Policy Committee’s decision to reverse course was largely due to concerns of possible overheating as previous concerns of rising instability following the Brexit decision proved to be unsubstantiated.

Is Goodfriend out?  Bloomberg[1] is reporting that Marvin Goodfriend, the White House’s nominee for one of the vacant Fed governor positions, may not get confirmed by the Senate.  The vote is expected today and he is expected to make it through the Banking Committee but the full Senate may be a problem.  Goodfriend has a controversial record.  He warned against an inflation problem after QE; although he was part of a broader chorus, the call was simply wrong.  He has not backed down from that position and was criticized for it.  He has also made disparaging comments about the dual mandate (a reasonable position from a theoretical standpoint, but Congress mostly likes the dual mandate as it acts as something of a brake on overly tight monetary policy), has shown support for negative interest rates and called for a magnetic strip to be added to paper currency, perhaps to give it a “stale date” in order to prevent currency hoarding under periods of negative nominal interest rates.  That sort of thing is vehemently opposed by Libertarians.  The left-wing populist group “Fed Up” is urging Democrats to reject the candidate.  Rejecting a Fed nominee would be a blow to the administration; it isn’t obvious who they would tap as a replacement.

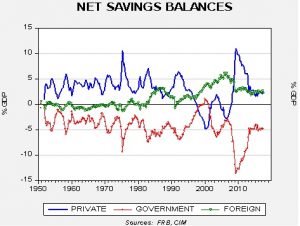
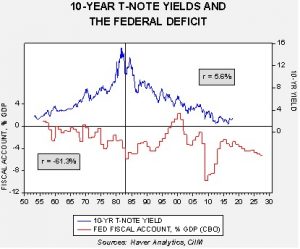
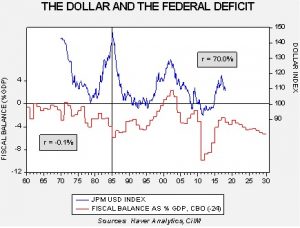
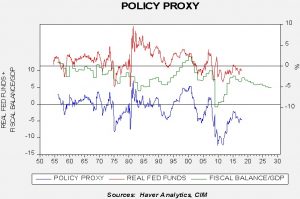
A budget deal: The Senate leadership has agreed to a two-year funding deal, as we touched on yesterday.  The agreement lifts the sequestration caps and will increase discretionary spending by $300 bn over two years.  Defense spending will rise by about $131 bn and be matched with non-defense spending.  The agreement was not met with open arms by deficit hawks but, given that they are a minority in both houses, we expect this deal to pass.  It’s important to remember that Jacksonians, of which the president is one, are not opposed to government spending.  In fact, they like it, but only on their priorities.  In other words, foreigners and the undeserving should not get help from the government.  It is rare to see the deficit widen during expansions but the CBO is projecting just that outcome after this year and it hasn’t taken into account this new budget agreement in the below chart.

What does the deficit cause?  Although the textbook answer to this question is inflation, in fact, the impact is very complicated.  Our expectation is that budget deficits will most likely bring higher trade deficits and a weaker dollar, but probably have a modest impact on inflation.

Energy recap: U.S. crude oil inventories rose 1.9 mb compared to market expectations of a 3.0 mb build.

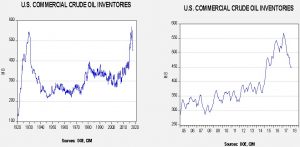
This chart shows current crude oil inventories, both over the long term and the last decade.  We have added the estimated level of lease stocks to maintain the consistency of the data.  As the chart shows, inventories remain historically high but have declined significantly since last March.  We would consider the overhang closed if stocks fall under 400 mb.

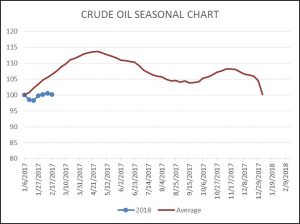
As the seasonal chart below shows, inventories are usually rising this time of year.  We are seeing increasing inventories but they are running below the usual seasonal levels.

(Source: DOE, CIM)

The rise in stocks is normal but the surprise this week was that the increase occurred with a sharp rise in refining activity.  If this jump indicates that maintenance is over, oil demand will rise.

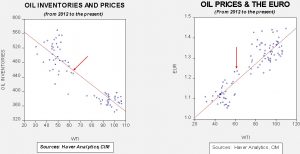
Based on inventories alone, oil prices are undervalued with the fair value price of $67.44.  Meanwhile, the EUR/WTI model generates a fair value of $76.56.  Together (which is a more sound methodology), fair value is $73.79, meaning that current prices are below fair value.  We did see oil prices sell off yesterday despite the lower than expected rise in inventories.  That’s because weekly lower 48 production jumped 0.3 mbpd to 9.727 mbpd; coupled with Alaskan output, U.S. output hit 10.3 mbpd.  The market fears that rising U.S. output will cap prices.  Perhaps the largest risk is that Russia and Saudi Arabia decide to stop ceding market share to the U.S.; although we do expect that to occur at some point, it probably won’t happen until the Saudi Aramco IPO price sometime later this year or early next year.

As noted above, refining activity rose.

(Source: DOE, CIM)

Although refiners had been cutting output since late last year, we usually see about two months of reduced activity before production returns.  One week doesn’t make a trend, but this reversal is rather shocking and does suggest that refiners see demand for their product (perhaps exports?).  While the rise in U.S. production is a concern, we would need to see a surge in inventories to become worried about prices.

View the complete PDF


[1] https://www.bloomberg.com/amp/news/articles/2018-02-07/goodfriend-faces-close-vote-for-fed-after-rough-senate-grilling?__twitter_impression=true

Daily Comment (February 7, 2018)

by Bill O’Grady and Thomas Wash

[Posted: 9:30 AM EST]

Looking for something to read?  In our travels we are often asked about books we recommend.  As a result, we have created The Reading List.  The list is a group of books, separated by category, that we believe are interesting and insightful.  Each book on the list has an associated review to help you decide if you want to read it.  We will be adding to the list over time.  Books marked with a “*” are ones we consider classics and come highly recommended.

Equity markets are attempting to stabilize this morning.  As noted above, Asia was mostly lower while Europe is in the green.  Here is what we are looking at this morning:

Is this it?  By our calculation, the current decline from the recent high (basis the S&P 500) was just under 10%, but would round up to that level, which is generally considered a full correction.  Despite the sudden drop after months of calm, investors have been relatively sanguine.  We do note the Ned Davis Crowd Sentiment Poll fell from around 75 to just under 67.  Usually, this index would need to decline to around 61 to signal that excessive optimism has “washed out.”  We note some of the major wirehouses have given “all clear” signals and are suggesting we should move higher from here.  We don’t necessarily disagree, but would note that in our personal experience equity corrections don’t usually end without a greater degree of fear.  It is possible that some of the usual panic has been transferred to other markets, perhaps cryptocurrencies or the volatility products, but we would not be surprised to see at least a retest of recent lows before a recovery develops.  In other words, this probably isn’t a “V” bottom in equities.

At the same time, there is no strong evidence of recession, which is the usual trigger for a major bear market.  Recent market action is rather normal behavior; in recent years, persistently supportive monetary policy has dampened market volatility and thus made corrections less common.  As monetary policy normalizes, choppy equity markets are a likely outcome.

No change in policy expectations: Fed funds futures are still indicating about an 83% chance of tightening at the March 21st FOMC meeting.

(Source: Bloomberg)

This chart shows the probability of a rate hike for the March meeting.  At the end of January, the fed funds futures indicated near certainty of a rate hike.  Recent equity market action did add a degree of doubt but odds still strongly favor a rate hike.

The budget process: The House has passed a stopgap measure while Senate leaders are indicating they are nearing a two-year budget deal that would not only address the upcoming spending limit issue but also address the debt ceiling that is looming next month.  The keys to the emerging Senate deal are (a) immigration is to be dealt with outside the budget process, and (b) spending will rise to bring enough members on board for passage.  The Senate version will not be popular with the Freedom Caucus in the House, which means passage will rely mostly on Democrats and enough moderate Republicans to vote for the measure.  We may see another shutdown later this week, but would not expect much market impact.

Merkel has a deal: Chancellor Merkel will give the SPD the finance and foreign ministries in a new grand coalition government, which was apparently enough to get the SDP leadership to agree to form a government.  Although the SDP rank and file still need to vote on the measure, getting these two key ministries should be enough to sway most members.  Merkel’s CDU/CSU party is not pleased, according to reports.  The general expectation was that the SDP would get one of these two ministries, but not both.  Assuming the SDP approves the deal (and they would be making a huge mistake if they didn’t), Germany’s stance on the EU could soften dramatically, which could mean a more French vision is in the offing.  A more French vision would include more fiscal unity and relaxed rules of fiscal spending by individual states.  Although a new government is likely, it may not last very long; most Germans are fearful of providing a “credit card” to the rest of Europe and the SDP’s version of the EU won’t be popular with the CDU/CSU or the AfD.

View the complete PDF

Daily Comment (February 6, 2018)

by Bill O’Grady and Thomas Wash

[Posted: 9:30 AM EST] Equities remain under pressure around the world.  We are seeing lots of swings in other markets, with Treasuries flipping from higher to lower prices and the dollar is volatile as well.  Here is what we are watching:

Algos and risk parity: Innovation is always a factor in markets, including financial ones.  Most of the time, new things are an improvement.  Sometimes this isn’t the case and, even with good things, overdoing it or becoming overly reliant upon a new, untested product can cause problems.  Early in my career, portfolio insurance was the rage; buying equities and offsetting part of the risk by being short futures (or having stops under the market in futures) gave investors the impression they were protected from market declines.  In 1987, that proved to be a false assumption.  In our times, risk parity has the potential to be the new version of portfolio insurance.  At its most basic level, both portfolio insurance and risk parity are nothing more than portfolio diversification.  In other words, holding an asset in a portfolio that moves in the opposite direction to other parts of the portfolio is basic modern portfolio theory.  Finding that diversification asset is the trick; it must (a) not be overly costly, and (b) work consistently.  Finding instruments that always move opposite to stocks is easy; finding ones that don’t offset most of one’s equity gains is hard.

Simple risk parity models usually use bonds to offset portfolio risk.  Although that hasn’t always worked, it has been effective in this century.

This chart shows the rolling five-year correlation between returns for 10-year T-notes and the S&P 500.  Until around 2000, returns for these two asset classes were positively, or directly, correlated.  They are now negatively, or inversely, correlated.  There are probably a myriad of reasons for this flip, including confidence that inflation would remain controlled.  Declines in long-term interest rates seem to have an impact as well (when the 10-year yield fell under 6%, the correlation switched), and consistent and transparent Fed policy also likely played a role.  Recently, we have seen both Treasuries and equities come under pressure.  Heightened inflation fears seem to be behind this market action.  This is an issue we are monitoring closely because asset allocation would become much more challenging if this relationship between bonds and stocks were to change to the pre-2000 relationship.

Risk parity can be much more than the simple addition of bonds to a portfolio.  One of the more popular strategies in recent years has been to use volatility instruments to diversify portfolios.  And, for every buyer of insurance, someone has to be a provider.  Selling volatility has been a very profitable strategy in recent years.  With every popular strategy, the financial services industry will create a product to facilitate demand.  Inverse volatility ETPs, which are usually ETNs,[1] have done quite well in recent years.  Volatility has steadily declined, in part due to easy and transparent monetary policy, slow economic growth and low inflation.

(Source: Bloomberg)

This is a two-year chart of the XIV (CS VELOCITYSHRS DLY INV VIX SHRT ETN, 99.00).  Two years ago, this ETN was trading at 20; it peaked last month at 140.  The current after-hours indication is 15.43 (see below for more on this issue).

To some extent, what we are seeing in the financial markets is a normal late-cycle environment where the economy expands to capacity constraints, inflation begins to rise, interest rates move up and monetary policy tightens.  There is nothing too unusual in what we are seeing.  Now, we can quibble about all of these elements.  First, we are not convinced that hitting capacity constraints is relevant in a globalized world.  As long as excess capacity exists in the global economy, inflation can be contained by a wider trade deficit.  Second, the rise in inflation we are contemplating, to maybe 2.5% for core CPI in the coming 12 to 18 months, isn’t so earth-shattering as to force the Fed to slam on the money brakes.  Third, we are not convinced that the recent rise in wages is material; although overall wages rose by 2.9%, wages for the majority of workers, shown by non-supervisory and production workers, remain stagnant at 2.4%.  Still, there is little doubt the FOMC will continue to lift rates unless the recent break in equity markets destroys enough wealth that it affects the economy.  That isn’t likely, simply because significant equity ownership isn’t broad enough to have that effect.

What is causing the market turmoil is a repricing of the outlook coupled with vulnerabilities caused by volatility products and algorithms.  As holders of short volatility products take losses and try to exit products, they are likely selling other parts of their portfolio to gain liquidity.  It should be noted that trading was halted yesterday on several of these ETNs and they remain halted at the time of this writing.  As the chart below shows, the NAV on XIV has plunged to 4.22.

(Source: Bloomberg)

According to reports, some of these ETNs may be liquidated due to their price action.[2]  If that occurs, it may end this product’s availability to average investors.

Algorithms are the other innovation that affects the financial markets.  These pre-programmed trading strategies are designed to use speed to succeed.  Thus, when various conditions are met, these programs begin rapid trading.  The sharp drop seen in the last hours of trading yesterday were likely triggered by such programs.[3]  These programs can make financial markets temporarily unstable but really don’t affect long-term investors…as long as they don’t pay close attention to such swings.  To some extent, algorithms are not doing anything humans don’t usually do, but they do them faster and they seem impossible to stop once triggered.  That feature is what makes them a bit worrisome.

So, where does all this leave us?  We view this pullback as a buying opportunity.  The real worry is a recession that brings a broader bear market, and the economy is doing ok.  Insofar as this correction rids the market of some of these activities that rely on conditions that are probably unsustainable, it will make equities less vulnerable to shocks.  The bigger picture is the repricing of stocks that we are seeing; in other words, are we going to see a broader downward shift in market multiples that will lead to lower prices this year?  It’s possible, but if inflation doesn’t begin to accelerate significantly and the FOMC remains on a steady path, a dramatic repricing isn’t likely.  At the same time, we think there is probably more market turmoil in the short run.  We haven’t seen a real panic yet and usually these sort of events don’t end without fear returning to the markets.

Bitcoin hit again: While bitcoin continues to come under pressure, another voice calling for regulation has emerged.  The Bank of International Settlements (BIS), the “central banker’s central banker,” is calling on central banks to “clamp down” on these instruments, calling them a “threat to financial stability.”[4]

View the complete PDF


[1] Exchange Traded Products (ETPs) is the broad definition; Exchange Traded Notes (ETNs) are subsets of ETPs (the broader cousins of ETFs, or Exchange Traded Funds) which are bank notes issued to replicate an index.

[2] https://www.bloomberg.com/news/articles/2018-02-06/volatility-jump-has-traders-asking-about-poison-pill-in-vix-note

[3] https://www.bloomberg.com/news/articles/2018-02-05/machines-had-their-fingerprints-all-over-a-dow-rout-for-the-ages

[4] https://www.ft.com/content/78bf5612-0b1a-11e8-839d-41ca06376bf2

Weekly Geopolitical Report – Trump & Trade: The First Year (February 5, 2018)

by Bill O’Grady

President Trump has been in office for just over one year, having been inaugurated on January 20, 2017.  He campaigned on a populist agenda—anti-globalism was a core message.  Specifically, his “America First” mantra railed against free trade deals, suggesting they were poorly negotiated, supported immigration restrictions and called on allies to shoulder more of their defense burdens.

In this report, we are going to focus on the trade situation following his first year in office.  We will begin with a review of American hegemony and trade, including how trade is affected by saving patterns both in the U.S. and abroad.  This analysis will include commentary on the effects of fiscal policy on administration trade policy, showing how they are working at cross purposes.  One critically important aspect of administration trade policy is how foreign nations react to the threat of tariffs and sanctions.  We will argue that the administration’s goal should be employment and show how foreign companies may be adjusting to Trump’s policies in a way that won’t help narrow the trade deficit but could improve the job market.  As always, we will conclude with potential market ramifications.

View the full report

Daily Comment (February 5, 2018)

by Bill O’Grady and Thomas Wash

[Posted: 9:30 AM EST] It’s another down day for the broad swath of financial markets.  We are seeing weakness in equities; bonds have started to stabilize but we are seeing a rapid steepening of the yield curve.  Market action has been mostly controlled with little evidence of panic…so far.  Here is what we are watching today:

Equity issues: One of the key characteristics of this bull market has been the lack of volatility.  We have experienced long stretches with no corrections.  We see a couple reasons for this pattern.  First, the FOMC has been transparent about monetary policy; in addition, policy has been accommodative.  Second, inflation and fears of inflation have been low.  The combination of clear policy and low inflation has reduced the fears of owning equities.  There is evidence the combination of these factors is starting to change.  First, although monetary policy remains transparent, it is becoming less accommodative as the market looks for at least three, if not four, rate hikes this year.  Second, inflation fears are rising.  The wage data from last week’s employment report showed a 2.9% increase in overall wages, although we did note that the gain was a much more modest 2.4% for non-supervisory workers.  Until the latter accelerates notably, we think inflation fears may be overdone.

Inflation is the key issue.  When inflation rises, the correlation between stocks and bonds tends to turn positive, undermining diversification.  Under these conditions, bond and stock prices fall simultaneously.  That is the situation we are seeing now.  Whether or not it continues depends on the actual process of inflation.  In the short run, we look for a modest rise in price levels, with the core rate of CPI moving to around 2.5% by early 2019.  That rate is obviously higher than what we are seeing but such a move should be manageable.  The concern is, of course, whether the FOMC overreacts to this rise in price levels and tightens policy to the point where a recession is triggered.  At this juncture, there isn’t much evidence to suggest a recession is in the cards over the next couple of quarters.  Thus, the elements of a major sell-off in equities aren’t likely.

Instead, it appears what we are witnessing is a fairly normal decline in stocks.  Since 1928, a 5% drop in equities occurs about 3.4 times per year.  Corrections (10% declines) occur 1.1 times per year.  The last 10% drop occurred in late 2015.  We are clearly due for a pullback.

(Source: Bloomberg)

This chart shows the nearest futures contract for the S&P 500.  Technically, we are approaching the 50-day moving average, which may be a support area.  The lower segments on the chart show the Relative Strength Index and the Moving Average Convergence/Divergence indicator.  The RSI has moved from overvalued to the balanced area.  It has not achieved an oversold level, which would be below the lower green line.  The MACD has rolled over but hasn’t shown signs of consolidation.  The charts suggest a good bit of the excess has been worked off but we are still facing further downside.

No German coalition yet: The SDP and CDU/CSU missed their weekend deadline but talks are continuing today.  We still expect a deal to be struck, but the longer this goes on, the more pressure will develop on the EUR.

Sanctions on Venezuela?  SOS Tillerson indicated that the U.S. is considering restricting imports of Venezuelan oil and cutting off exports of product to Caracas.  If this step is taken, it will roil the U.S. and foreign oil markets.  Although Venezuela will try to sell its oil to other buyers, the characteristics of its oil (heavy and sour) are best for the U.S. refining industry.  We suspect further sanctions will cut global oil supplies and boost prices.

View the complete PDF

Asset Allocation Weekly (February 2, 2018)

by Asset Allocation Committee

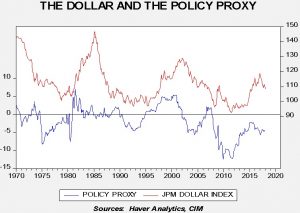
The World Economic Forum in Davos was held recently and various comments were made about the dollar during the meetings.  Treasury Secretary Mnuchin seemed to imply that the administration was talking the dollar lower, a violation of unwritten protocols that make it acceptable to have a weaker currency in support of growth but improper to use depreciation to give a nation an advantage on trade.  Later, President Trump seemed to contradict his treasury secretary, suggesting the dollar should strengthen.  This led the financial media to deploy a parade of currency analysts to try to explain the dollar’s behavior.  The cacophony of comments did little to explain market action.

Our position on exchange rates is that there is no single valuation method that works consistently.  In our over 30 years of monitoring and analyzing exchange rates, we have found they are usually characterized by regimes.  During some periods, trade balances drive exchange rates.  In other periods, interest rate differentials are the key factor.  Relative growth rates or productivity have also been relevant.  But, in the long run, the oldest valuation method, purchasing power parity, remains useful for investors.

Purchasing power parity assumes that exchange rates bring equilibrium to relative prices.  In other words, if price levels in one nation are higher compared to another nation, the country with higher price levels will experience currency depreciation until price levels equalize.  In practice, the ratio of price levels isn’t perfect—not all goods in a price index are tradeable, inflation indices between countries are not identical and no markets are frictionless, so adjustments can take time.  But, what we find in practice is that when the exchange rate deviates widely from the ratio of inflation rates (or, purchasing power parity), the exchange rate usually adjusts.

These are exactly the conditions we have seen recently.

This chart shows our calculation of purchasing power parity for the euro (based off the D-mark at euro parity and German inflation), the Canadian dollar, the British pound and the Japanese yen.  In all cases, the dollar is highly overvalued.  What we find missing in most comments about the dollar that we see in the financial media is that the dollar is weakening in response to overvaluation.  All these charts show that key market signals come at extremes.  As exchange rates approach the standard error lines, they become vulnerable to reversals.  And, when reversals occur, it is not uncommon for the exchange rate to move to an opposite extreme.  This likely means that the dollar will continue to weaken for an extended period.

In response, our asset allocation has added foreign equities.

This chart shows the S&P and EAFE equity indices, denominated in dollars.  We have rebased the two to 1988 and calculated a ratio of the indices.  We have also added the Federal Reserve’s major current index.  When the dollar is strengthening, U.S. stocks tend to outperform.  When the dollar is elevated and reverses, it is usually favorable to foreign equities relative to U.S. equities.

In general, both indices tend to be closely correlated.  As a result, shifting to overseas stocks doesn’t mean that domestic equities are expected to decline.  Instead, it suggests that the tailwind of a weaker dollar boosts the relative value of foreign stocks to a U.S. investor.  That is the rationale for our current allocation.

View the PDF

Daily Comment (February 2, 2018)

by Bill O’Grady and Thomas Wash

[Posted: 9:30 AM EST] Happy employment day!  We cover the data in detail below but the initial read is that it’s a blowout.  Payrolls rose sharply, better than forecast, and wage growth accelerated (although not for all workers).  Financial markets are not taking it well; it’s another “red day” where interest rates are rising, equities are weaker and the dollar is up.  Here is what we are watching:

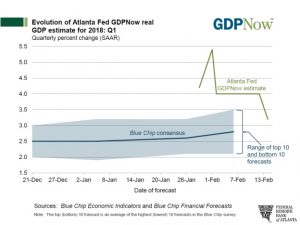
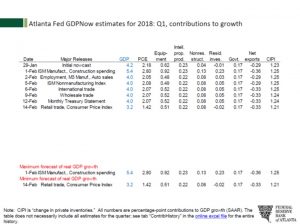
Is Goldilocks stuck with a porridge that is too hot?  Economic growth in the U.S. and around the world is solid.  Of the 38 countries that report manufacturing PMI, 35 are above 50.  As we note below, the employment data was quite good.  Although it is early in the forecasting process, the Atlanta FRB’s GDPNow report is rather shocking.

We expect this number to come down but, even at this early stage, it reflects an expanding economy.

So, why isn’t this good news?  A key factor to the strength in both bond and stock markets over the past nine years has been slow and steady growth, which has produced rising earnings with low inflation.  Growth acceleration raises fears of inflation and will likely prompt the Fed to raise rates steadily.  The three hikes expected for this year could turn into four and, eventually, rising rates will adversely affect the economy.

Equity prices are a function of earnings and investors are willing to pay for those earnings.  Rising inflation will tend to undermine the willingness of investors to pay up for earnings.  So, even though rising economic growth could bring even stronger earnings, equities could be constrained by a moderating P/E.  At the same time, it’s important not to become overly pessimistic here.  Bear markets are usually tied to recessions and there isn’t any evidence that a recession is approaching.  A more likely outcome is a stronger equity market with increased volatility.  The steady rising market we have seen in the past couple of years probably won’t be the path in 2018 even though the trend is higher.

Bitcoin tumbles: Bitcoin continues to spiral lower as governments boost regulatory scrutiny.[1]  India is now joining China, South Korea and the U.S. in either taking full regulatory steps or at least examining such measures.  Axios reports that foreign governments are using cryptocurrencies to evade sanctions.[2]  All this suggests that the movement is facing headwinds.

(Source: Bloomberg)

As the chart shows, bitcoin is down over 53% from its closing peak in mid-December.

View the complete PDF


[1] https://www.wsj.com/articles/rise-of-bitcoin-futures-prompts-regulator-to-revisit-hands-off-approach-1517394600

[2] https://www.axios.com/how-cryptocurrencies-used-to-evade-sanctions-b752de25-0c2e-42f1-a04c-33aad930c6ed.html?utm_source=newsletter&utm_medium=email&utm_campaign=&stream=top-stories

Daily Comment (February 1, 2018)

by Bill O’Grady and Thomas Wash

[Posted: 9:30 AM EST]

The FOMC: The FOMC did what we expected; it held rates steady but prepared the market for new rate hikes.  We currently expect three hikes this year but, given the overall hawkishness of the 2018 voters, we cannot rule out four hikes, especially if the economy continues on its current course.  Financial markets are preparing for additional hikes.

The chart on the left shows the implied three-month LIBOR rate from the Eurodollar futures market, two years deferred.  In other words, it is the market’s projection of three-month LIBOR rates in Q1 2020.  Since September 2017, this rate has moved higher at a solid pace and now has reached its highest level in nearly eight years.  The Eurodollars are now projecting a fed funds rate of nearly 2.50% in two years.  The chart on the right shows the aforementioned implied LIBOR rate with the fed funds target. The upper line on the chart shows the spread between the two rates.  During tightening cycles, the FOMC tends to raise rates until the spread becomes negative (shown by vertical lines on the chart).  The fact that the spread is widening despite tighter policy suggests we are likely moving into an accelerating phase of tightening.

T-notes approach 2.75%: The 10-year T-note yield has moved toward 2.75% this morning as the prospect of tighter monetary policy, rising European yields and higher oil prices have boosted yields.  Although the rise in Treasury yields is a potential threat to the equity markets, in reality, we would need to see much higher yields for it to become a significant risk for stocks.

This chart shows the 10-year T-note yield and the S&P 500 earnings yield, the inverse of the P/E.  For the P/E, we use the four-quarter trailing methodology, described in our weekly P/E chart.  Although the so-called “Fed Model” has been around for a long time, in its raw form, it isn’t all that good of a predictor.  During much of the 1980s, the earnings yield was below the 10-year yield, which is odd.  Still, for most of this century, the earnings yield has been higher than the T-note yield.  Regressing the two suggests that the current level is about at fair value; to get to where equites are expensive, the 10-year would need to reach around 4.25%.  Of course, given the relative “looseness” of this relationship, we would expect a negative reaction from equities before then but this chart does suggest that it will take a larger move in rates to adversely impact equities.

Energy recap: U.S. crude oil inventories rose 6.8 mb compared to market expectations of a 3.0 mb build.

This chart shows current crude oil inventories, both over the long term and the last decade.  We have added the estimated level of lease stocks to maintain the consistency of the data.  As the chart shows, inventories remain historically high but have declined significantly since last March.  We would consider the overhang closed if stocks fell under 400 mb.

As the seasonal chart below shows, inventories are usually rising this time of year.  This week, we finally saw an increase as refinery operations declined.

(Source: DOE, CIM)

The rise is more normal and we would expect steady increases in stockpiles in the coming weeks until the refinery maintenance season comes to a close.

Based on inventories alone, oil prices are undervalued with the fair value price of $68.12.  Meanwhile, the EUR/WTI model generates a fair value of $72.21.  Together (which is a more sound methodology), fair value is $70.95, meaning that current prices, while elevated, are below fair value.  The weak dollar and falling oil inventories are bullish for oil prices and suggest there is more upside, especially if inventories fail to rise in their normal seasonal fashion.

Yesterday, the DOE announced that official November U.S. oil production reached 10.0 mbpd for the first time since the early 1970s.

Although this news wasn’t an enormous surprise, it is still remarkable.  It is interesting to note that the U.S. was producing just over 5.0 mbpd at the turn of the decade.  Essentially, U.S. oil output has doubled in eight years.

View the complete PDF