by Bill O’Grady, Thomas Wash, and Patrick Fearon-Hernandez, CFA | PDF
(The Weekly Energy Update will not be published next week due to Thanksgiving. The report will return on December 1.)
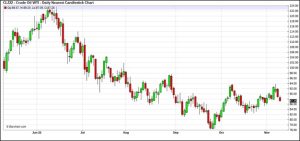
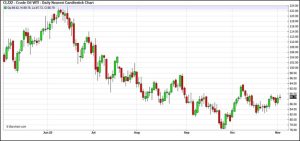
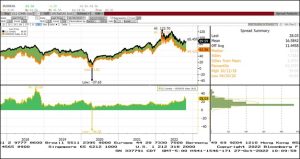
Crude oil prices appear to be building in a base in the mid-$80s.
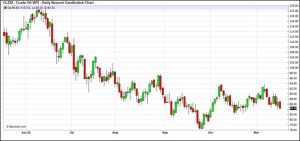
(Source: Barchart.com)
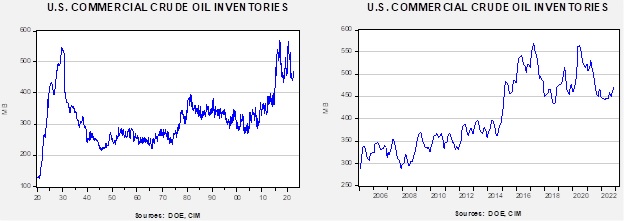
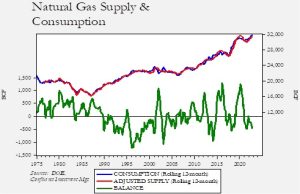
Crude oil inventories fell 5.4 mb compared to a 1.9 mb draw forecast. The SPR declined 4.1 mb, meaning the net draw was 9.5 mb.
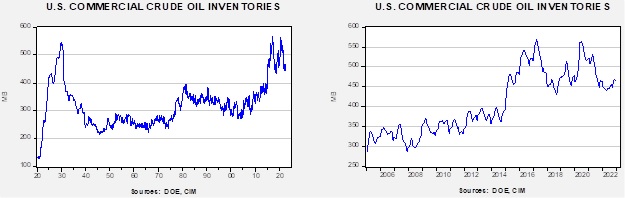
In the details, U.S. crude oil production rose 0.2 mbpd to 12.1 mbpd. Exports declined 0.41 mbpd, while imports rose 0.3 mbpd. Refining activity rose 1.5% to 92.1% of capacity.
(Sources: DOE, CIM)
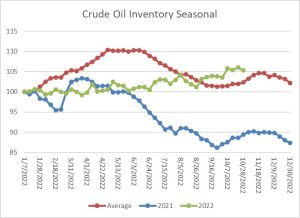
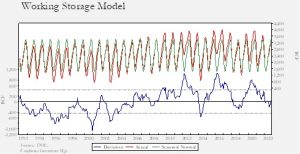
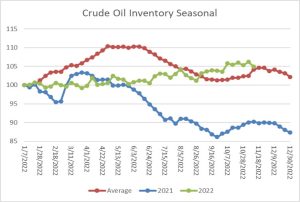
The above chart shows the seasonal pattern for crude oil inventories. As the chart shows, we are past the seasonal trough in inventories and heading toward the secondary peak which occurs later this month. SPR sales have distorted the usual seasonal pattern in this data. This week’s large draw is takes inventories back to the seasonal average.
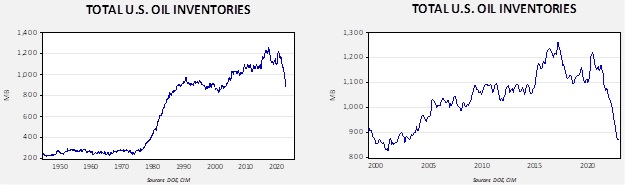
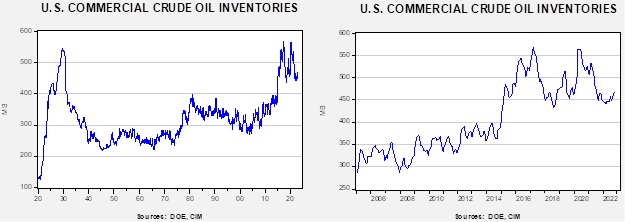
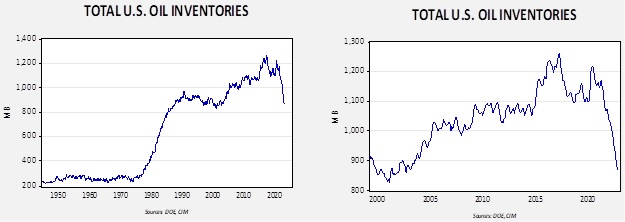
Since the SPR is being used, to some extent, as a buffer stock, we have constructed oil inventory charts incorporating both the SPR and commercial inventories.
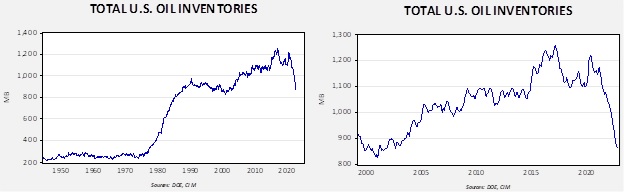
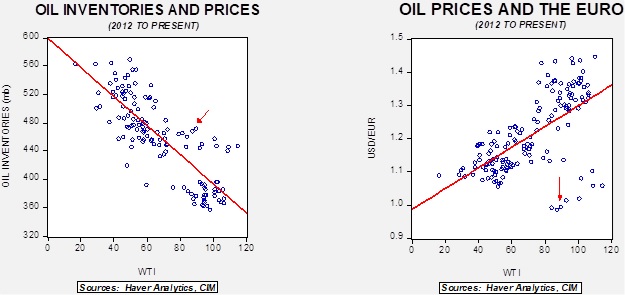
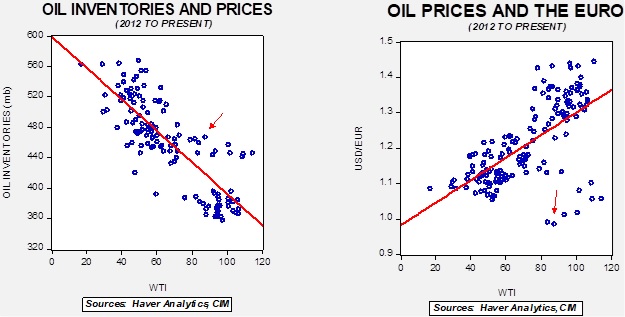
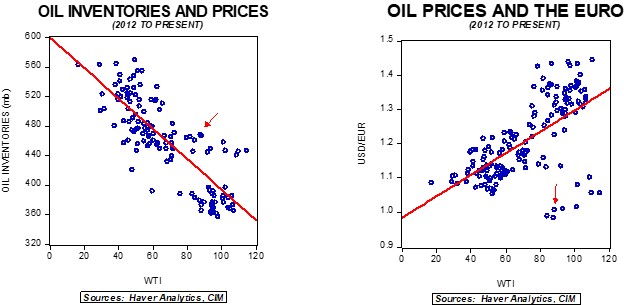
Total stockpiles peaked in 2017 and are now at levels last seen in 2002. Using total stocks since 2015, fair value is $106.63.
Market News:
- China is reportedly easing some of its Zero-COVID restrictions. If the restrictions are lessened, Chinese energy demand will likely rise, which will tighten global energy markets. China’s oil demand has been soft, but we may see it ramp up in the coming weeks if the restrictions continue to be modified.
- OPEC+ cut its demand forecast modestly, which supports its decision to reduce output targets. The cartel warns that the markets might face significant supply volatility due to uncertainty surrounding Russian oil sanctions.
- Pakistan has announced natural gas rationing measures, in part because Europe is getting LNG that would normally go to other nations. However, credit concerns may have also played a role in its lack of supply.
- One of the problems the world will face is that the isolation of Russia will likely lead to a permanent decline in oil and gas production. It will be hard to offset these losses. Comments from Treasury Secretary Yellen, which suggest that sanctions would likely remain in place on Russia even after the war in Ukraine, increase the likelihood that we will see a permanent loss of Russian capacity.
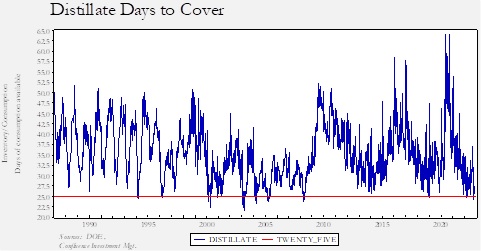
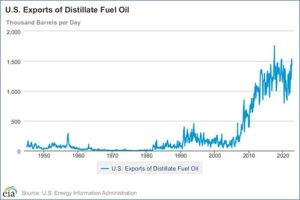
- As we noted last week, tight diesel fuel stocks could lead to high refinery utilization and higher crude oil demand. The positive side is that it will also likely lead to relatively lower gasoline prices. From each barrel of crude oil, about 43% is refined into gasoline and 30% into distillates. Thus, the drive to meet diesel demand will likely mean additional gasoline (and other products too). This situation is causing record diesel fuel/gasoline
- The IEA is warning that tight diesel stocks could exacerbate the European energy crisis.
- New England’s heating oil prices are rising because of tight supplies. Due to shipping regulations (Jones Act) this region tends to import distillates because of their lower cost. This year, however, Europe is buying the distillate that the region usually gets, leading to very tight supplies.
- The implementations of price caps and insurance restrictions on Russian oil are scheduled for December 5, but to date, no details on how these plans will work have been forthcoming. There are growing concerns that without clarity, shipments might be curtailed. For example, a tanker insured at a certain price might unknowingly violate the price cap if one isn’t in place. This outcome could lead to “ghost ships” floating on the high seas with uncertain insurance coverage.
- The U.S. is trying to sell China on the price cap. Although this seems a bit farfetched, we would not be shocked to see Beijing use participation as a way to force Russia to discount prices on its exports to China. In other words, China probably won’t officially participate, but it could take advantage of the plan. We note that China’s purchases of Russian crude oil appear to be declining, which may be due to the lack of storage or weak demand, or the drop could be tied to worries about sanctions. There are reports that Chinese refiners are asking Beijing to protect payment flows and insurance once the caps are in place. India’s refiners are showing caution in buying Russia oil as well. The U.S. isn’t opposed to China or India buying Russian oil, it just wants the purchases to follow the price cap.
- It should be noted that, so far, Russia oil exports have continued despite sanctions.
- In related Russian news, Germany has nationalized Gazprom’s (GAZP.ME, RUB, 198.00) operation in the country.
- Meanwhile, the EU is still working on a price cap for natural gas. The worry there is that if the cap is set too low, LNG might find its way to other markets. The IEA is warning that the EU needs to begin planning to secure supply now for next year. So far, European temperatures have been unusually mild, easing the current strain. Winter forecasts for Europe are calling for a mild winter, which may prevent a major price spike. LNG prices have started to decline due to oversupply.
- Although the mild winter has helped, the debt burden from high energy prices is still very large.
- As we have noted in the past, the supply response to high oil and gas prices has been modest, but it hasn’t been non-existent. For example, Mozambique is sending LNG to Europe for the first time. There are reports of a new oil discovery in Angola, and production is starting in the massive oil fields in offshore Guyana. All the caveats about investment and the “end of oil” still apply, but there is also evidence that there is still some investment occurring. Even in the U.S., the Eagle Ford region is showing a rise in activity.
- Water levels on the Mississippi have disrupted barge traffic, affecting the shipping of bulk goods, including grains, coal, and iron.
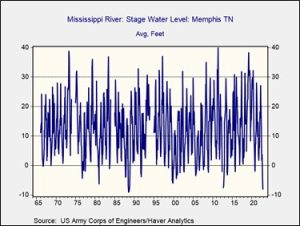
- About 30% of condensates and other natural gas liquids are shipped by barge, meaning this market is being disrupted as well. These liquids are used to make petrochemicals and are often part of the refining process. They are often used as a diluent for heavy crude oils.
- The administration has extended methane regulations to gas-gathering pipelines. Extending regulations tends to raise costs.
- Maintenance issues are taking French nuclear power plants offline and boosting natural gas and diesel demand.
Geopolitical News:
- Iran is becoming increasingly aggressive: it is attacking Iraq, its actions against protesters are exceedingly harsh, it has threatened to attack the Kingdom of Saudi Arabia (KSA), it has been caught sending arms to Yemen, and it has teamed up with Russia to support Moscow’s war effort against Ukraine. It has also attacked Israeli oil shipments in the Persian Gulf region with a drone attack this week. Yet despite all of this, the U.S. hasn’t taken steps against the regime in Iran. Although there are extensive sanctions on Iran already, more could be done.
- Iran claims it has built a hypersonic missile. If true, such missiles have no known defenses, which would be a worry for nations in the region. We note, however, that there is no record that Iran has tested such a vehicle. Hypersonic missiles are hard to produce and until there is a verified test, we can only assume they have, at best, an untested prototype.
- Ukrainian analysts have been investigating the Iranian drones used in Russian attacks on Ukraine. They are discovering that, despite sanctions, the drones are mostly constructed with Western parts.
- MI5 is accusing Iran of attempts to kidnap or kill at least 10 people in the U.K.
- Iran and Russia are improving ties. As we noted last week, Iran has been selling drones to Russia. Iran has been under sanctions longer than Russia and is reportedly showing Moscow how to evade trade restrictions. One of the key metrics to sanctions is the price spread between sanctioned and unsanctioned products. Although sanctions are not perfect, they usually raise the cost of selling the product, leading to price discounts. Reports from Asia suggest that the spread on Russian LNG is near market prices, suggesting buyers are willing to risk Western sanctions.
- Russia and Iran are in talks regarding arms sales; Russia may sell warplanes to Iran.
- India, which has always had close ties to Russia (it was a buyer of Soviet defense products), has increased economic ties by purchasing Russian oil.
- Our position has been that the JCPOA is dead. The Biden administration appears to have moved on. The IAEA reports that Iran has been accumulating highly enriched uranium in contradiction to the program.
- Iran has issued a death sentence to a protester and is planning on prosecuting 15k protesters currently under arrest, many of whom are minors.
- Iran continues to attack Kurdish areas of Iraq, arguing that the region is supporting terrorism in Iran. Recent attacks have killed two Kurds.
- The bottom line is that Iran is behaving in an increasingly reckless manner. The lack of caution may reflect internal tensions as evidenced by the ongoing protests or may suggest that the mullahs have decided that if they side with China and Russia, they will have more ability to project power. The U.S. would normally clamp down on Tehran under these circumstances but fears of rising oil prices appear to be hampering America’s response. The administration may be forced, at some point, to simply allow oil prices to rise in order to control Iran’s behavior.
- Although U.S./Saudi relations have clearly cooled, the recent threat from Iran does show that, despite tensions, Riyadh needs U.S protection. Washington is using this fact to extract concessions. For example, the Saudis voted for a U.N. resolution not to recognize the recent Russian annexation of Ukraine’s territory. Riyadh also participated in talks to engineer a prisoner swap between Ukraine and Russia. So far, this hasn’t led to more oil production, but we will continue to watch closely for evidence of a change.
- Although the KSA has officially cut diplomatic relations with Iran, the two nations have been holding backchannel talks in Iraq. One issue is that both nations want a stable Iraq because instability there could adversely affect both countries.
- Last week, we noted that President Xi was making a state visit to the KSA. Trade ties and regional security are the topics for discussion.
- One of the fallouts of the war in Ukraine is the loss of cheap oil and natural gas to Germany. This feedstock was a key component to Germany’s vaunted industrial base, but as costs rise, it will likely force German firms to relocate to areas with cheaper energy sources.
Alternative Energy/Policy News:
- For the most part, we view COP-27 as environmental theater since without an enforcement mechanism, environmental promises are just that. However, we do note that there has been some movement to reduce coal usage in power production.
- The U.S., Japan, and the EU have agreed to offer $20 billion to Indonesia to move away from coal.
- Thwarting this effort is China, who still holds that due to reliability issues, it must burn more coal to ensure energy security.
- California voters did not support a measure to fund EV charging stations by raising taxes on high-income citizens. Without this funding, it isn’t clear how the state will prepare to shift from gasoline to electric vehicles.
- Meanwhile, China’s share of the global EV market continues to grow.
- BMW (BMWYY, $29.46) is building a $1.4 billion operation to expand battery production in China.
- As biofuel research expands, there is a growing concern that without regulatory guidance, the potential for the fuel source will be hampered by inconsistent standards.
- Separating hydrogen from water creates a clean (“green”) product. Unfortunately, it is also energy intensive and expensive. Four U.S. nuclear power reactors are part of a study to see if nuclear power can be used to generate green hydrogen. Meanwhile, a raft of startups are trying to develop other ways to bring down the cost of green hydrogen.
- The U.S. has blocked 1,000 shipments of solar energy components from China on grounds that the products were made by slave labor. There have been rising tensions between the solar installation industry and the non-Chinese solar component industry. The former wants the cheapest product it can find, while the latter wants to compete with China, the world’s low-cost producer. As U.S./Chinese relations deteriorate, the non-Chinese production industry is seeing an opportunity.
- Leaded fuel was used to counter engine knock, though, unfortunately, lead is highly toxic so it was phased out of gasoline in the U.S. over three decades ago. However, small aircraft were excluded from the move to unleaded fuels but are finally making the switch.
- One of the problems of solar and wind energy is that it’s unreliable, so as it expands, utilities must still keep conventional capacity available for periods when the power generated from wind or solar is lacking. The expansion of wind and solar in the western U.S. is leading to reliability issues.
- We are still in the early stages of battery technology. The current industry standard for EVs, the lithium-ion battery, has some flaws as it’s prone to fires, it’s expensive to produce, and it doesn’t have a long life. But, in its favor, it does recharge quickly and is lightweight. The next new thing may be the sodium-ion battery. It’s a bit heavier than the lithium-ion battery, and not as energy dense. New technology, though, is showing rapid improvement. If it flies, it would dramatically reduce the cost of EVs and have much faster recharging capabilities. Better and cheaper batteries are likely the key to widespread EV adoption.
- Asian battery producers have been reluctant to invest in Australian mining that would provide raw materials for batteries, putting the makers at risk of supply shortages.
- EV makers are looking to vertically integrate their operations with miners of key battery materials and with battery manufactures to create secure supply chains.
- China uses lithium-iron-phosphate batteries which are cheaper but have less range than batteries that use nickel.