by Bill O’Grady, Thomas Wash, and Patrick Fearon-Hernandez, CFA | PDF
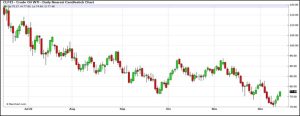
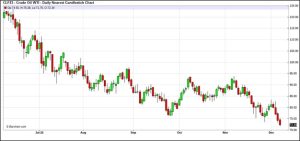
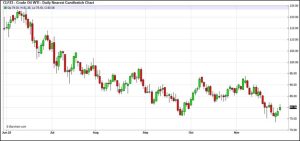
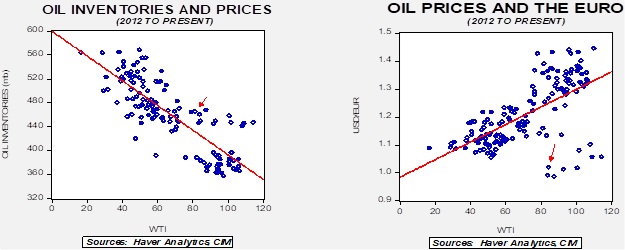
Crude oil prices continue to come under pressure on worries over economic growth, although there is some evidence that prices may be basing between $72 and $82 per barrel.
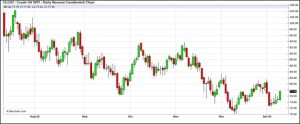
(Source: Barchart.com)
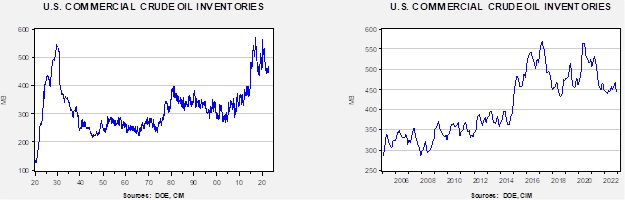
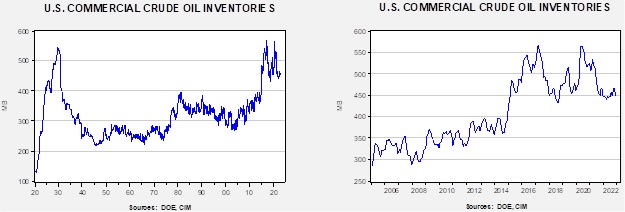
Crude oil inventories jumped 19.0 mb compared to a 3.0 mb draw forecast. The SPR delined 0.8 mb, meaning the net build was 18.2 mb. The unusually large build was caused by a large drop in exports, a rise in imports, and continued depressed refinery operations due to the deep cold snap late last year.
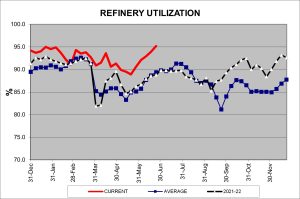
In the details, U.S. crude oil production rose 0.1 mbpd to 12.2 mbpd. Exports fell 2.1 mbpd, while imports rose 0.6 mbpd. Refining activity rose 4.3% to 84.1% of capacity. The Christmas cold snap closed in a significant level of refining activity, and the industry is slowly recovering.
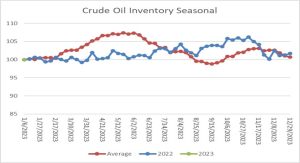
(Sources: DOE, CIM)
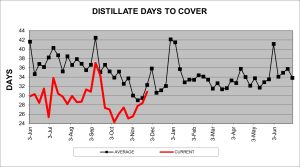
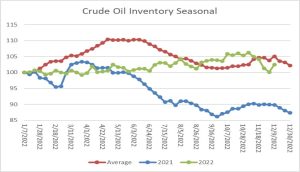
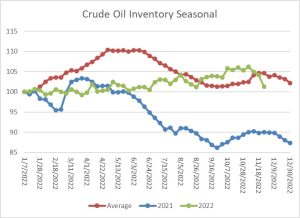
The above chart shows the seasonal pattern for crude oil inventories. Because we are starting the new year, we only have one datapoint for 2023. The chart does show that the usual seasonal pattern was not followed last year. This is because the average still reflects the restrictions on U.S. oil exports whereas there isn’t much of a discernable pattern to this data now that exports are allowed.
This chart shows the sharp drop and partial recovery in refining operations.
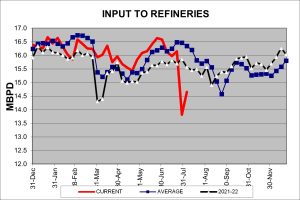 (Sources: DOE, CIM)
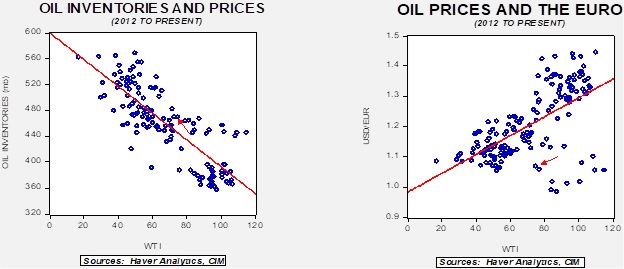
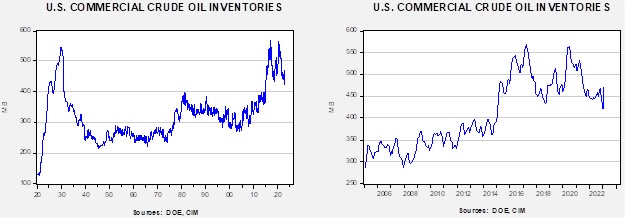
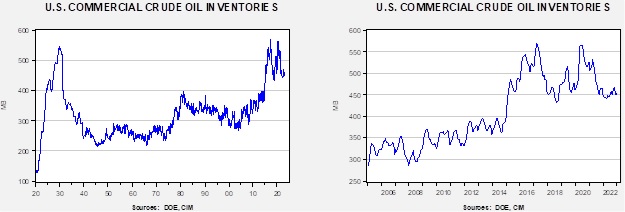
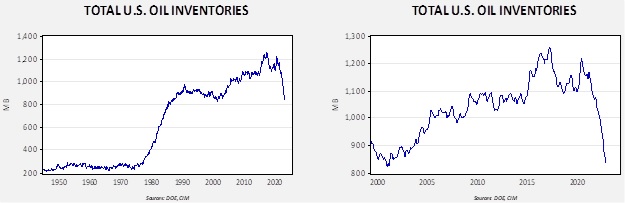
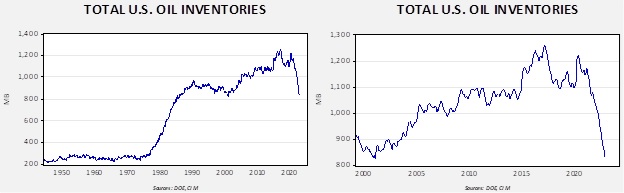
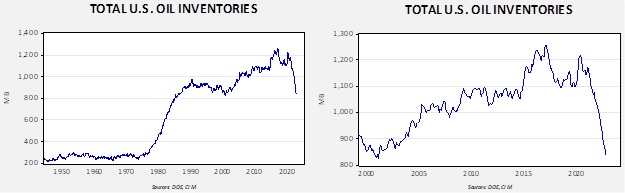
Since the SPR is being used, to some extent, as a buffer stock, we have constructed oil inventory charts incorporating both the SPR and commercial inventories.
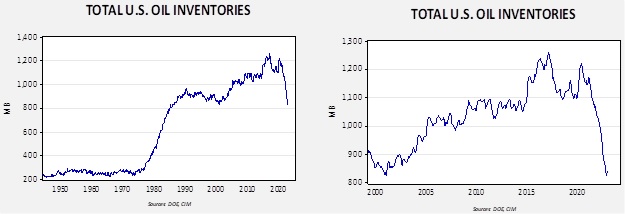
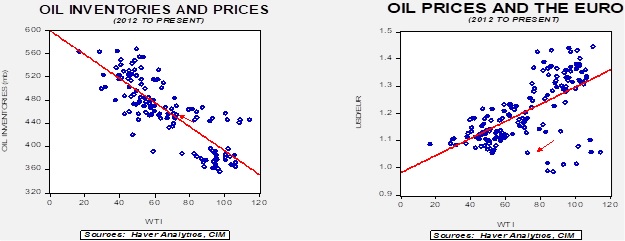
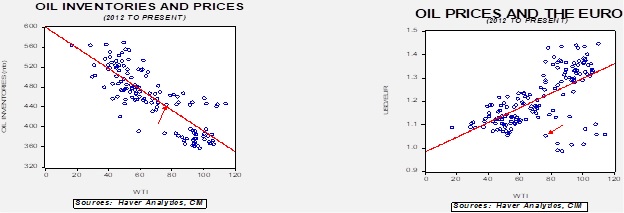
Total stockpiles peaked in 2017 and are now at levels last seen in 2001. Using total stocks since 2015, fair value is $107.08.
Market News:
- As China reopens from its COVID-19 lockdowns, it is increasing its oil import quotas. This decision is likely bullish for crude oil prices. China is expected to buy a significant amount of Russian crude for this reopening, which should be available as the EU price cap has reduced Russian exports.
- OPEC+ production rose modestly in December.
- The DOE is forecasting lower oil prices in 2023 and 2024. For 2023, it is expecting Brent to average $83 per barrel, with $78 per barrel in 2024. Expectations of rising output are behind the lower price forecast.
- We discussed proposed rules for U.S. refiners last year. Further analysis suggests that the costs of the new rules could lead to about a 700 kbpd loss of gasoline production as older refineries become unprofitable. Although we could see some “grandfathering,” refining issues remain a concern.
- As we went into winter, the worry for the EU was that a cold winter would lead to a shortage of natural gas and therefore higher prices. Instead, Europe is being blessed with a historically mild winter. Although these mild temperatures have helped Europe avoid a price crisis this winter, it could portend a hot, dry summer, which could lift natural gas prices later this year. Last year’s dry summer caused havoc in Europe, affecting river travel and reducing nuclear power production, which was adversely affected by the water being too warm and too scarce to cool reactors. Although summer remains a secondary demand season for natural gas, rising temperatures will lift natural gas-fired-electricity demand and may disrupt the inventory cycle, increasing the price risk when the eventual cold winter does occur.

(Source)
- The EU did agree on a price cap for natural gas. Although there are concerns that the cap might be too low to discourage conservation and boost supply, that probably won’t be an issue this winter as prices have dropped for EU natural gas.
- The mild winter and sanctions have reduced Russian gas exports to the EU. The U.K. has officially ended its imports of Russian LNG.
- Mostly mild weather has dampened U.S. natural gas prices as well. However, it is important to note that natural gas isn’t frictionless as evidenced by high natural gas prices in California.
- The epic cold snap that hit the U.S. during Christmas led to a massive shut-in of refining capacity. Although there are worries that the restart may be slow, reports suggest it is underway.
- Although oil companies have been reluctant to boost drilling, there does appear to be increased interest in the Permian Basin by the major oil companies. Smaller companies are also increasing investment.
- One of the side effects of fracking is wastewater, which is usually reinjected into the well. This practice is controversial, however, because it is thought to cause earthquakes. Preventing such events may require the water to be shipped to a disposal site, resulting in increased costs.
- The aggressive selling from the SPR has dampened oil prices, and we estimate that in the absence of SPR sales, oil prices would have reached $135 per barrel. Although the Biden administration has indicated that it wants to buy 3.0 mb of oil to refill the reserve, the above charts suggest that this announcement is, at least so far, a signaling device. We do note that the government intends to offer a fixed price for the oil, suggesting it is putting in a floor on the market. As we have noted in earlier reports, it appears that the SPR is being repurposed as a buffer stock.
- Despite the easing of sanctions, Venezuelan oil exports fell last year.
- The U.S. is likely to become a net exporter of energy in 2023.
- Russia is claiming that Germany and Poland are still receiving shipments of Russian oil.
- One bright spot for oil supplies is Guyana, which appears poised to rapidly expand production this year.
Geopolitical News:
- President Biden has admitted that the restart of the nuclear deal with Iran is “dead.” Iran continues to be a geopolitical hot spot for energy. For example, there are reports that Iran is arming proxies not only in the Levant but also in the south Caucasus. It is also accelerating its nuclear weapons program. The U.S. has sanctioned a number of Iranian officials over the protest crackdowns, but given the extensive sanctions already in place, it seems unlikely that this action will have much of an impact.
- One reason for the escalation in actions designed to be opposed by the U.S. is that there may be divisions within the ruling elite. Ayatollah Khamenei is old and sick, and it is possible that the Islamic Revolutionary Guard Corps may have designs on the leadership, which would end the rule of the clerics. The hostile actions may be due to internal tensions as both sides try to be the most hardline.
- The U.S. Navy seized a large shipment of assault rifles destined for the Houthis in Yemen.
- Iran is suggesting that the Mossad is influencing the Iranian protests.
- A Belgian citizen has been lashed 48 times for his alleged involvement in espionage. The Belgian foreign ministry has protested the action.
- Iran’s leadership does appear to be softening its position on the hijab issue that sparked the recent protests.
- After several weeks of investigation, there is still no public evidence of who was responsible for attacking the Nord Stream pipelines.
- The Saudi Royal Family has tended to treat the oil riches as their own. Now, there are reports that the crown prince is using the Sovereign Wealth Fund in a similar manner.
Alternative Energy/Policy News:
- In a stunning reversal, Japan is ending its phase-out of nuclear power implemented after the Fukushima disaster
- The Korean firm Hanwha (000880, KRW, 27,200) has announced it is building a $2.5 billion solar manufacturing plant in Georgia.
- A new activist group has formed to press major oil companies to reduce carbon emissions.
- The EU expanded its solar power by nearly 50% last year.
- As EVs become more popular, recycling the batteries is becoming an important issue.
- We note that China continues to dominate the auto battery market.
- Although EVs get much of the attention, hybrids will likely top the automobile space for the near future.
- Because the environmental movement is broad, segments are often at odds with each other. The goal of protecting a wildflower in Nevada may prevent a lithium mine from being built.
- We track new developments in battery technology. Sodium/sulfur probably won’t replace lithium in autos, but it may be a winner for large-scale utility storage.
- One of our geopolitical themes is the shift from efficiency to resiliency in supply chains. U.S. officials are worried about dependence on Asia for solar energy, but shifting production to the U.S. will undoubtedly lift costs.
- To lower solar panel costs, India is considering lifting tariffs.
- One of the problems facing the alternative energy industry is one seen in conventional energy too—a lack of workers.

 (Sources: DOE, CIM)