by Bill O’Grady, Thomas Wash, and Patrick Fearon-Hernandez, CFA | PDF
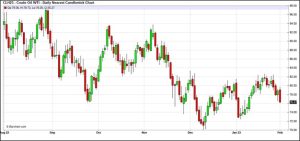
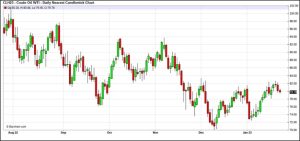
Crude oil prices appear to have based but so far have failed to break above resistance at around $80-$82 per barrel.
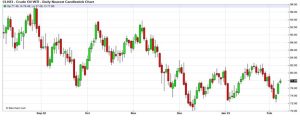
(Source: Barchart.com)
Crude oil inventories rose 2.4 mb compared to a 2.0 mb build forecast. The SPR was unchanged.
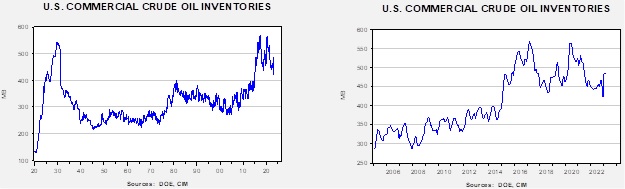
In the details, U.S. crude oil production rose 0.1 mbpd to 12.3 mbpd. Exports fell 0.6 mbpd, while imports declined 0.2 mbpd. Refining activity increased 2.2% to 87.9% of capacity.
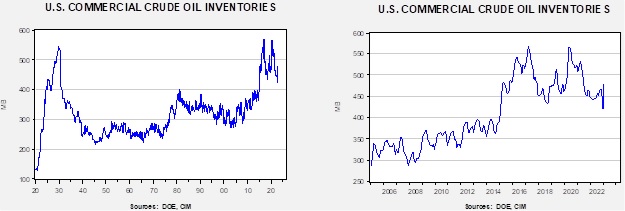
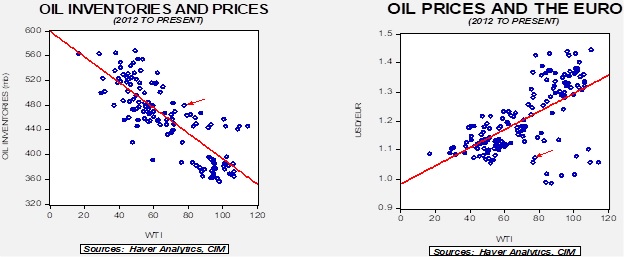
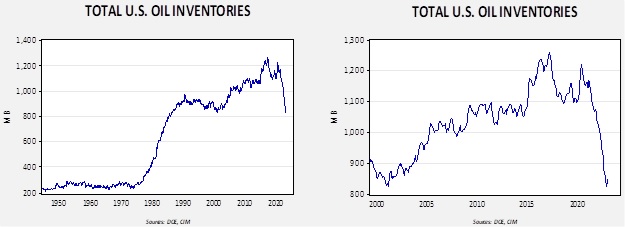
(Sources: DOE, CIM)
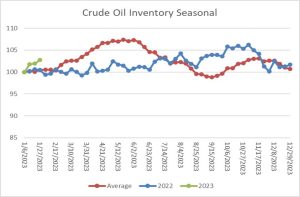
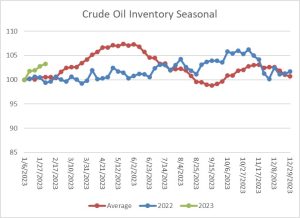
The above chart shows the seasonal pattern for crude oil inventories. Last week’s increase was contra-seasonal. So far, crude oil inventories have been rising this year, mostly because refinery operations have been weaker than normal. As refining activity accelerates, we would look for commercial inventory accumulation to slow.
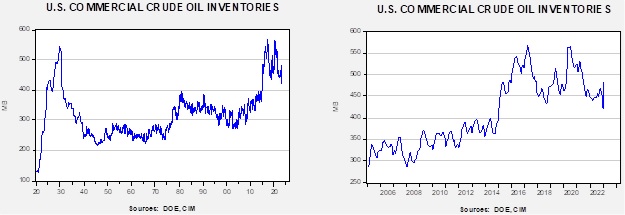
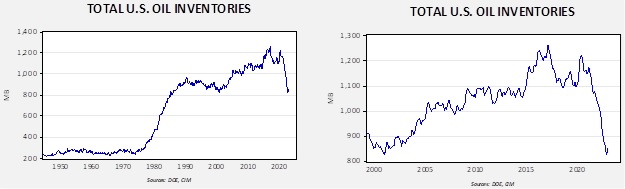
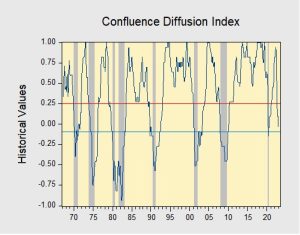
Since the SPR is being used, to some extent, as a buffer stock, we have constructed oil inventory charts incorporating both the SPR and commercial inventories. For the next few months, we expect the SPR level to remain steady, so changes in total stockpiles will be driven solely by commercial adjustments.
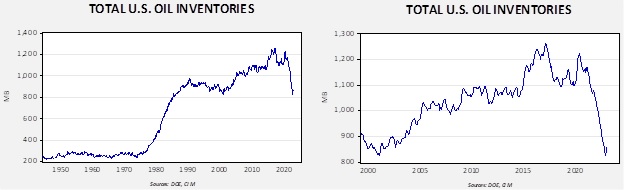
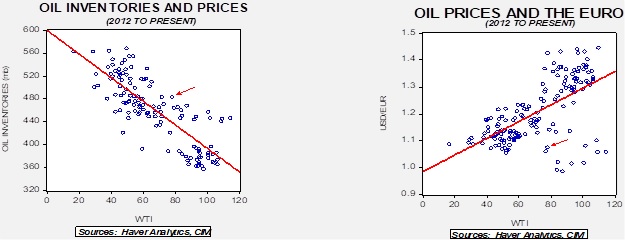
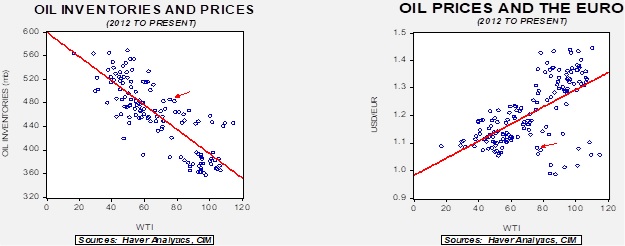
Total stockpiles peaked in 2017 and are now at levels last seen in 2001. Using total stocks since 2015, fair value is $107.07.
Summer:
We don’t usually start thinking about summer until pitchers and catchers report to spring training. By then, the Super Bowl has been played and we are only a couple of weeks away from the kick-off of the NCAA’s “March Madness” tournament. However, we have been watching the gasoline markets and there are some concerns lurking around the bend.
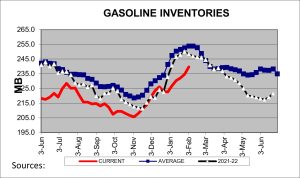
Gasoline inventories are running about 14 mb below their five-year average. Scaled to consumption, inventories are in line with normal, but that’s only because consumption has been weak. We are approaching the usual peak in gasoline stockpiles, since inventories usually decline as refiners clear their winter grade gasoline from surplus to prepare for summer. If we experience the usual drop in the coming weeks, stockpiles could be lower than normal and may trigger higher prices. High gasoline prices are politically sensitive and may trigger another round of SPR releases.
At the same time, we are in the midst of a secular drop in gasoline consumption. The following chart shows annual miles driven by passenger cars and light trucks. In general, the trend in miles driven rose steadily from the early 1970s until the Great Financial Crisis in 2007. We use gray bars to highlight periods when we did not hit a new high in the number of miles driven and note the number of months until a new peak occurred. There was a small dip from 1973 to 1975, which was a product of the Arab Oil Embargo (which pushed up gasoline prices), and a more notable dip in the uptrend from 1979 to 1982, triggered by two U.S. recessions and a spike in prices caused by the disruptions from the Iran/Iraq War. From 1983 until 2007, the rise in driving was relentlessly higher, with only short interruptions typically due to recessions or periods of high prices. After 2007, though, we had a long gap before a new high was reached and the underlying trend clearly declined.
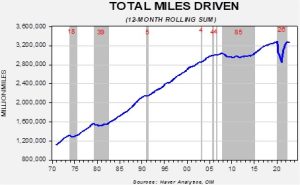
There are likely multiple reasons for the overall change in trend. First, social media has led to friends being able to interact online, rather than needing to drive to meet in person. Working from home and increased urbanization have also likely played a role. Driving less, coupled with steady efficiency improvements, is leading to lower demand for gasoline.
The underlying factors reduce the chances of a gasoline crisis this summer, although the lack of inventory bears watching. Probably the biggest factor that could push gasoline prices higher is crude oil pricing.
Market News:
- The tragic earthquake in Turkey has closed the Ceyhan oil export terminal in southern Turkey. The terminal moves about 1.0 mbpd, with two-thirds coming from Azerbaijan and one-third from Iraqi Kurdistan. Coupled with news that the KSA increased prices to Asia, oil markets were supported this week. We do note that the port of Ceyhan has reopened, but it’s unclear just how long it will take for oil flows to resume.
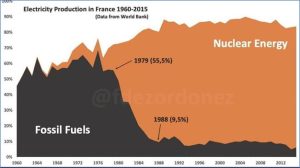
- The IEA has released its annual report on electricity. The report suggests that carbon emissions from electricity are trending lower as wind, solar, and nuclear power expand.
- As we have noted in earlier reports, the Biden administration has approved a drilling project in Alaska over the objections of environmentalists. Although the president campaigned on restricting drilling activity on federal lands, he has found that the courts have not sided with this goal. At the same time, high oil prices tend to soften opposition, so we do expect this project to go forward.
- The administration has been struggling with dissonant objectives on crude oil production. On the one hand, the White House tends to criticize oil companies for not increasing output to quell oil prices, but then on the other it talks about a possible windfall profits tax, which would tend to reduce the incentive for investment.
- This is not just a U.S. issue. EU climate goals, which hope to reduce natural gas imports, are stifling investment in U.S. production and LNG capacity. It may be adversely affecting investment in the Middle East as well. The Qatari energy minister mused recently that the EU will eventually return to buying Russian gas. If that is the expectation, it is foolhardy to expand capacity.
- The EIA is projecting record U.S. crude oil production (on an annual average basis) this year and next, although the growth rate is rather modest (0.1 mbpd this year and 0.4 mbpd in 2024). Much of that production is coming from the Permian Basin.
- Japan is trying to cut coal import costs by burning lower grade coal (which is almost certainly dirtier).
- Colombia’s President Petro made it clear during his campaign that he wanted to curtail the country’s oil and gas industry for climate change reasons. He has moved to ban oil exploration, a risky decision given that crude oil exports accounted for 34% of Colombia’s exports (excluding illegal substances). Because oil is a depleting asset, cutting exploration will lead to falling output in the coming months. Not only will this move hurt Colombia’s economy, it could also reduce global oil supplies.
- Asian oil imports hit a new record in January, and that has occurred before the full effects of China’s reopening have been felt.
- Oil and product prices have been stable recently, but much of that improvement is tied to a mild winter, which has reduced demand. Europe remains short of diesel, so prices could rise in the spring.
- Despite the recent drop in natural gas prices, fertilizer supplies remain tight and could lead to widespread grain shortages.
Geopolitical News:
- The Senate has introduced a bill to block the sale of U.S. SPR oil to China. Although we understand the sentiment, in reality, one of the reasons for creating the reserves was to discourage hoarding. Laws like this signal to China that it might not be able to get oil in a crisis, thus triggering stockpiling, which is then bullish for demand.
- On the topic of hoarding, the EU’s demand for natural gas is reducing supplies available for emerging economies.
- Russia’s fleet of oil and product vessels is said to have reached 600. However, without Western insurance, Russia will still struggle to export oil and products. For example, Turkey is requiring tankers moving through the Bosporus Strait to carry proper insurance.
- Although the current price cap on Russian crude oil is far from perfect, there is some evidence that it is having an impact. Russia is considering taxing oil exports based on the price of Brent crude instead of the Urals price. The latter has typically carried a hefty discount, and in January, the price averaged $49.48 per barrel. Taking this step would clearly harm Russia’s oil companies. This approach may be due to Russia’s widening budget deficit.
- As Russia’s revenues decline, the margin loss is being captured by “middlemen” who facilitate Russian exports.
- The G-7 has increased its sanctions on Russian energy by putting a price cap on Russian petroleum products. This measure coincides with the EU ban on importing Russian oil products. It is likely that Asian nations will begin re-exporting product from Russia to Europe.
- Russia is managing to evade many import restrictions through re-export arrangements with friendly nations. Iran has become a major trading partner for Russia. Since Iran has been under sanctions for decades, it has become adept in circumventing them. Russia is learning from Tehran’s experience.
- However, restrictions on investment may lead to an over 40% decline in Russian oil output by 2035.
- Russia is said to be developing weapons to target underseas cables and pipelines.
- A recently leaked IAEA report suggests that the Iranian nuclear processing plant at Fordow is changing operations in a manner inconsistent with the 2015 JCPOA, but Iran has disputed the findings. In general, there is little doubt that Iran is increasing its uranium enrichment capabilities, but apparently the country doesn’t want to be called out on that by the UN.
- Iran has detained “tens of thousands” of its citizens who engaged in the recent protests. Recently, the government unveiled a pardon process, but the terms appear rather restrictive.
- In an attempt to stop the smuggling of dollars from Iraq to Iran, the U.S. has been restricting dollars going to Baghdad, causing harm to the Iraqi economy. The Iraqi dinar (IQD) has been depreciating, which will increase inflationary pressures on Iraq.
Alternative Energy/Policy News:
- Although there is a rush to build battery capacity, the industry is not known for being all that profitable.
- There is a growing realization that the energy transition away from fossil fuels toward electric will require all sorts of minerals that simply might not be available.
- The Inflation Reduction Act (IRA) has subsidies designed to promote EVs, but the subsidies are restricted to U.S. automakers. Congress is looking to further restrict Chinese components from the supply chain and the subsidies, which may end up restricting overall supply.
- Government programs limit EV subsidies to $55k for sedans and $80k for SUVs. The government is generally treating crossovers as SUVs.
- The IRA subsidies may “price out” the EU and compel European companies to move operations to the U.S.
- Although the outlook for the metals critical to energy transformation is bullish, commodity markets are prone to short-term cycles of shortages and gluts. A glut is apparently developing in cobalt.