by the Asset Allocation Committee | PDF
- Our three-year forecast still includes a relatively mild recession followed by a recovery and the potential for an economic expansion.
- We expect inflation to moderate in the near-term but modestly re-accelerate in the back half of the forecast period given underlying structural influences.
- The Fed’s monetary policy is likely to ease as economic conditions slow. Additionally, we expect a measured and careful approach by the FOMC as the presidential elections draw nearer.
- The duration posture remains short-term. We anticipate the yield curve will begin flattening from its current inverted state.
- In domestic equities, we maintain our value bias as well as large cap cyclical sectors and quality factors within lower market capitalizations.
- International developed markets include an overweight to Japan. We maintain emerging markets exposure in the most risk-accepting portfolio but exclude China.
- Gold exposure is maintained for its benefits as a low-correlation asset along with its potential to act as a haven during economic turmoil and as a hedge against geopolitical risk.
ECONOMIC VIEWPOINTS
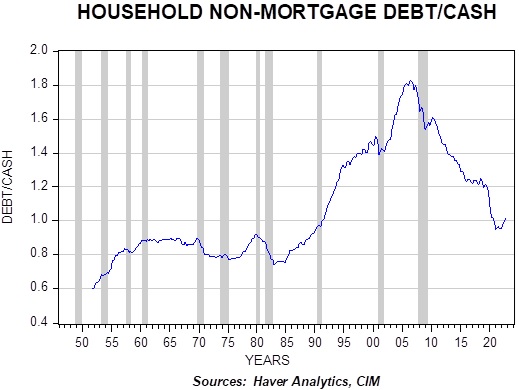
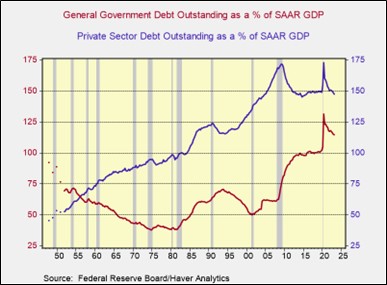
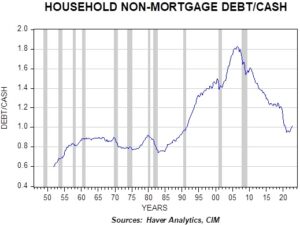
The economy has generally remained resilient despite the Fed’s tightening actions and a widely anticipated recession. While fiscal spending has supported the economy, consumer spending has carried the expansion on the back of strong household balance sheets. However, we are seeing the first signs of slowdown in consumer sentiment. As this chart indicates, household non-mortgage debt-to-cash ratios have crept higher recently, indicating weakening balance sheets which could negatively affect spending. Savings that were bolstered by stimulus payments have now been depleted by strong discretionary spending and inflationary pressures on the overall consumer basket. Early signs of slowing consumer spending are emerging from the Consumer Staples and Discretionary categories, which we believe are due to price elasticities of demand in response to higher inflation. It is significant to note that we are seeing household balance sheets deteriorate even before the resumption of student debt payments. An estimated 37 million borrowers had a three-year reprieve in student debt payments and reports indicate this primarily supported consumption and did not accrue into savings. We expect these debt payments to further suppress spending.
At the same time, labor markets have remained strong with unemployment near cycle lows. The unemployment rate may be artificially understated as employers are hoarding labor in fear of labor shortages even when consumer demand is slowing. Here, again, we are seeing early signs of a slowdown in hours worked and falling rates of wage growth.
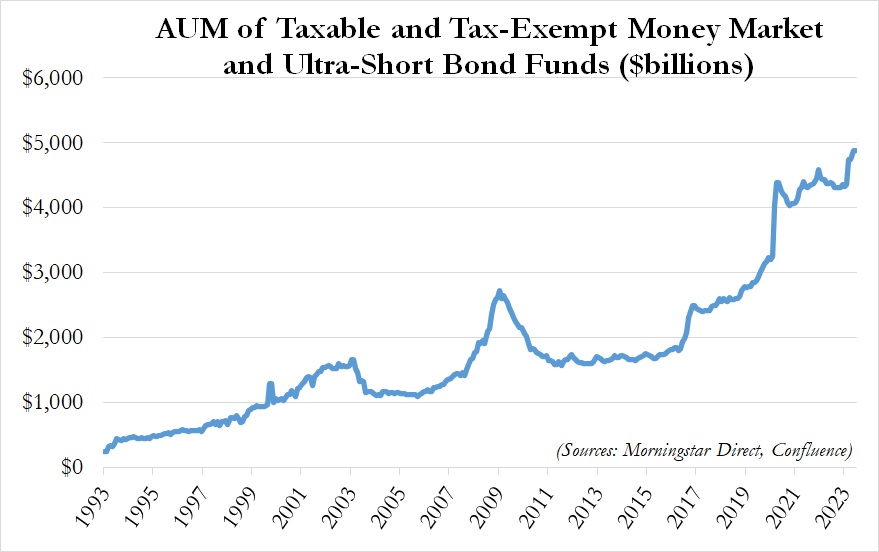
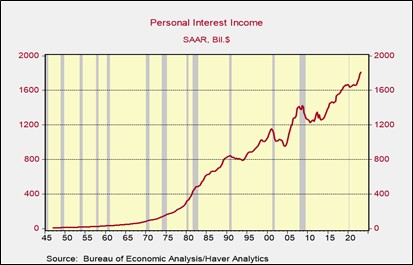
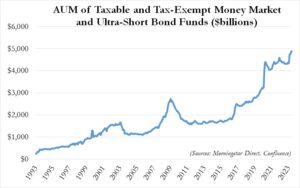
Macro headwinds combined with monetary policy tightening reinforce our forecast for a mild recession, which is likely to be uneven among different segments of the economy. For example, the increased cost of capital is likely to weigh more heavily upon more highly leveraged companies and those embarking on new projects or expansionary efforts. The overall recession is not expected to be severe since it has been widely anticipated and elevated levels of liquidity on the sidelines should provide support to risk markets. As this chart shows, we continue to see historically high levels of money market and ultra-short bond fund assets. These levels are high for two main reasons. First, the inverted yield curve is offering attractive yields in the short end of the curve with low levels of risk. Second, accruing this yield is attractive for investors waiting on the sidelines for a dip in the market, providing support to risk markets.
Inflation is already showing signs of slowing. We believe this is primarily in response to the short-term smoothing of the supply-chain problems and is only secondarily affected by slower demand caused by tightening monetary policy. Our expectation is that inflation will return toward the end of the forecast period due to underlying structural issues, such as deglobalization and aging demographics. We also expect the new inflation regime to be higher than during the ZIRP epoch but lower than it has been since the pandemic.
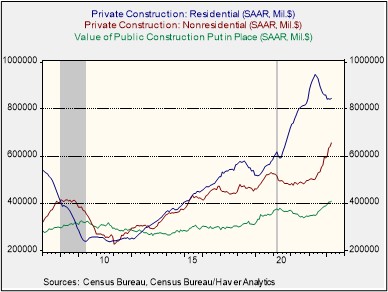
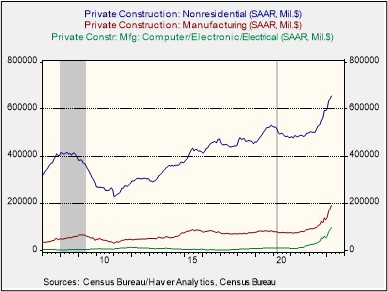
One of the mega-trends supporting domestic economic activity longer-term is the re-shoring of manufacturing capacity and generally shortening supply-chains. Geopolitical tensions are likely to remain elevated and further support international polarization into regional blocs. Reliability of supply is now prioritized over the absolute lowest cost of manufacturing. Capacity buildouts are multi-year endeavors, which will place increasing demands on construction labor and materials initially and skilled labor to operate in the long-term. We believe these pressures, alongside general supply-chain complications, will further reveal inflationary bottlenecks in the economy and could lead to the resurgence of inflation.
We expect the path of monetary policy to be measured and careful over the forecast period, especially as we head into the 2024 presidential elections. Fed fund rates are likely to settle higher following the recession as the FOMC attempts to control a systemically higher inflationary regime.
STOCK MARKET OUTLOOK
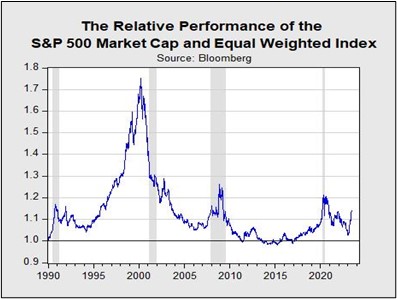
A mild recession is generally discounted into current equity fundamentals, especially lower capitalization stocks. Domestic large cap stock valuations remain near cycle highs, with the expansionary cycle extended by excitement around AI and machine learning. We remain cautious regarding large cap exposure as concentration remains at historic highs. For example, the top 10 names in the S&P 500 accounted for roughly 30% of that index at quarter end. To guard against concentration risk, we lean our style tilt toward value over growth. Additionally, we retain our Aerospace & Defense position and cyclical sector overweights as we project that deglobalization and re-militarization of foreign countries is a sustainable long-term trend. We maintain our sector overweights to Mining, Energy, and Industrials in most strategies. The Mining and Energy sectors are likely to benefit from electrification/green energy policies as electrification is metals heavy.
We believe small and mid-capitalization stock valuations remain attractive, while fundamental earnings power remains healthy. Mid-cap stocks, specifically, remain at historically wide valuation discounts to large cap stocks. Last quarter, we introduced a quality factor in our mid-cap exposure. Similarly, we remain in a quality-screening vehicle on the small cap side. The quality factor screens for profitability, leverage, and cash flows, which should support the group through economic volatility.
We continue leaning into the value bias across all market capitalizations. We view the sustainability of earnings growth as more attractive in equities categorized as value and the fundamental valuation multiples are modest compared to historical data. In addition, value style has a lower exposure to sectors that we view as overpriced. Although growth has vastly outperformed value year-to-date, we anticipate that we are in the early stages of a value outperformance cycle.
International developed equities remain attractively valued, while their earnings potential remains healthy. This quarter, we added a country-specific overweight to Japan as shareholder-friendly reforms are starting to take hold in the country and as capital flows are moving out of the rest of Asia and into Japan, which could potentially lead to earnings multiple expansion. We also forecast positive returns from emerging market stocks on the back of U.S. dollar weakness, although exposure to this asset class is limited to only the most risk-accepting strategy. Given the potential economic slowdown and geopolitical risks stemming from China, we have directed our exposure to an emerging market ex-China investment vehicle.
BOND MARKET OUTLOOK
With the anticipated decline in the fed funds rate (the Fed’s reaction to the recession) and a more docile near-term level of inflation, the most attractive segment of the Treasury curve is in short duration. While our base case is for a flat yield curve to reign by the end of the three-year forecast period, we harbor concerns regarding intermediate-term bonds and especially long-duration bonds. Should inflation reassert itself within the forecast period, yields on long-term debt could rise, exerting downward pressure on prices and resulting in a traditionally shaped yield curve. Consequently, the duration posture of the strategies with income as a component remain short-duration with a concentration in one-year Treasuries.
Among investment-grade corporate bonds, it is notable that spreads have not compressed beyond historic averages, underscoring the absence of investor concern even in the face of the much-anticipated recession. Moreover, corporate debt issuance has been subdued over the past few years and has not led to excessive debt levels on most corporate balance sheets. Nevertheless, it would be consistent with our thesis for spreads to widen modestly as the recession takes hold and the maturing of low coupon debt to be refinanced with bonds reflecting higher rates than what prevailed during the years prior to 2022. As a result, corporate bond exposure in the strategies represents a lower proportion than popular market indices.
In the speculative-grade corporate bond category, we find caution is warranted due to the sizable increase over the past 15 months in the cost of capital for highly leveraged companies that are refinancing debt. As with investment-grade corporates, spreads have been relatively contained. However, an uneven recession is likely to cause spreads on lesser rated corporates rated B or lower, especially those in the distressed category, to widen markedly. Accordingly, all exposures to speculative-grade bonds in the strategies are exclusively in BB-rated debt.
OTHER MARKETS
Allocations to REITs are absent as our forecast for the sector over the near-term calls for continued headwinds and low levels of demand for office and retail space, compounded by the difficulty in arranging financing. Although the strategies similarly avoid broad-based commodities owing to recession-induced pressure on prices, we maintain the allocation to gold across the strategies. We favor the continued gold exposure as it can act as a haven during economic contractions and as a hedge against geopolitical risk. Furthermore, gold can be beneficial due to the potential strength it offers during periods of U.S. dollar weakness and its use as a reserve asset for global central banks.
Read the full report
Asset Allocation Fact Sheet