by Patrick Fearon-Hernandez, CFA, and Thomas Wash
[Posted: 9:30 AM ET] | PDF
Our Comment today opens with news that Israel and Hamas could be on the verge of a cease-fire deal that could help stabilize the Middle East and reduce the risk of disruption in the global energy market. We next review several other international and US developments with the potential to affect the financial markets today, including new trade tensions between the European Union and China and more signs that investors are turning to data centers as a key way to capitalize on the development of artificial intelligence.
Israel-Hamas Conflict: Negotiators from Israel and the militant Hamas government of Gaza are meeting today in Doha, Qatar, to finalize a cease-fire deal that would end Tel Aviv’s attacks on the enclave and release some of the hostages held by Hamas. Officials from Qatar say the deal could be signed and announced as early as today. If signed and implemented, the deal could help stabilize the Middle East and ease concerns about the global energy market.
China-Taiwan: Western defense analysts have discovered that Chinese shipyards are building at least three large, unusual barges with the ability to extend road bridges from their bows. The ships are suspected of being prepared for an eventual Chinese invasion of Taiwan, despite many observers’ expectations that China would more likely impose a naval blockade to force Taiwan into unification with the mainland. Of course, either scenario would likely touch off a security crisis that could draw in the US and the rest of its geopolitical bloc.
European Union-China: The European Commission today said its months-long probe into the Chinese government’s procurement practices found that they discriminate against EU medical devices. The finding sets the stage for EU-China negotiations on changing the practices, but if no agreement is reached, then Brussels could impose retaliatory trade barriers against Beijing. The finding shows how the EU has increasingly aligned with US-style moves to counter China’s aggressive trade practices, which raises the risk of a wider global trade war.
European Union-United States: The European Commission has reportedly launched a review of how it is applying its new digital markets regulation against major US technology firms such as Apple, Meta, and Google. The review could lead to the EU probes against those firms being scaled back or narrowed. The reassessment is apparently linked to concerns that the CEOs of those firms have now become close to President-elect Trump and that tough enforcement action against them could prompt retaliation from the new US administration.
Mexico-China-United States: Mexican President Sheinbaum has announced a plan to cut her country’s big trade deficit with China and mollify critics who say Mexico is now a back-door conduit for Chinese goods being shipped to the US. Sheinbaum’s “Plan Mexico” seeks to boost investment and production in a range of Mexican manufacturing industries, including autos and textiles. If the plan successfully broadens and deepens Mexico’s industrial sector and better protects investors, it could give a boost to the Mexican economy and stock market.
US Demographics: In its annual demographic outlook, the non-partisan Congressional Budget Office lowered its forecast for future US population growth, largely because it now expects even lower fertility and reduced net immigration. The slowdown in population growth and the associated rise in average ages are expected to weigh on overall economic growth and put added fiscal pressures on the federal government.
- The CBO now forecasts that the US population will grow from 346.6 million in 2024 to 361.8 million in 2033, for an average annual growth rate of about 0.48%. In 2033, the CBO expects US deaths to start outnumbering births, meaning all growth thereafter would have to come from net immigration.
- Between 2033 and 2054, the CBO now expects the population to grow to 372.0 million, for an average growth rate in that period of just 0.13%.
US Artificial Intelligence Industry: Major Australian bank Macquarie has agreed to invest up to $5 billion in AI-infrastructure company Applied Digital. Almost $1 billion of that will help cover the costs of a data campus the firm is building in North Dakota, while the rest represents a right of first refusal to invest in future Applied Digital data centers for 30 months. The commitment by Macquarie is yet another sign that top investors see data centers as a major opportunity amid the build-out of computing infrastructure for AI models and applications.
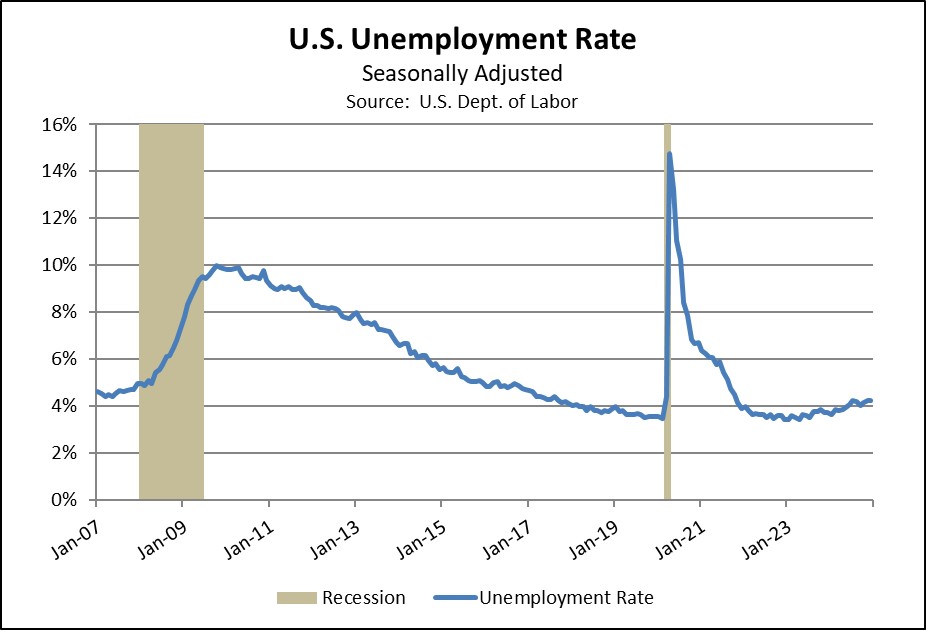
US Military: Internal data shows that the US Army has already enlisted 30,000 new recruits since October 1, achieving almost half its goal of 61,000 for the entire fiscal year and reversing the historically weak recruitment of recent years. Historically, the armed services have struggled to recruit in strong labor markets, so the improvement this fiscal year so far could partly reflect the modestly higher rate of civilian unemployment since early 2023.
- The improvement also reportedly reflects the Army’s success with new recruiting programs.
- For example, since many youths today struggle to meet the Army’s physical-fitness and educational standards, the new programs help young people get into shape and boost their scores on the Army entrance exam. Other programs have helped by giving recruits more freedom in choosing their initial duty station.