by the Asset Allocation Committee | PDF
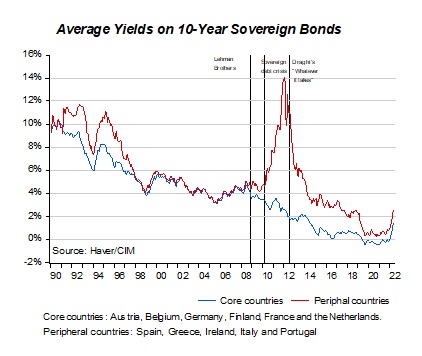
In the June 27 report, we discussed the idea that the FOMC may focus on reducing job openings rather than raising the unemployment rate as a way to ease labor-market tightness. The consensus from the establishment survey portion of the June payroll report, which questions employers, was that hiring remained elevated. The other part of the survey, the household survey, comes from households, and generates the unemployment rate among other statistics. The household survey showed a decline in employment, but the unemployment rate held steady because the labor force fell by a similar amount.
Although the payroll survey is considered by most economists to be the most reliable data from the employment report, the unemployment rate, which compares employment to the labor force[1] from the household survey, garners the most public attention. Our concern is that changes in demographics may lead to an unemployment rate that may not reflect a weakening labor market.
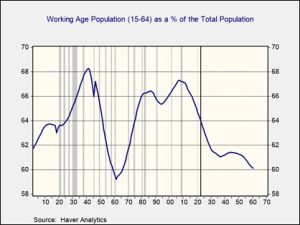
The chart above shows the percent of the “working age population” relative to the total population. To capture the past 120 years of history, the Census Bureau includes 15-year-old citizens, which are not working in the modern economy. But using this age ranges allows us to compare a longer history when these teens were more commonly part of the workforce.
The rise of immigration and improvements in infant mortality rates led to an increase in the working-age population into 1940. Before this, restrictions on immigration which began in the mid-1920s, World War II, and the Great Depression all negatively affected birth rates. The “baby boom” after World War II ended initially led to a massive decline in the working-age population which started to reverse in 1960 when the first “boomers” born in 1946 began to enter the workforce age range. The steady progression of baby boomers entering this age bracket led to a steady rise in the working-age population until it peaked in 2006. Since 2006, the working-age population has been declining. We have added a vertical line on the chart to differentiate between actual and the Census Bureau’s forecast. The current and forecast data suggest the number of available workers could decline in the coming years.
How could this fate be avoided? There are essentially three ways. First, immigration could rise. The political environment suggests that this is unlikely. Second, increasing the number of workers in the prime-age category might boost the work force; currently 74.4% of those in the age category of 16-64 are actively participating in work. Additional training, subsidized childcare, relocation assistance, and other policies might encourage higher rates of employment. Third, encouraging older workers to continue working could also increase employment. For the most part, the third tactic was mostly used until the pandemic.
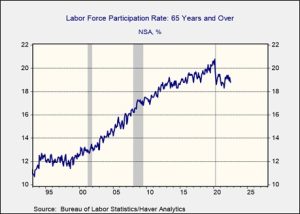
But, since the pandemic, participation of those over 65 years-of-age has declined and is not showing signs of recovering.
So, how could a falling labor force lead policymakers astray? To capture this issue, we have created an indicator that is the difference between the yearly change in CPI and the unemployment rate. In modeling this indicator relative to the policy rate, it shows that the FOMC’s policy is still too easy.
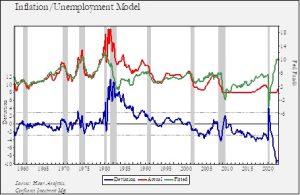
The model suggests that the fed funds target should be 10.3%; such a rate is unfathomable. We do note, however, that with the exceptions of 2006-07 and recessions, fed funds have been below the fitted rate this century. Still, to move fed funds to the one standard error level (the lower parallel line on the deviation axis) would require a fed funds in the neighborhood of 7%.
To narrow the deviation, the unemployment rate needs to rise, and inflation needs to fall. Inflation has remained stubbornly high but will likely start to decline at some point. But as the above demographics suggest, it might take a sharp drop in employment to raise the unemployment rate in a world where the labor force isn’t likely to grow very fast. The chart above highlights the dilemma.
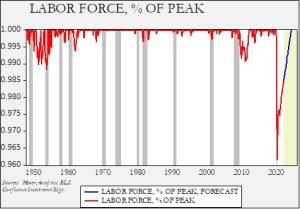
The chart above measures the labor force relative to its peak. A reading of one indicates a new peak in the labor force. Note that in the early 1950s, when the working-age population was declining relative to the population as a whole, it was not uncommon for the labor force not to rise to the earlier peak in expansions. But, as the working age population rose, new peaks became common. The pandemic led to a massive decline in the labor force, and although it has steadily recovered it remains well below the earlier peak. The forecast we created is based on the Bureau of Labor Statistics estimates of labor-force growth this decade. Based on this forecast, we won’t make a new peak before mid-2024. If a recession occurs before that point, an event that appears increasingly likely, we won’t make a new peak in this expansion, which is something we haven’t done since the early 1950s. That factor will keep the unemployment rate lower than it otherwise would be and may lead the FOMC to tighten policy more than expected.
[1] Defined as those working and those unemployed but actively seeking employment.